. 2021 Mar 4;108(3):446-457.
doi: 10.1016/j.ajhg.2021.01.013. Epub 2021 Feb 17.

Loss of α-actinin-3 during human evolution provides superior cold resilience and muscle heat generation

Affiliations

Loss of α-actinin-3 during human evolution provides superior cold resilience and muscle heat generation

Victoria L Wyckelsma et al. Am J Hum Genet. .

Abstract

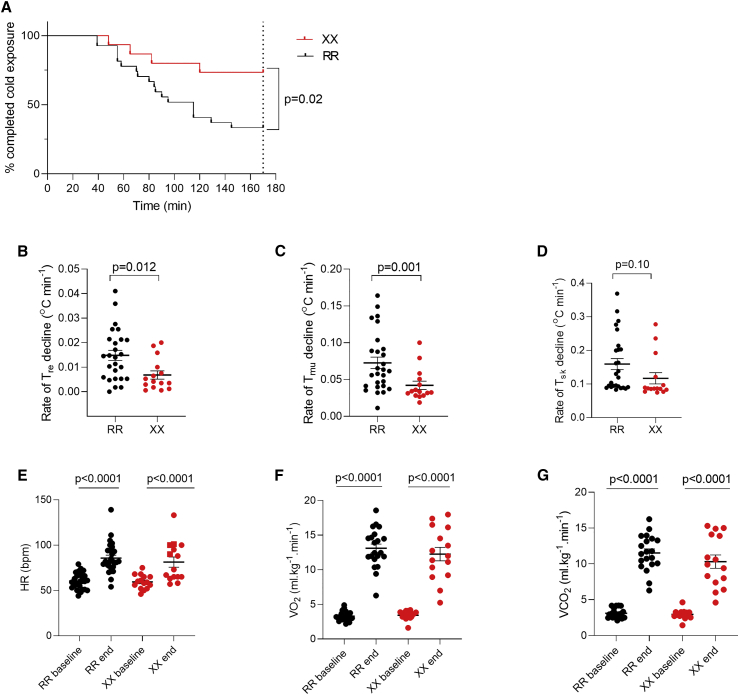
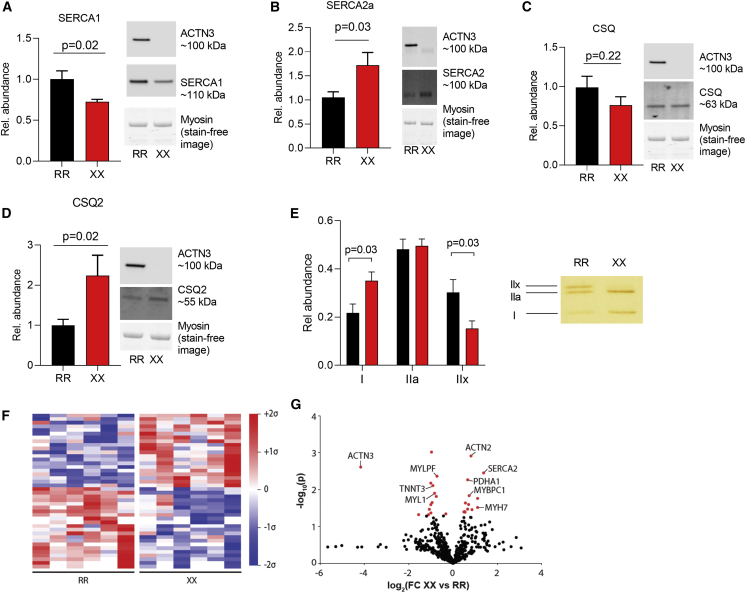
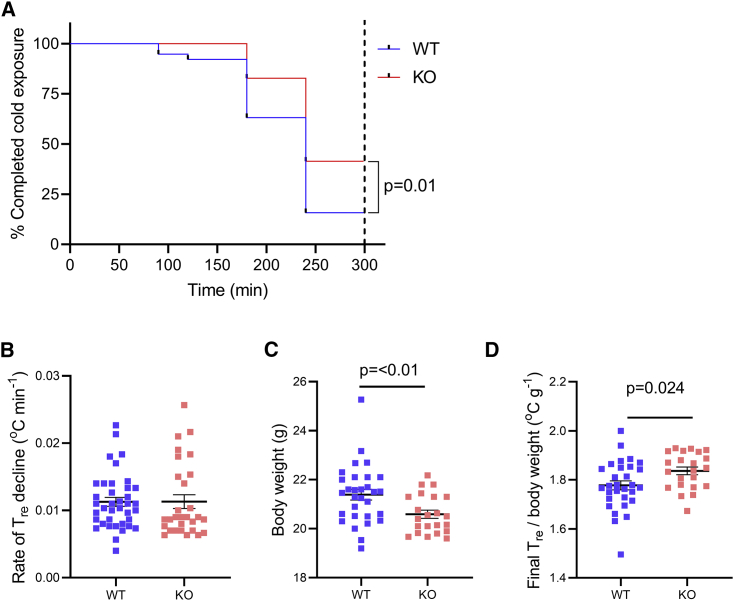
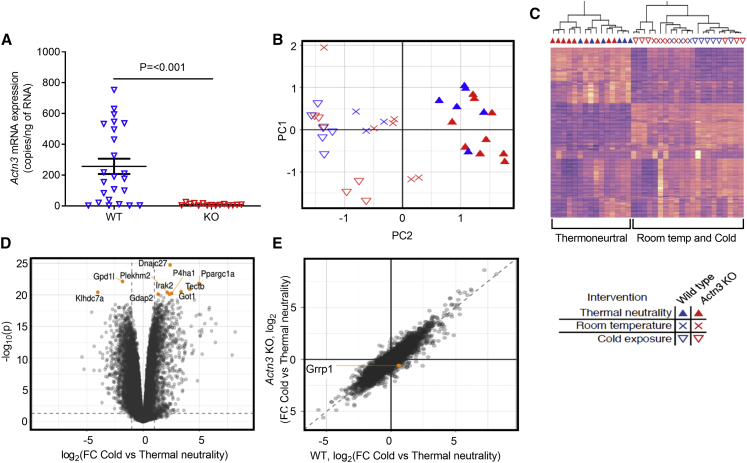
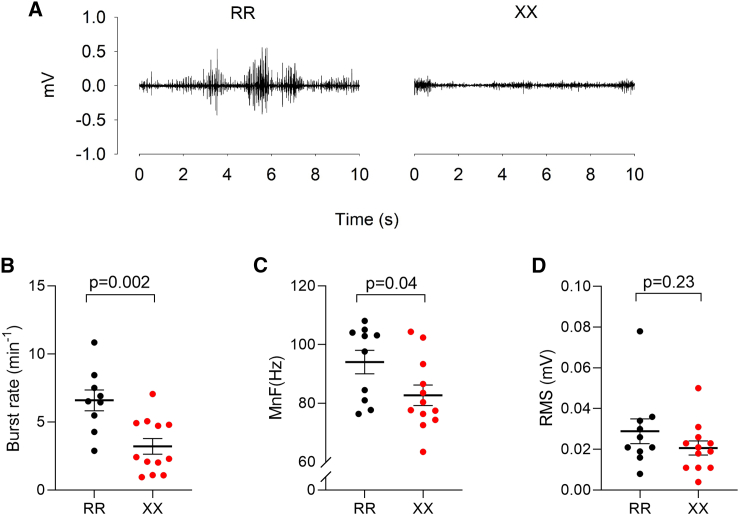
The protein α-actinin-3 expressed in fast-twitch skeletal muscle fiber is absent in 1.5 billion people worldwide due to homozygosity for a nonsense polymorphism in ACTN3 (R577X). The prevalence of the 577X allele increased as modern humans moved to colder climates, suggesting a link between α-actinin-3 deficiency and improved cold tolerance. Here, we show that humans lacking α-actinin-3 (XX) are superior in maintaining core body temperature during cold-water immersion due to changes in skeletal muscle thermogenesis. Muscles of XX individuals displayed a shift toward more slow-twitch isoforms of myosin heavy chain (MyHC) and sarcoplasmic reticulum (SR) proteins, accompanied by altered neuronal muscle activation resulting in increased tone rather than overt shivering. Experiments on Actn3 knockout mice showed no alterations in brown adipose tissue (BAT) properties that could explain the improved cold tolerance in XX individuals. Thus, this study provides a mechanism for the positive selection of the ACTN3 X-allele in cold climates and supports a key thermogenic role of skeletal muscle during cold exposure in humans.

Keywords: alpha-actinin-3 deficincy; brown adipose tissue; energy efficient thermogenesis; evolutionary advantage; improved cold tolerance; muscle fiber type; skeletal muscle.


Conflict of interest statement

V.M.L. is founder, CEO, and shareholder of HepaPredict AB. In addition, V.M.L. discloses consultancy work for EnginZyme AB.

Figures

Figure 1
Figure 1
Temperature measurements and physiological responses during cold-water immersion (A) Survival plot of the time taken to reach a rectal temperature (Tre) of 35.5°C or sustaining the complete 170 min period of cold-water immersion in RR (n = 27) and XX (n = 15) individuals. Log-rank (Mantel-COX) test was used to assess statistical difference between RR and XX individuals. (B–D) The decline rate in rectal (Tre), intramuscular (Tmu), and skin (Tsk) temperatures in RR and XX subjects. Statistical difference between the two groups was assessed with unpaired t test. (E–G) Heart rate and rate of pulmonary O2 uptake (VO2) and CO2 exhalation (VCO2) before (baseline) and at the end of cold-water immersion in RR and XX subjects. Statistical assessment with 2-way RM ANOVA revealed no differences between the two groups either before or at the end of cold-water exposure. Plots show values for each RR (black circles) and XX (red circles) individual and mean ± SEM.
Figure 2
Figure 2
ACTN3 deficiency is accompanied by a shift toward a slower skeletal muscle phenotype (A–D) Summary data (mean ± SEM) and representative western blots of the SR Ca2+-handling proteins SERCA1, SERCA2a, CSQ, and CSQ2 in muscle of RR (n = 8) and XX (n = 7) individuals. Band intensities were normalized to their respective myosin loading controls. Data expressed relative to the mean value of the RR group, which was set to 1.0. Statistical difference between the two groups was assessed with unpaired t test. (E) Silver-stained gels were used to assess the distribution of MyHC isoforms in RR (n = 7) and XX (n = 7) individuals. Right part shows a representative example of the distribution of MyHC in RR and XX individuals. The total staining of the three MyHC bands was set to 1 in each subject. Statistical difference between the two groups was tested with unpaired t test. (F) Mean-centered sigma-normalized heatmap of differentially expressed proteins (p < 0.05). (G) Volcano plot of all identified proteins (n = 601) expressed as fold-change (FC) in XX compared to RR individuals. Differentially abundant proteins are indicated in red.
Figure 3
Figure 3
Improved cold tolerance in Actn3 KO mice (A) Survival plot of the time taken to reach 35.5°C core body temperature within 5 h exposure to 4°C air temperature in WT (n = 38, blue line) and Actn3 KO (n = 29, red line) mice. Log-rank (Mantel-COX) test was used to assess statistical difference between WT and KO mice. (B and C) The rate of decline in rectal temperature and body weight of WT and Actn3 KO mice. (D) The rectal temperature at the end of the 5 h of cold exposure plotted against the body weight. Plots in (B)–(D) show values for each WT (blue squares) and Actn3 KO (red squares) mouse and mean ± SEM. Statistical differences between the two groups assessed with unpaired t test.
Figure 4
Figure 4
Acute cold exposure induced major, but Actn3 genotype-independent, changes in mouse BAT gene expression (A) Following cold exposure, Actn3 mRNA is present in WT but not in Actn3 KO mice. Plot show values for each WT (blue triangles) and Actn3 KO (red triangles) mouse and mean ± SEM. Statistical difference between the two groups assessed with unpaired t test. (B and C) RNA-sequencing analyses show an effect of temperature but no effect of Actn3 genotype on BAT gene expression with both the principal component analysis (PCA) and heatmap. Description of symbols below heatmap refers to both PCA (B) and heatmap (C). (D) Volcano plot of altered genes confirms that marked changes in BAT gene expression occurs following acute cold exposure, with >2,000 differentially expressed genes identified. Genes showing the largest changes are specified in Table S2. (E) Interaction plot shows no general difference based on Actn3 genotype in BAT following acute cold exposure.
Figure 5
Figure 5
Bursting muscle activity rather than increased muscle tone is more prominent in RR muscles (A) Representative EMG records from pectoralis major muscles during cold exposure showing continuous low-intensity activity in the XX individual and frequent bursts of high-intensity activity in the RR individual. (B–D) Summary data of the burst rate, mean EMG signal frequency (MnF), and amplitude (RMS, root mean square). Plots show values for each RR (black circles) and XX (red circles) individual and mean ± SEM. Statistical differences between RR and XX individuals were assessed with unpaired t test.

References

    1. Mills M., Yang N., Weinberger R., Vander Woude D.L., Beggs A.H., Easteal S., North K. Differential expression of the actin-binding proteins, alpha-actinin-2 and -3, in different species: implications for the evolution of functional redundancy. Hum. Mol. Genet. 2001;10:1335–1346. - PubMed
    1. North K.N., Yang N., Wattanasirichaigoon D., Mills M., Easteal S., Beggs A.H. A common nonsense mutation results in alpha-actinin-3 deficiency in the general population. Nat. Genet. 1999;21:353–354. - PubMed
    1. Quinlan K.G., Seto J.T., Turner N., Vandebrouck A., Floetenmeyer M., Macarthur D.G., Raftery J.M., Lek M., Yang N., Parton R.G. Alpha-actinin-3 deficiency results in reduced glycogen phosphorylase activity and altered calcium handling in skeletal muscle. Hum. Mol. Genet. 2010;19:1335–1346. - PubMed
    1. MacArthur D.G., Seto J.T., Raftery J.M., Quinlan K.G., Huttley G.A., Hook J.W., Lemckert F.A., Kee A.J., Edwards M.R., Berman Y. Loss of ACTN3 gene function alters mouse muscle metabolism and shows evidence of positive selection in humans. Nat. Genet. 2007;39:1261–1265. - PubMed
    1. Houweling P.J., Papadimitriou I.D., Seto J.T., Pérez L.M., Coso J.D., North K.N., Lucia A., Eynon N. Is evolutionary loss our gain? The role of ACTN3 p.Arg577Ter (R577X) genotype in athletic performance, ageing, and disease. Hum. Mutat. 2018;39:1774–1787. - PubMed

Publication types