. 2021 May 15:1759:147370.
doi: 10.1016/j.brainres.2021.147370. Epub 2021 Feb 15.

Interaction of maternal immune activation and genetic interneuronal inhibition

Affiliations

Interaction of maternal immune activation and genetic interneuronal inhibition

Allison Anderson et al. Brain Res. .

Abstract

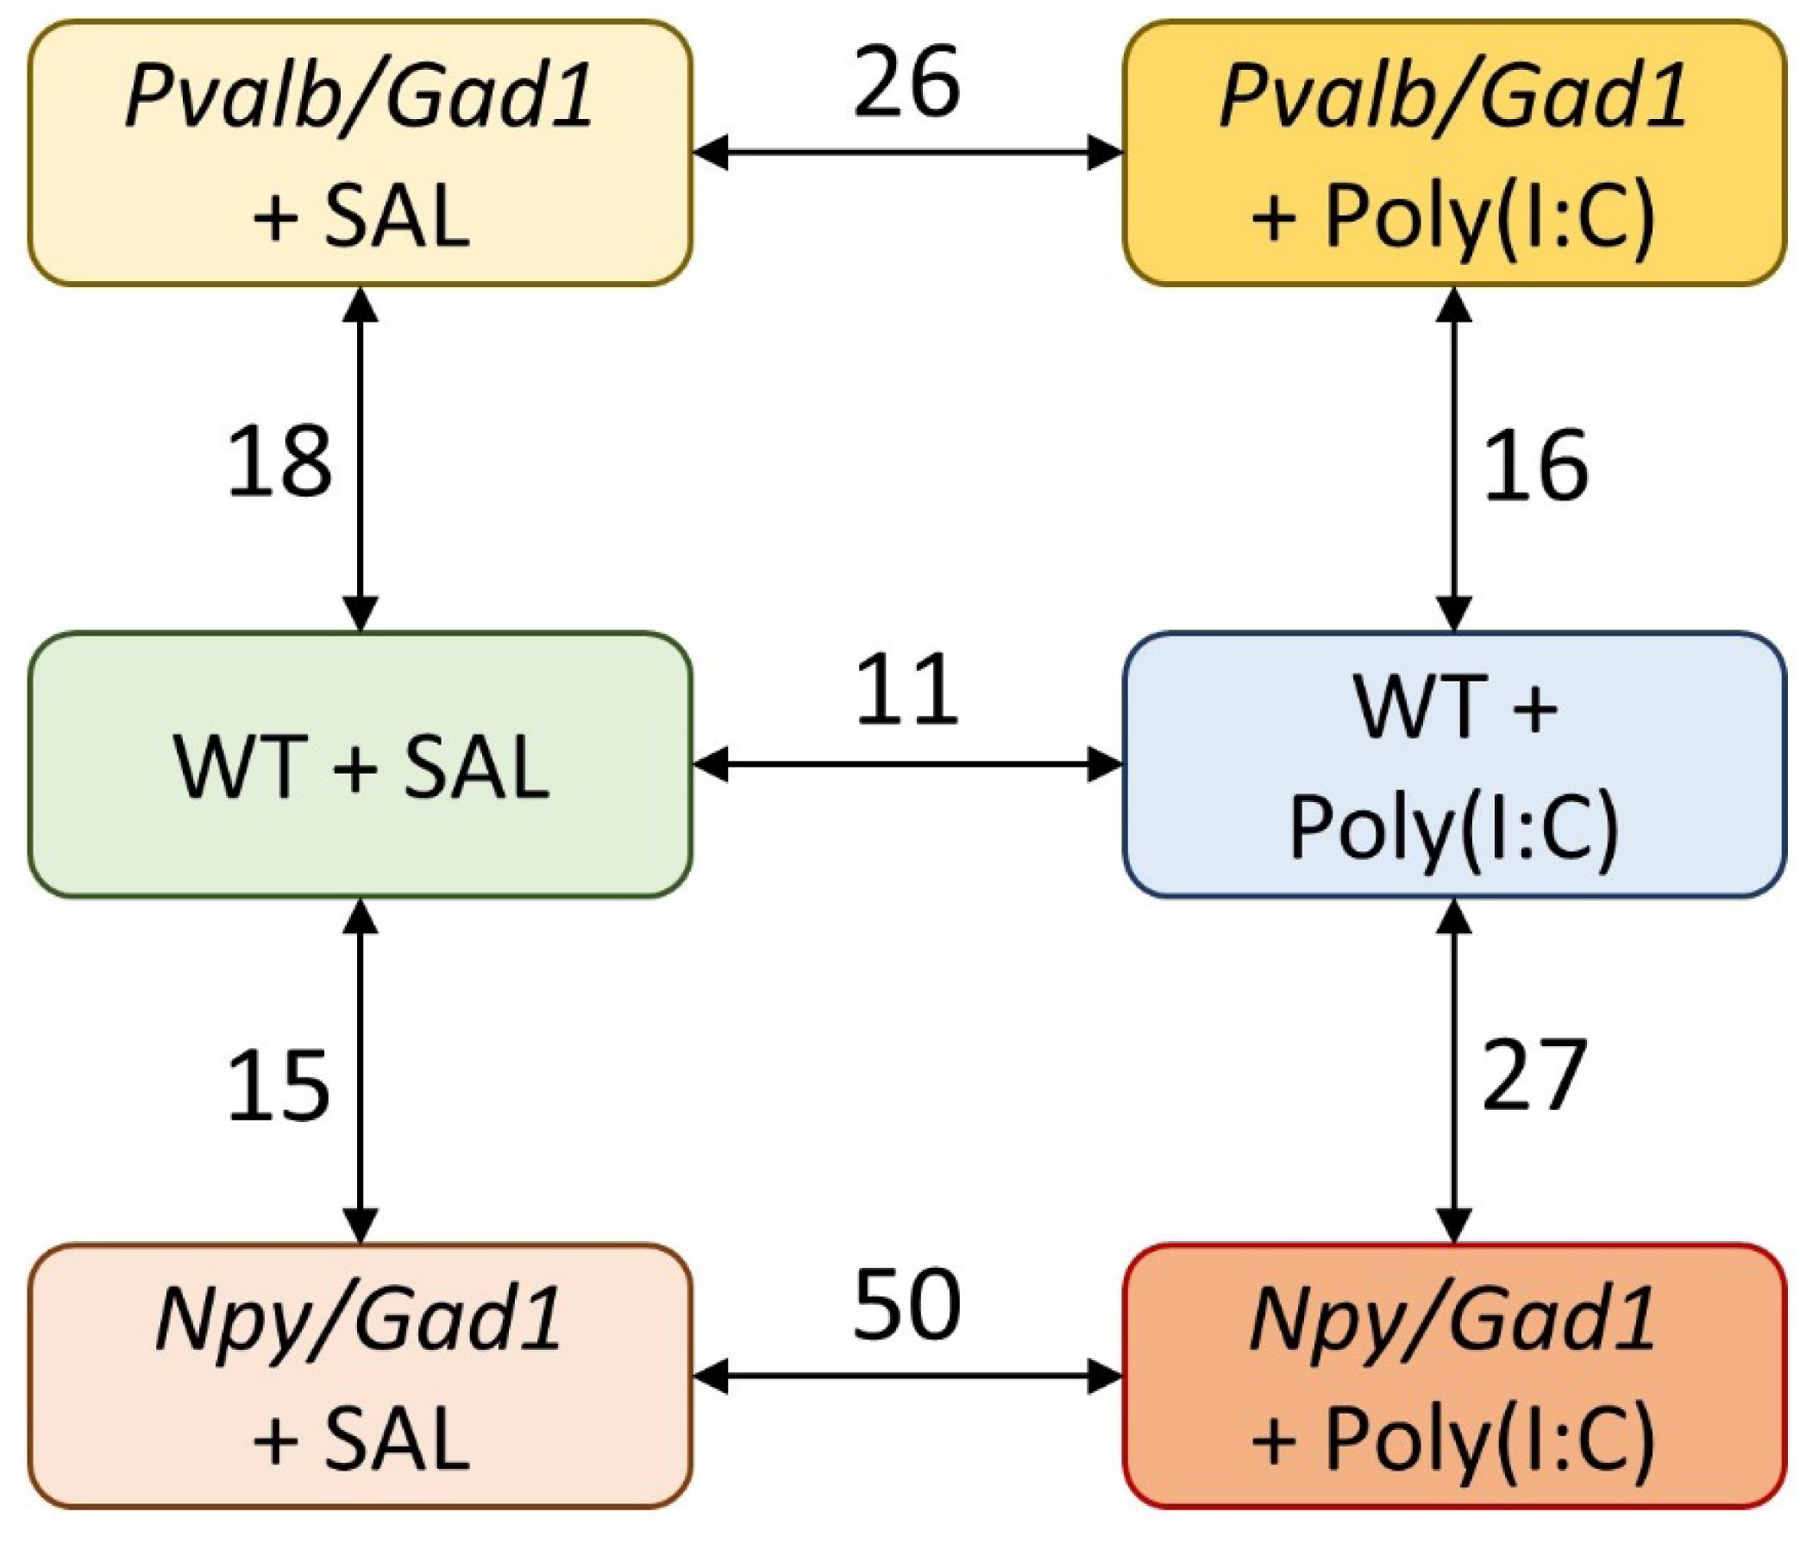
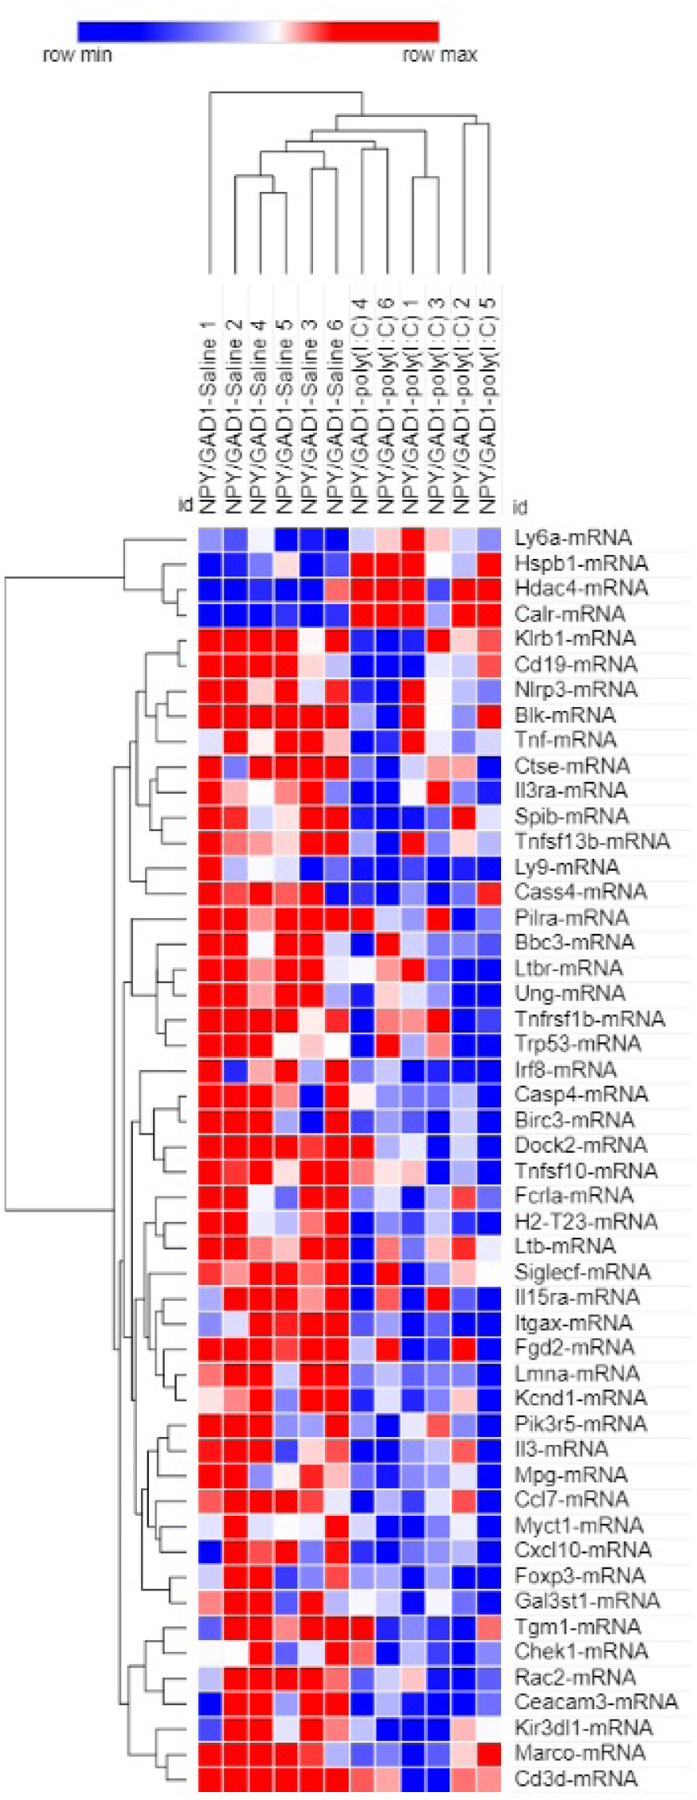
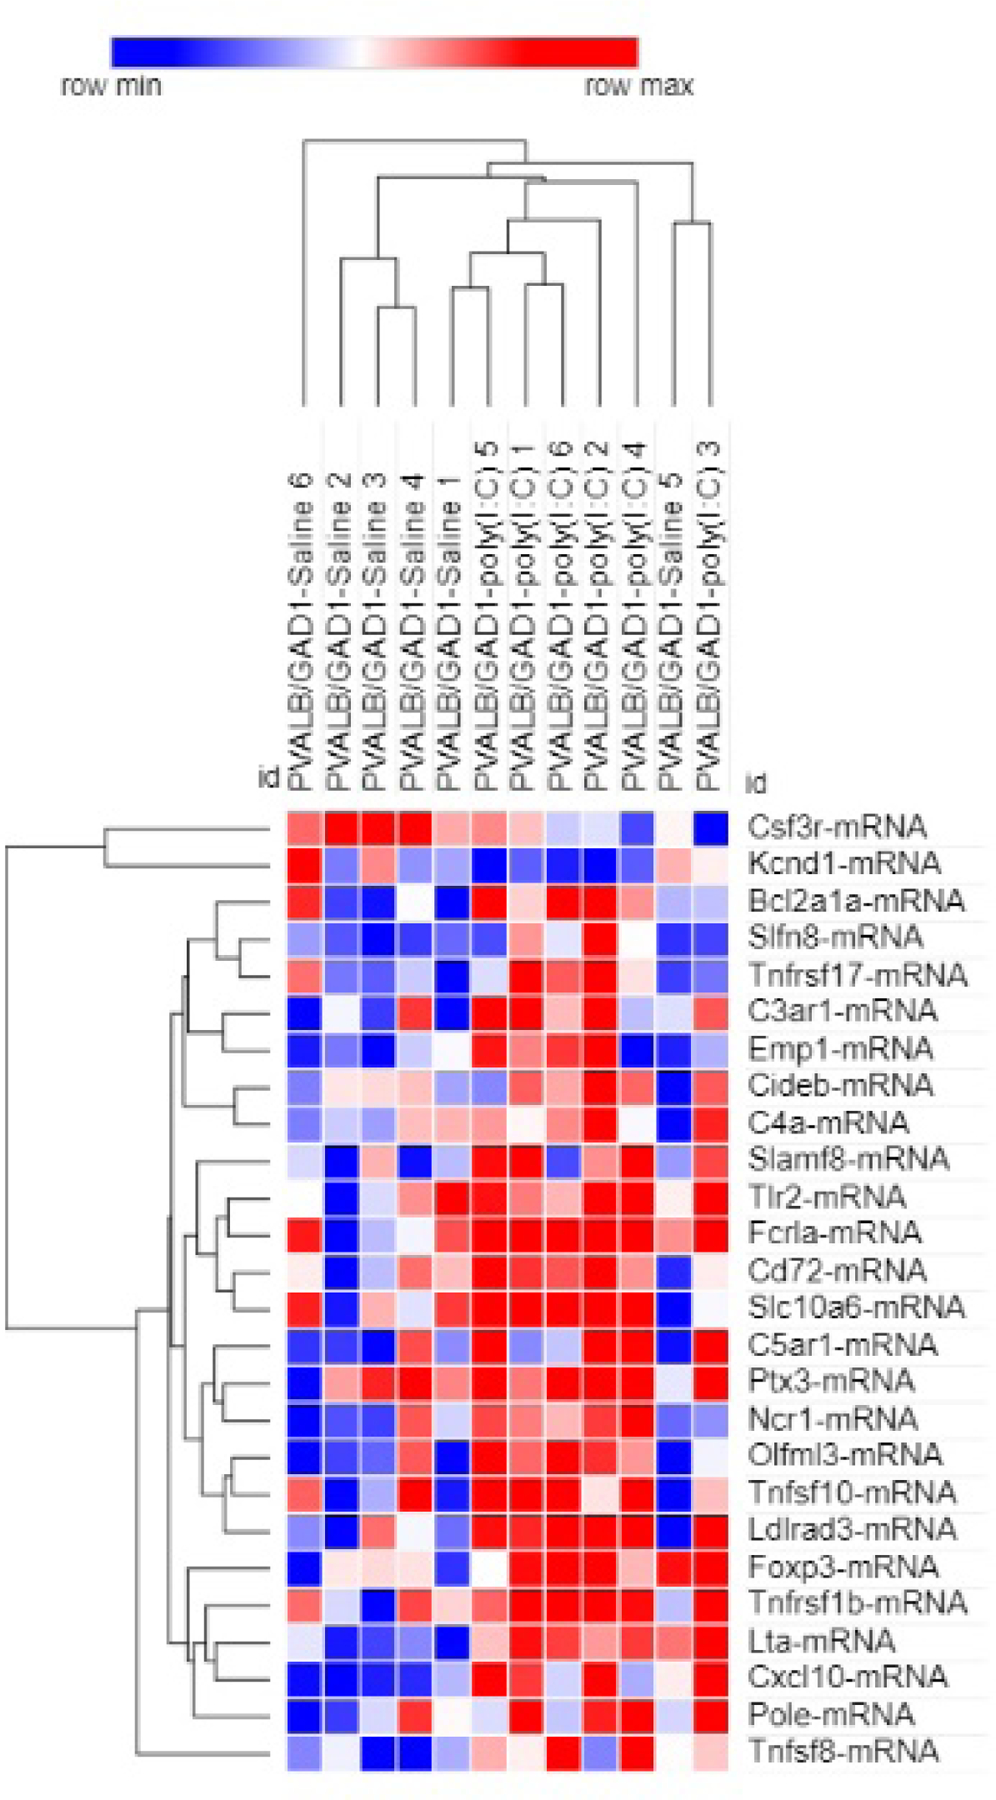
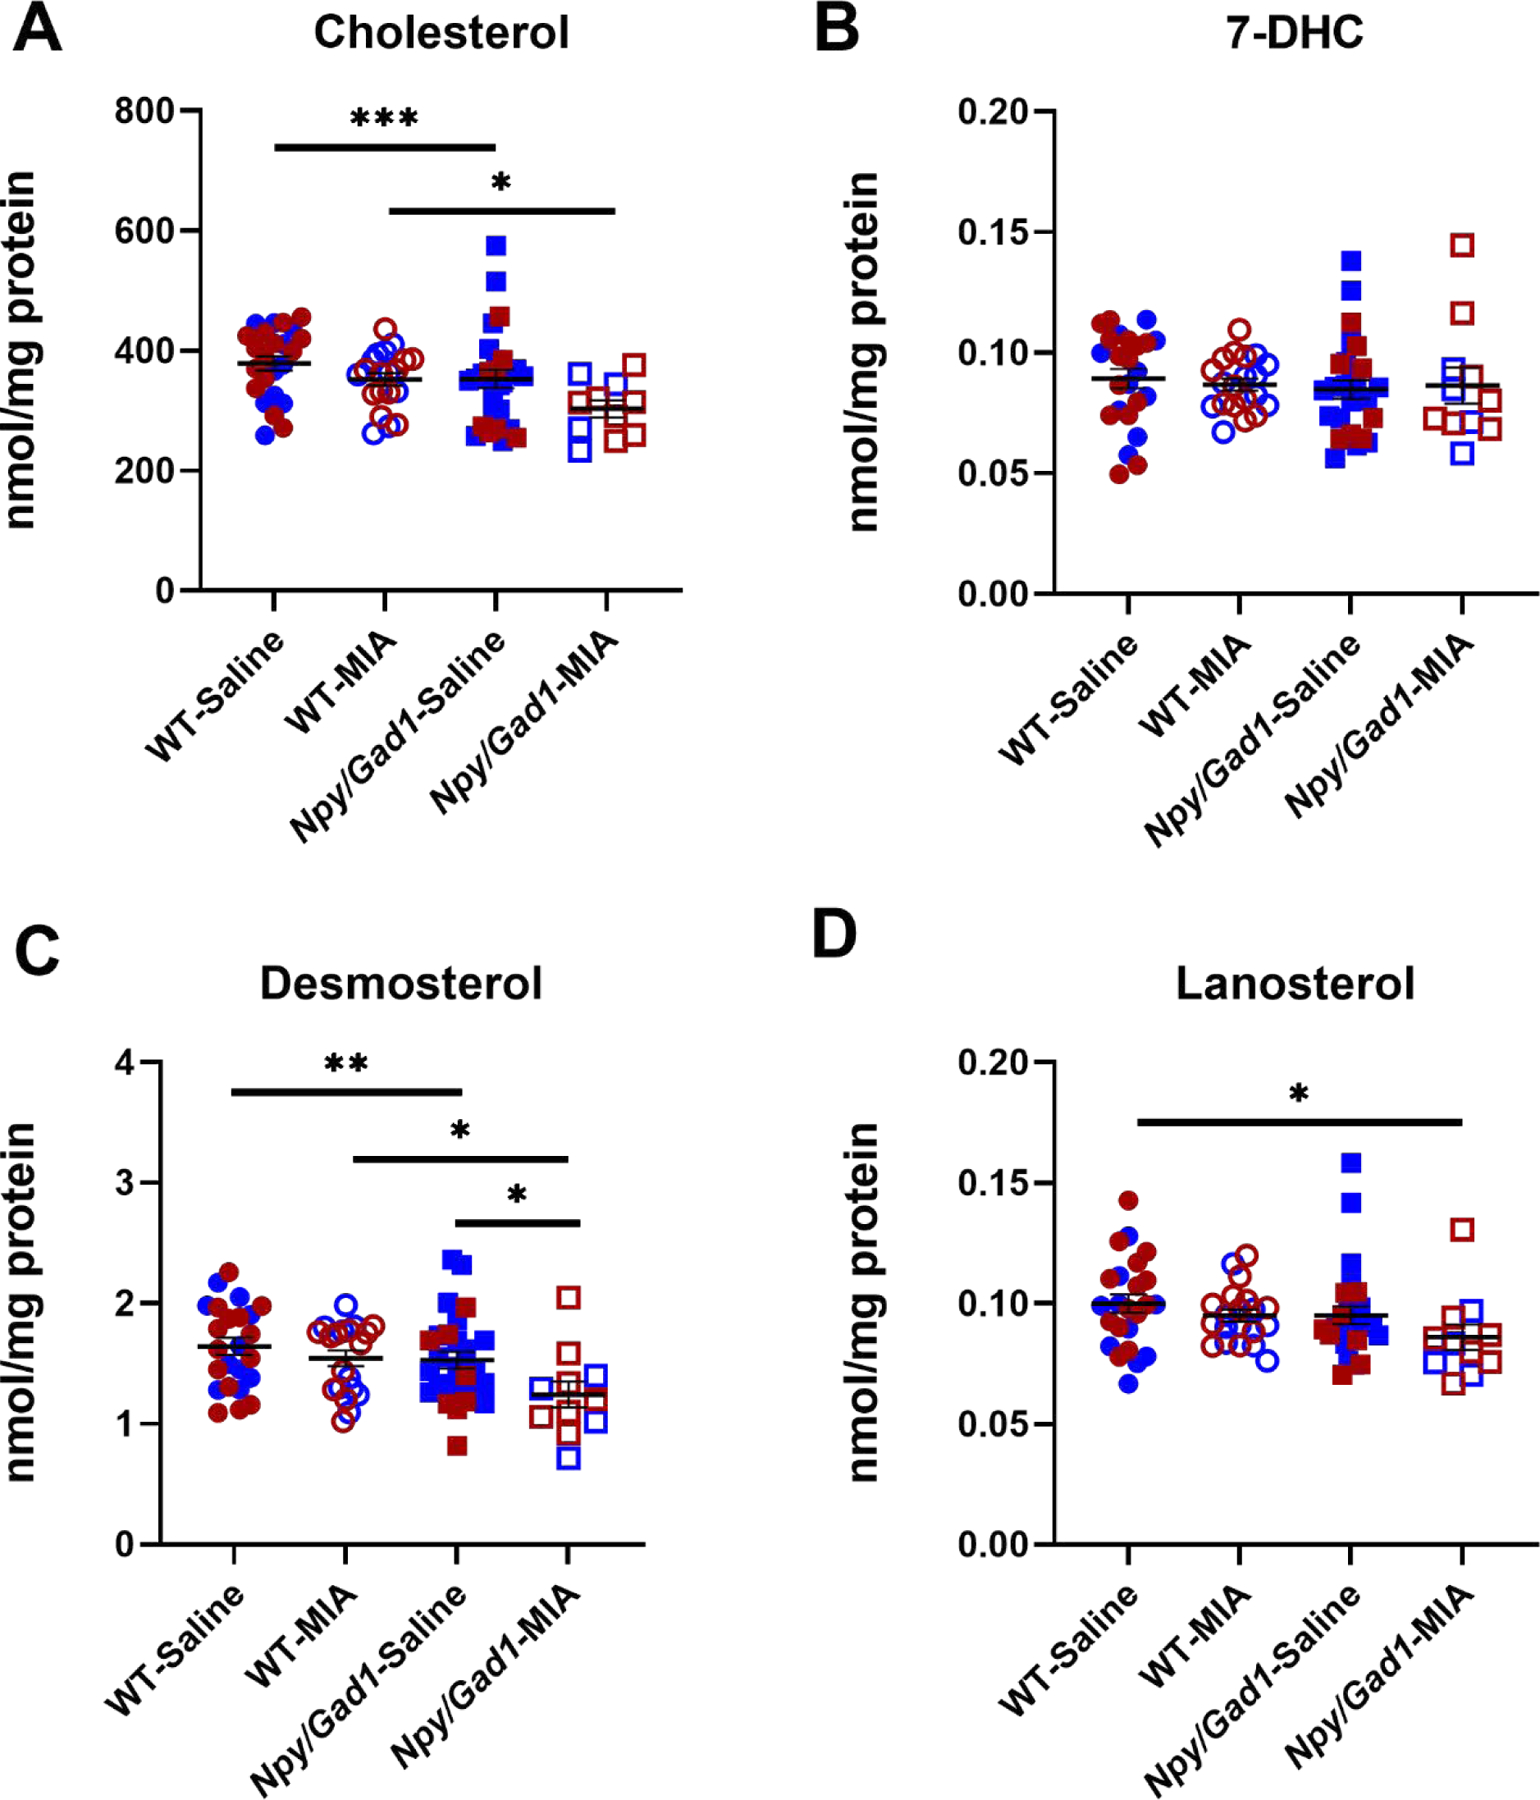
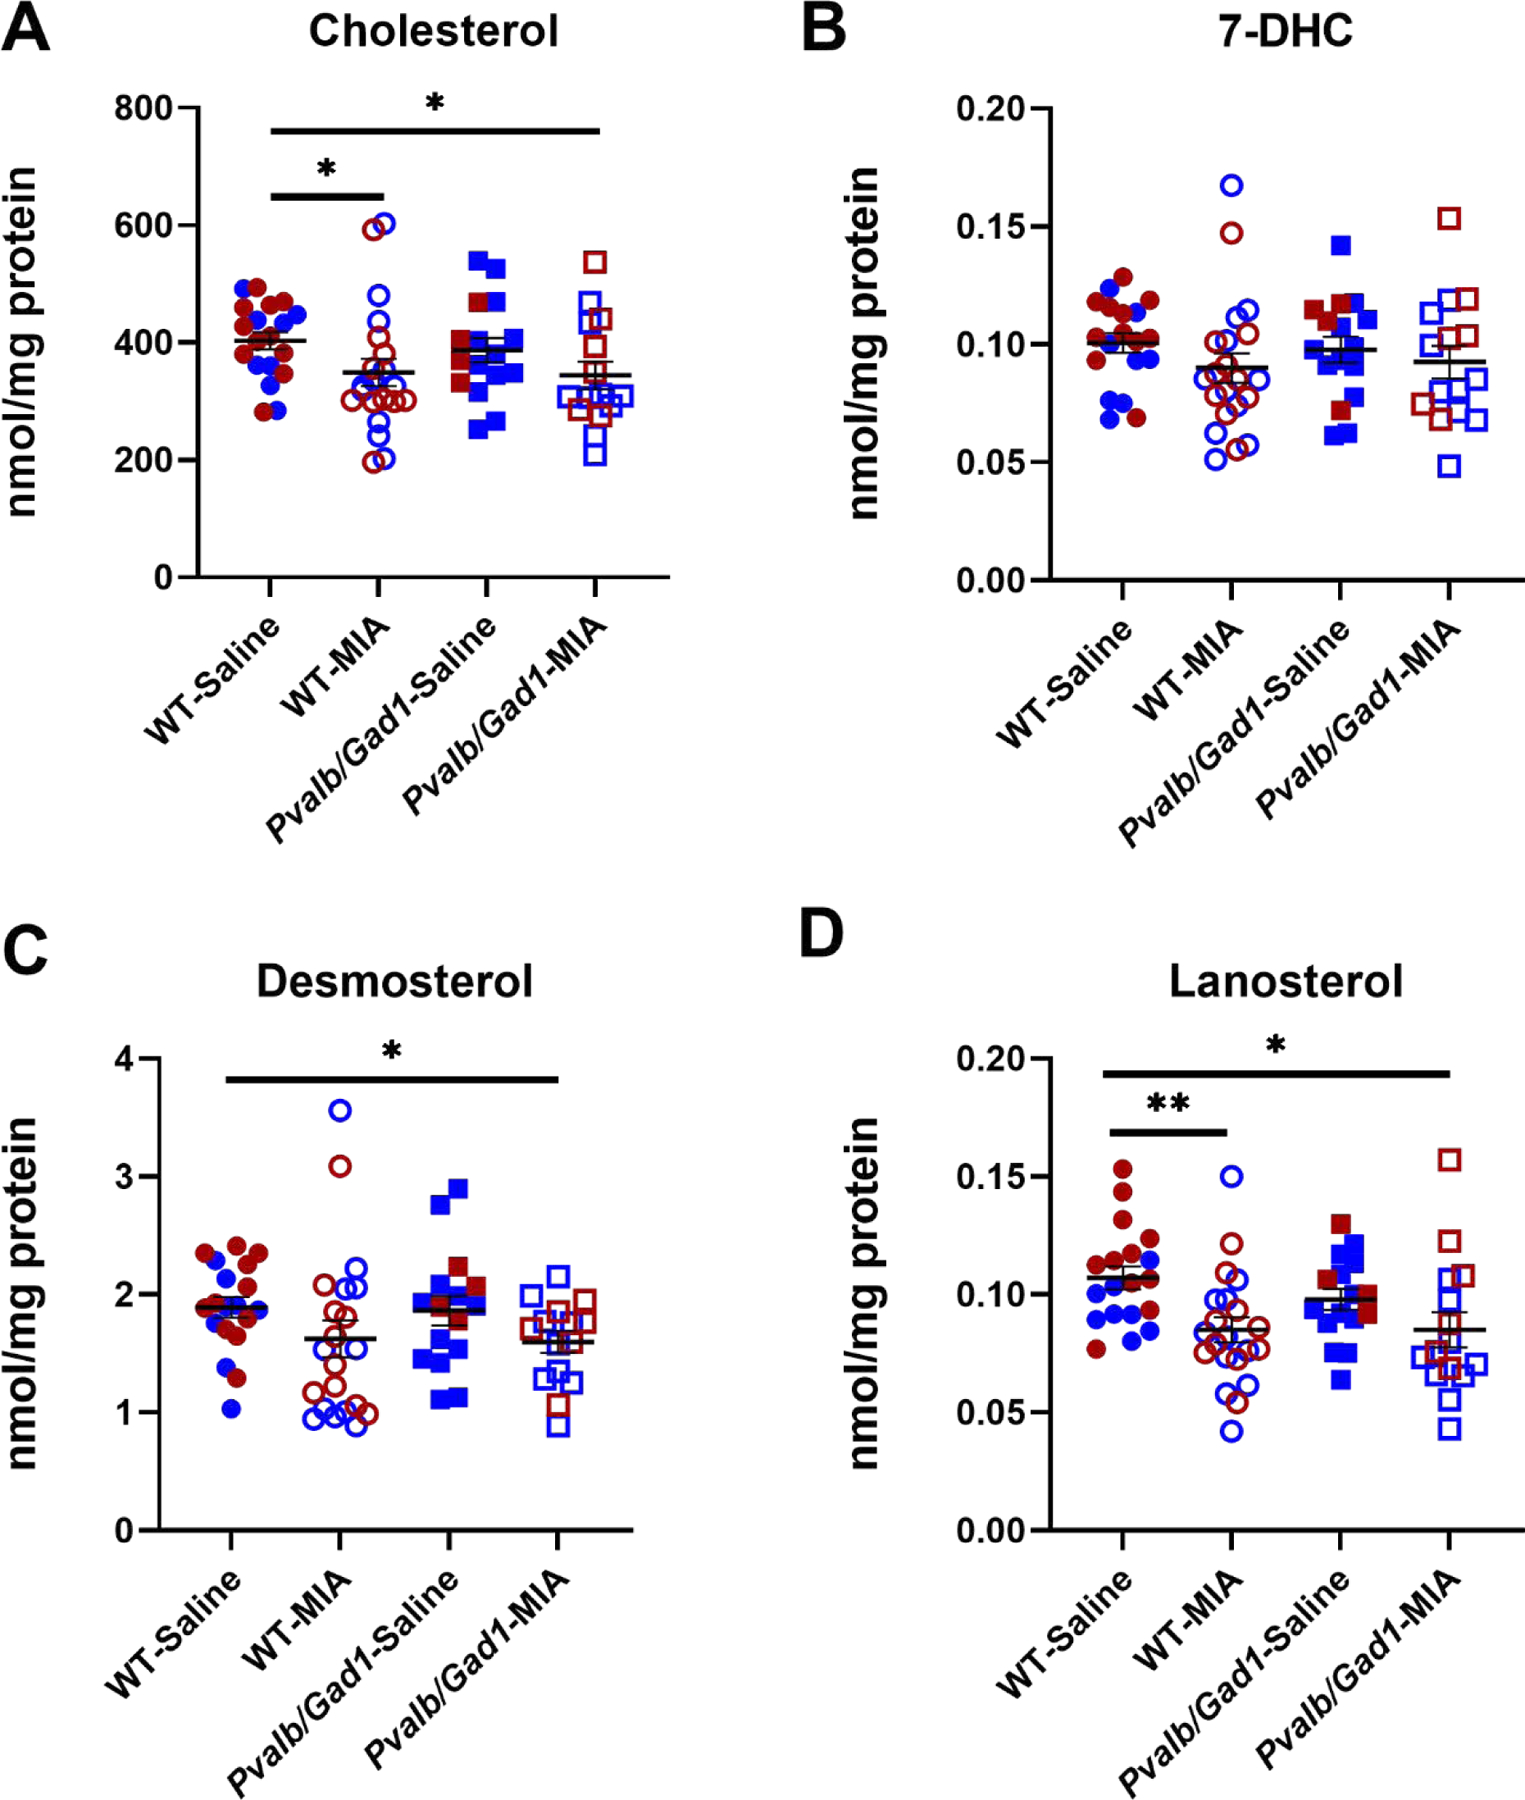
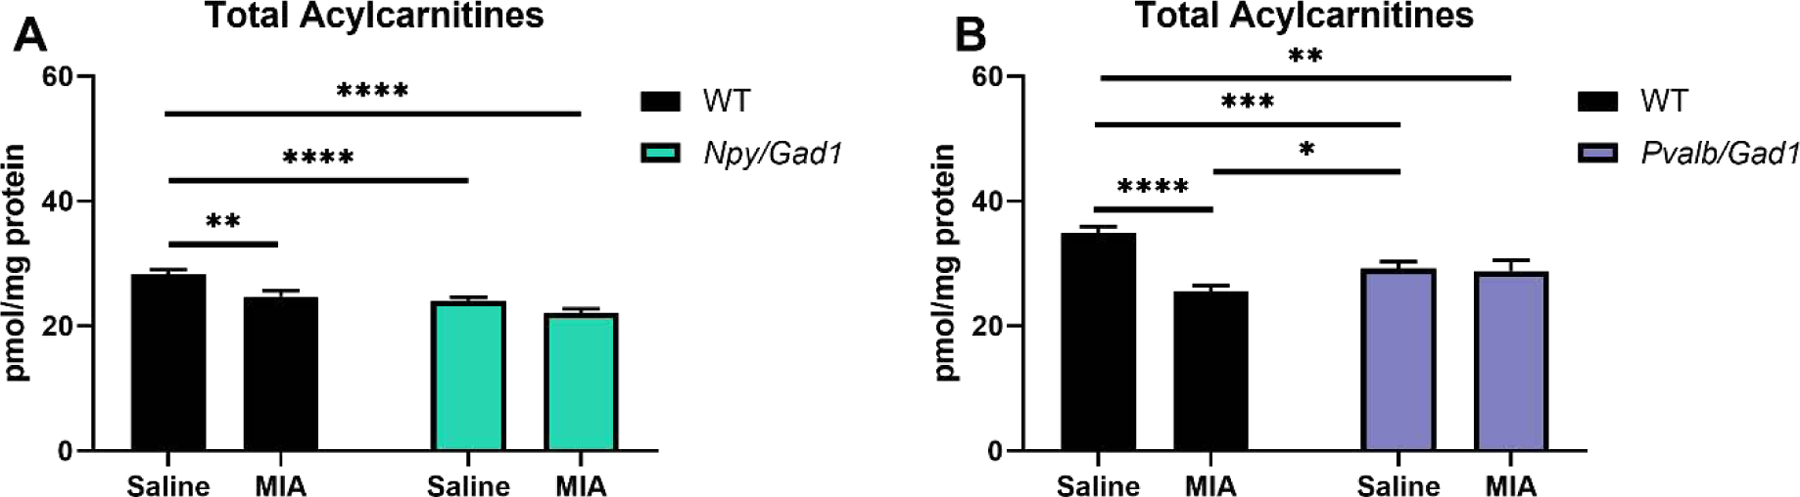
Genes and environment interact during intrauterine life, and potentially alter the developmental trajectory of the brain. This can result in life-long consequences on brain function. We have previously developed two transgenic mouse lines that suppress Gad1 expression in parvalbumin (PVALB) and neuropeptide Y (NPY) expressing interneuron populations using a bacterial artificial chromosome (BAC)-driven miRNA-based silencing technology. We were interested to assess if maternal immune activation (MIA), genetic interneuronal inhibition, and the combination of these two factors disrupt and result in long-term changes in neuroinflammatory gene expression, sterol biosynthesis, and acylcarnitine levels in the brain of maternally exposed offspring. Pregnant female WT mice were given a single intraperitoneal injection of saline or polyinosinic-polycytidilic acid [poly(I:C)] at E12.5. Brains of offspring were analyzed at postnatal day 90. We identified complex and persistent neuroinflammatory gene expression changes in the hippocampi of MIA-exposed offspring, as well in the hippocampi of Npy/Gad1 and Pvalb/Gad1 mice. In addition, both MIA and genetic inhibition altered the post-lanosterol sterol biosynthesis in the neocortex and disrupted the typical acylcarnitine profile. In conclusion, our findings suggest that both MIA and inhibition of interneuronal function have long-term consequences on critical homeostatic mechanisms of the brain, including immune function, sterol levels, and energy metabolism.

Keywords: Acylcarnitines; Interneuron; Maternal immune activation; Neuroinflammation; Schizophrenia; Sterol profile.


Conflict of interest statement

Conflict of Interest

The authors declare no conflict of interest that is in any form related to the presented material, experiments, or outcomes.

Figures

Figure 1.
Figure 1.. Summary of neuroimmune gene expression changes.
Arrows denote the performed comparisons, numbers denote the gene transcripts showing differential expression between the two groups. Note that both genetic inhibition and intrauterine poly(I:C) treatment lead to gene expression changes that persist into adulthood, and the largest number of gene expression changes are observed when the two insults are combined. SAL – saline-treated; NPY – neuropeptide Y; PVALB – parvalbumin; GAD1 – glutamic acid decarboxylase 1; poly(I:C) - polyinosinic:polycytidylic acid.
Figure 2.
Figure 2.. Hierarchical clustering of gene expression changes between saline-treated and maternal poly(I:C)-treated Npy/Gad1 transgenic animal hippocampi at P90.
Two-way unsupervised hierarchical clustering was performed with the Morpheus software using average linkage on log2 expression values. Rows represent genes, columns represent samples. Each square represents normalized log2 expression level for a gene from a single experimental animal brain. Colors correspond to expression level versus the mean expression (red-increased; blue decreased). Color intensity corresponds to the magnitude of change. Note that the maternal saline-treated and maternal poly(I:C)-treated Npy/Gad1 animals are perfectly separated in the top dendrogram.
Figure 3.
Figure 3.. Hierarchical clustering of gene expression changes between saline-treated and maternal poly(I:C)-treated Pvalb/Gad1 transgenic animal hippocampi at P90.
Two-way unsupervised hierarchical clustering was performed with the Morpheus software using average linkage on log2 expression values. Rows represent genes, columns represent samples. Each square represents normalized log2 expression level for a gene from a single experimental animal brain. Colors correspond to expression level versus the mean expression (red-increased; blue decreased). Color intensity corresponds to the magnitude of change. Note that the maternal saline-treated and maternal poly(I:C)-treated Pvalb/Gad1 animals are well separated in the top dendrogram, with one saline-treated sample as an outlier.
Figure 4.
Figure 4.. Sterol profile changes between saline-treated and maternal poly(I:C)-treated Npy/Gad1 transgenic and WT animal neocortices at P90.
A) CHOL, B) 7-DHC, C) DES, and D) LAN. X-axis denote experimental groups, Y-axis show sterol levels. Two-way ANOVA was performed using GraphPad Prism software. Rows represent variables (treatment, genotype), and the interaction of the two. Columns represent the main sterol species in the post-lanosterol biosynthesis pathway. Circles denote WT mice, squares denote Npy/Gad1 genotype. Filled symbols correspond to saline treatment, while red and blue colored symbols denote female and male animals, respectively. Groupwise comparisons are denoted by horizontal lines. Significance in groupwise comparisons: *p<0.05; **p<0.01; ***p<0.001.
Figure 5.
Figure 5.. Sterol profile changes between saline-treated and maternal poly(I:C)-treated Pvalb/Gad1 transgenic and WT animal neocotrices at P90.
A) CHOL, B) 7-DHC, C) DES, and D) LAN. X-axis denote experimental groups, Y-axis show sterol levels. Two-way ANOVA was performed using GraphPad Prism software. Rows represent variables (treatment, genotype), and the interaction of the two. Columns represent the main sterol species in the post-lanosterol biosynthesis pathway. Circles denote WT mice, squares denote Pvalb/Gad1 genotype. Filled symbols correspond to saline treatment, while red and blue colored symbols denote female and male animals, respectively. Groupwise comparisons are denoted by horizontal lines. Significance in groupwise comparisons: *p<0.05; **p<0.01; ***p<0.001.
Figure 6.
Figure 6.. Total acylcarnitine levels in the neocortex of saline-treated and maternal poly(I:C)-treated transgenic and WT animals at P90.
A) Npy/Gad1; B) Pvalb/Gad1. X-axis denotes experimental group, Y-axis shows sterol levels. In the two-way ANOVA analyses rows represent variables (treatment, genotype), and the interaction of the two. Groupwise comparisons are denoted by horizontal lines. Significance in groupwise comparisons: *p<0.05; **p<0.01; ***p<0.001; ****p<0.0001.

Similar articles

Cited by

References

    1. Alexopoulou L, et al., 2001. Recognition of double-stranded RNA and activation of NF-kappaB by Toll-like receptor 3. Nature 413, 732–8. - PubMed
    1. Barke TL, et al., 2019. Sex modifies placental gene expression in response to metabolic and inflammatory stress. Placenta 78, 1–9. - PMC - PubMed
    1. Bauman MD, Van de Water J, 2020. Translational opportunities in the prenatal immune environment: Promises and limitations of the maternal immune activation model. Neurobiol Dis 141, 104864. - PMC - PubMed
    1. Benes FM, Berretta S, 2001. GABAergic interneurons: implications for understanding schizophrenia and bipolar disorder. Neuropsychopharmacology 25, 1–27. - PubMed
    1. Brittain EL, et al., 2016. Fatty Acid Metabolic Defects and Right Ventricular Lipotoxicity in Human Pulmonary Arterial Hypertension. Circulation 133, 1936–44. - PMC - PubMed

Publication types

MeSH terms

LinkOut - more resources