. 2021 Jun 2;29(6):2067-2087.
doi: 10.1016/j.ymthe.2021.02.016. Epub 2021 Feb 15.

Imbalance of TGF-β1/BMP-7 pathways induced by M2-polarized macrophages promotes hepatocellular carcinoma aggressiveness

Affiliations

Imbalance of TGF-β1/BMP-7 pathways induced by M2-polarized macrophages promotes hepatocellular carcinoma aggressiveness

Junya Ning et al. Mol Ther. .

Abstract

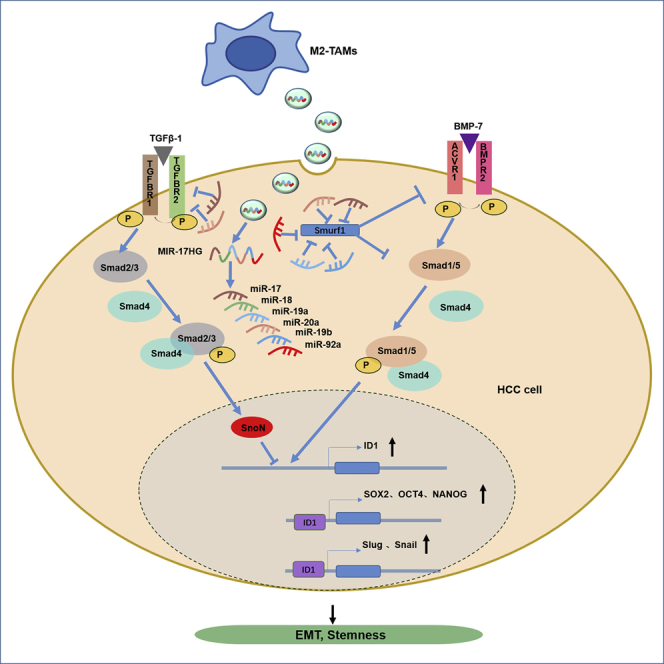
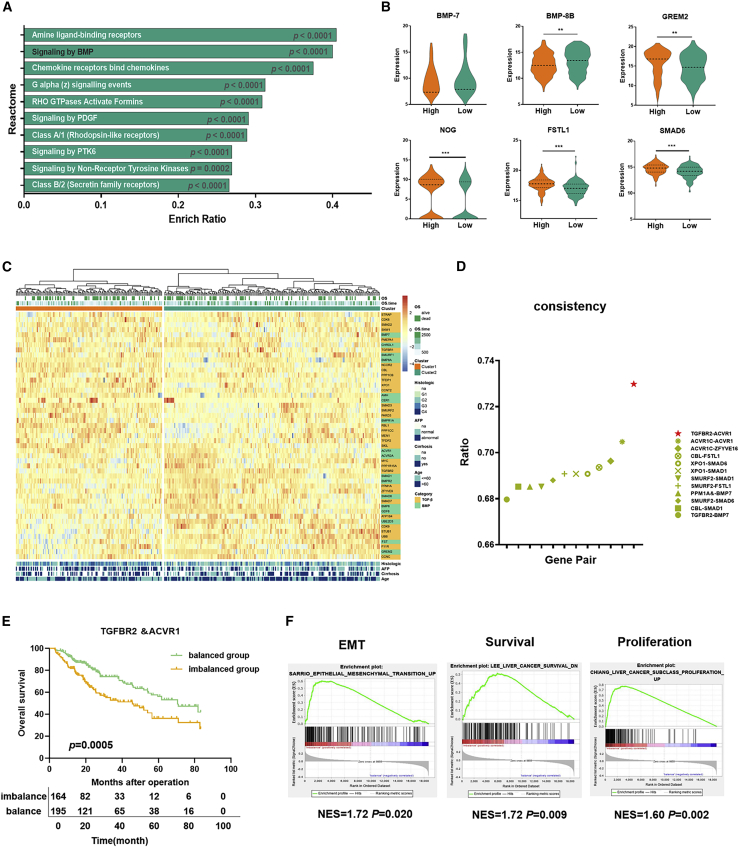
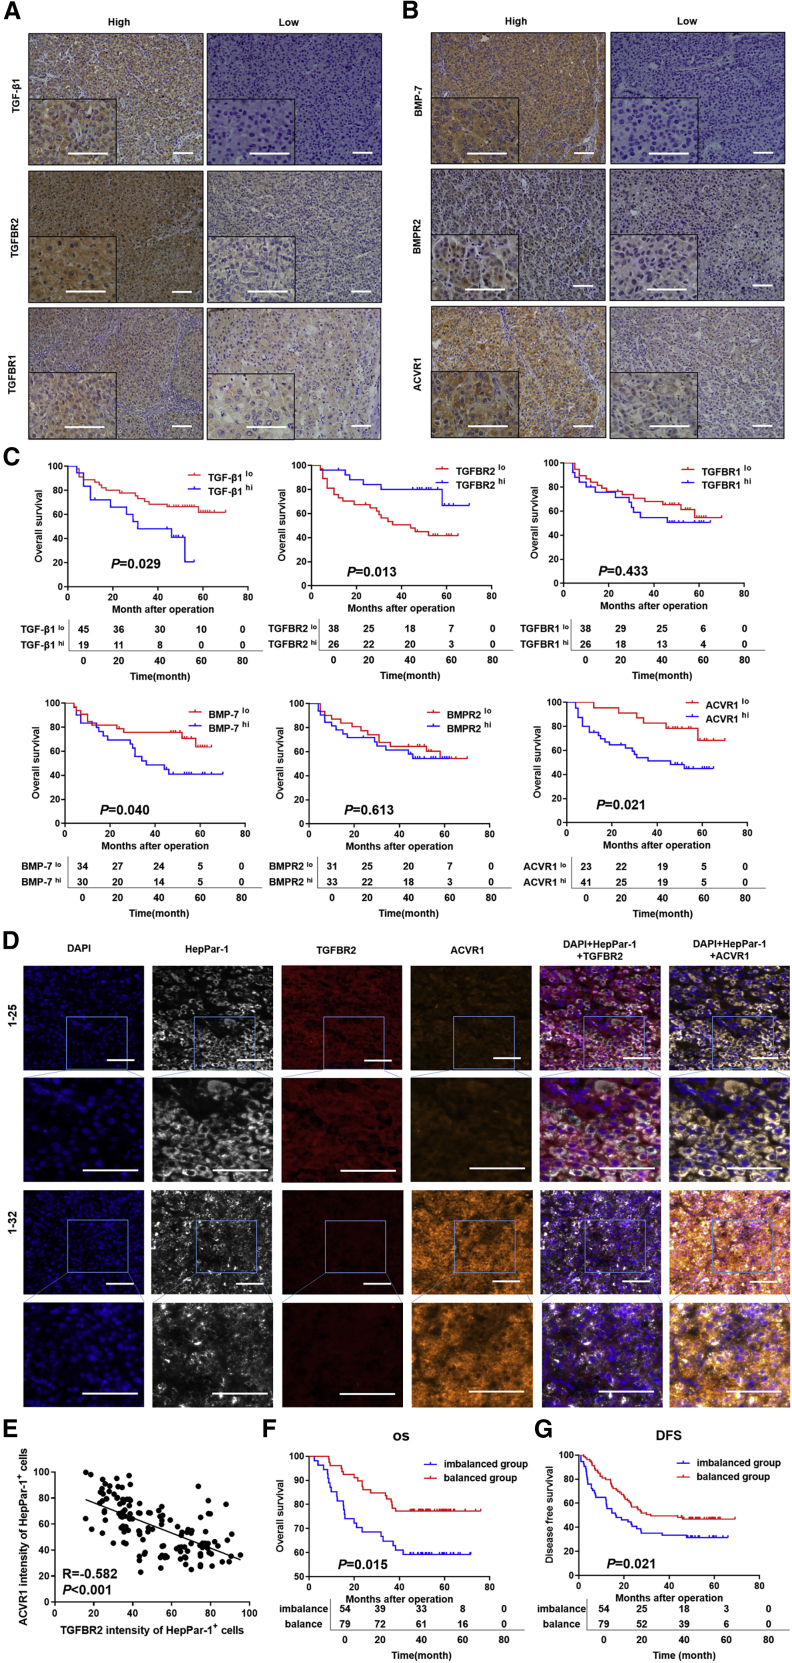
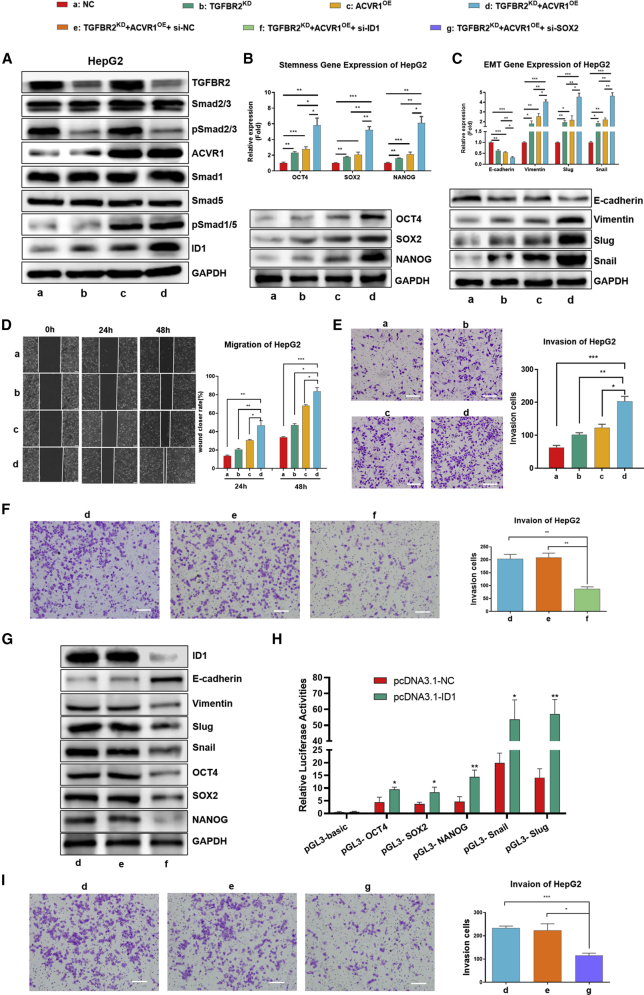
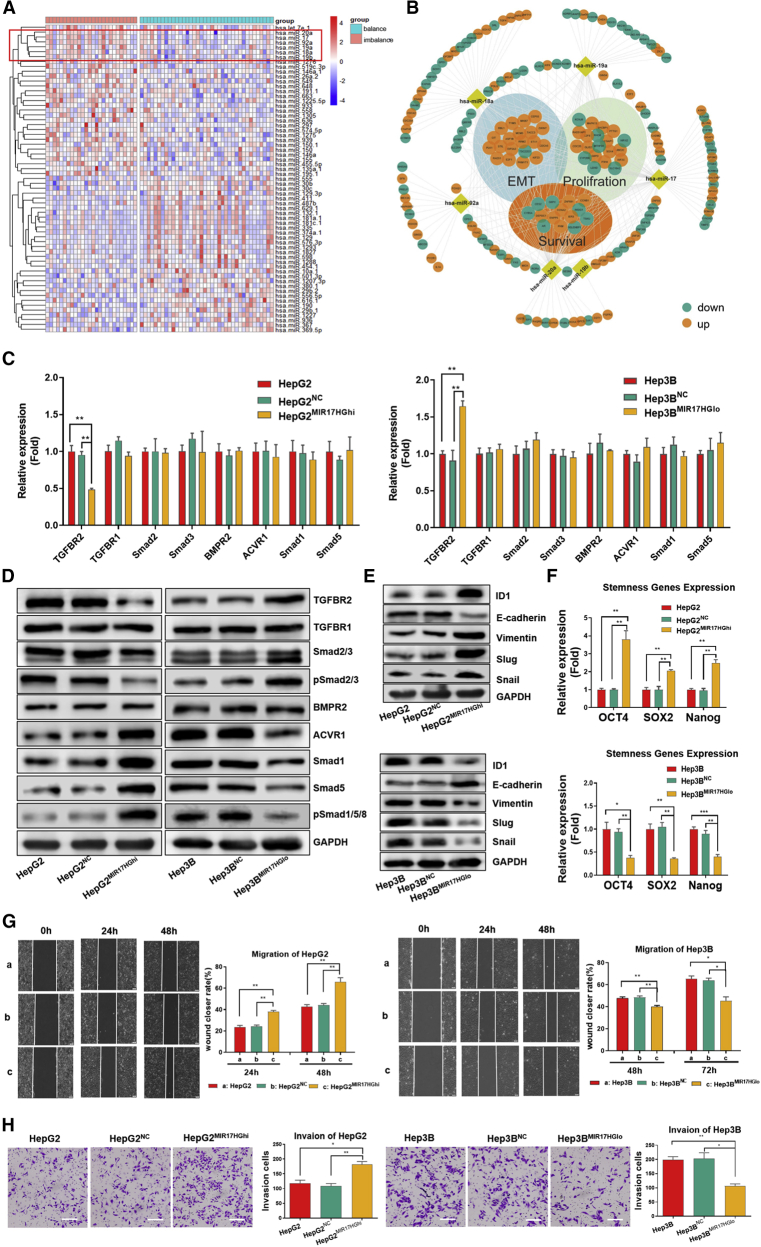
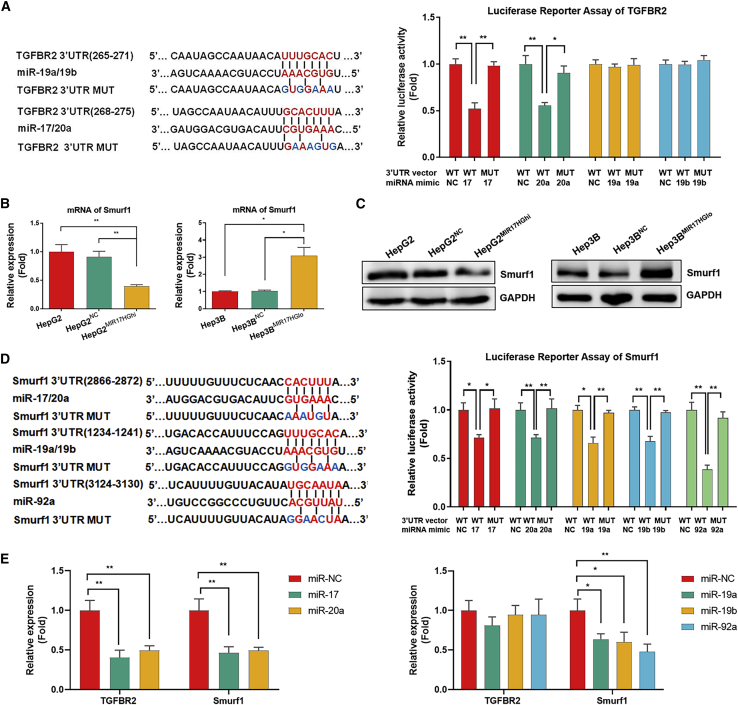
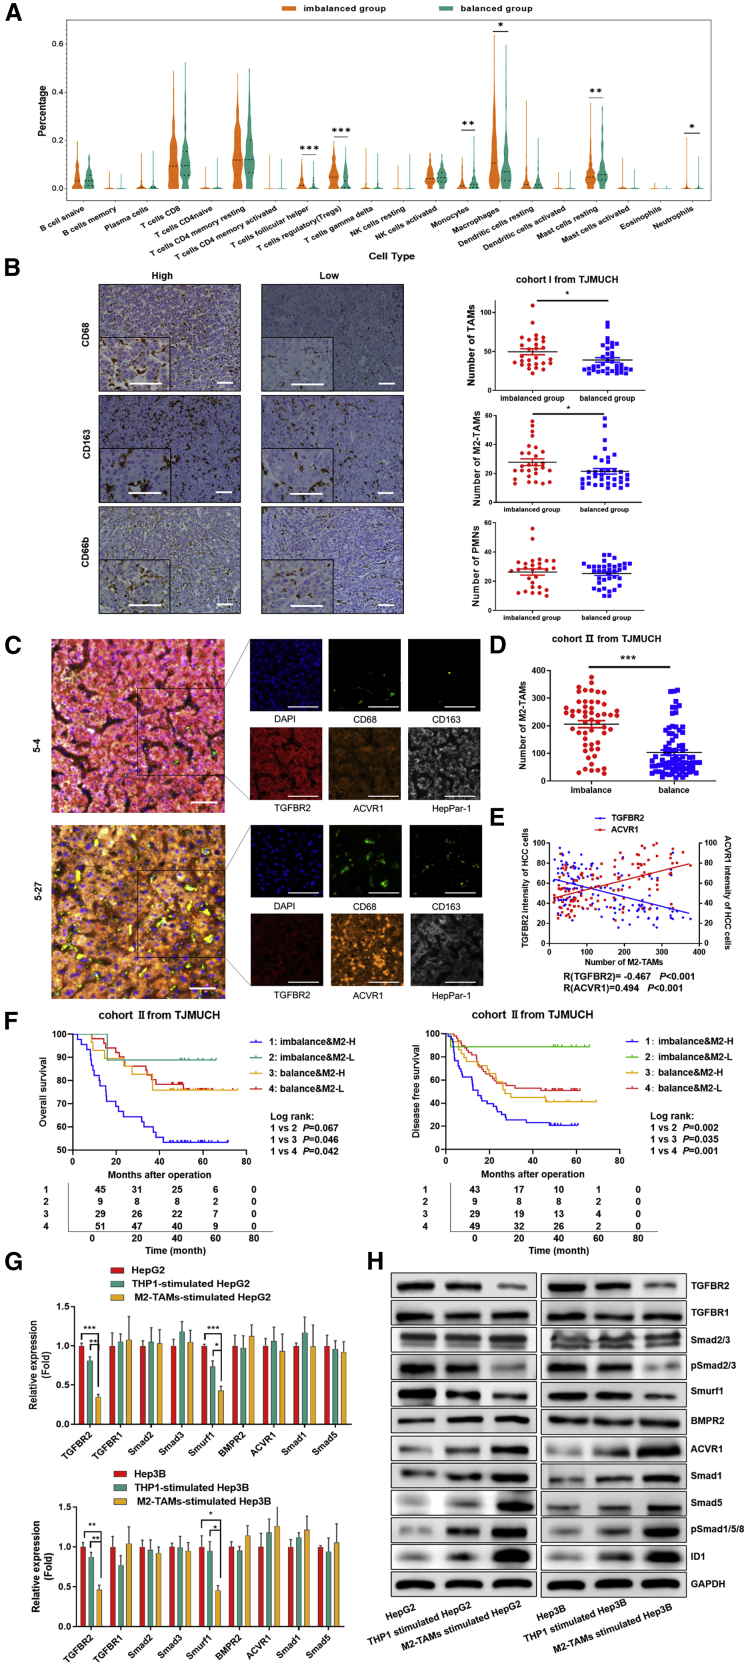
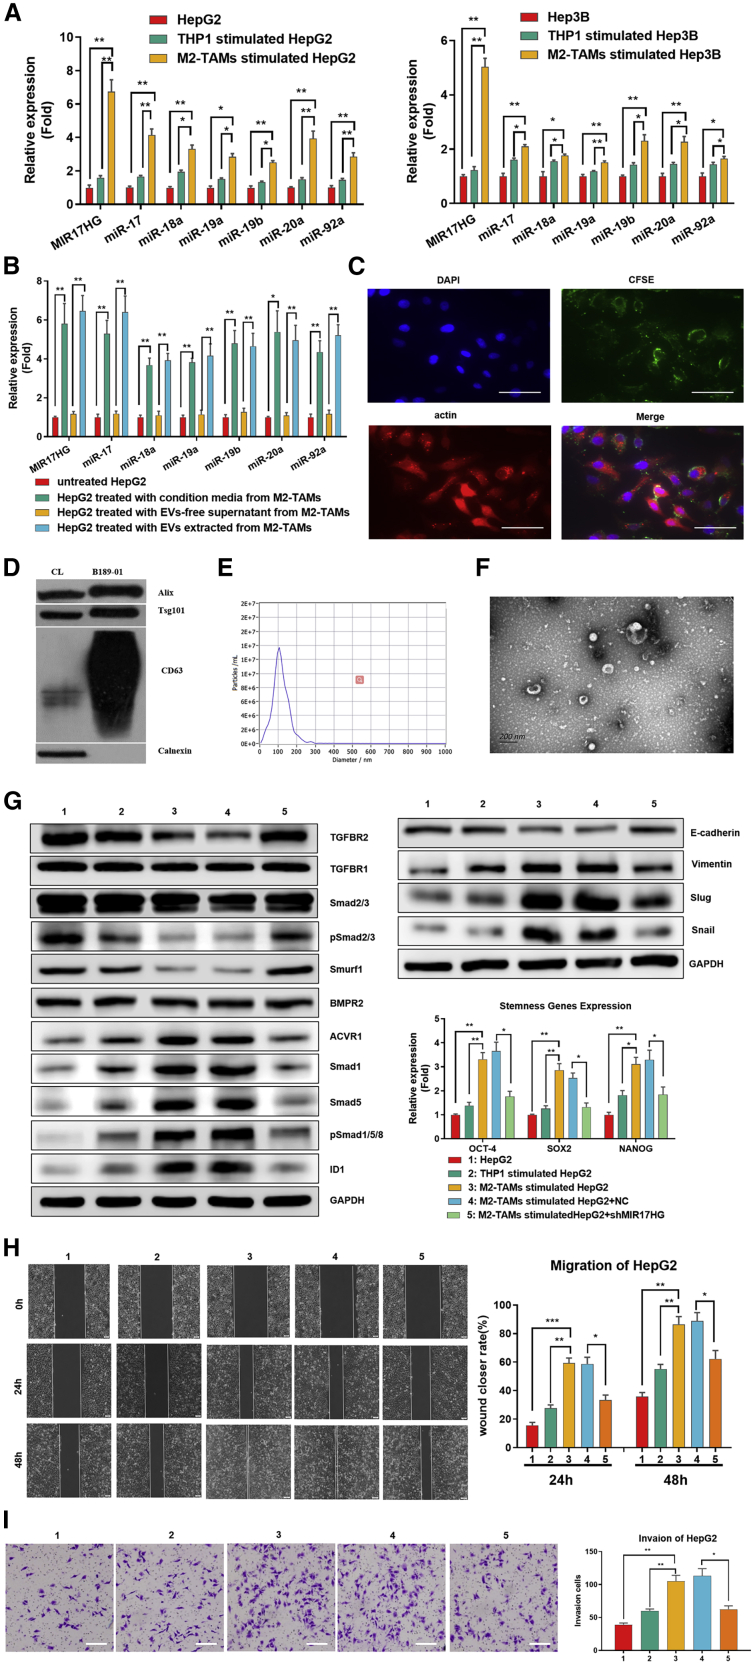
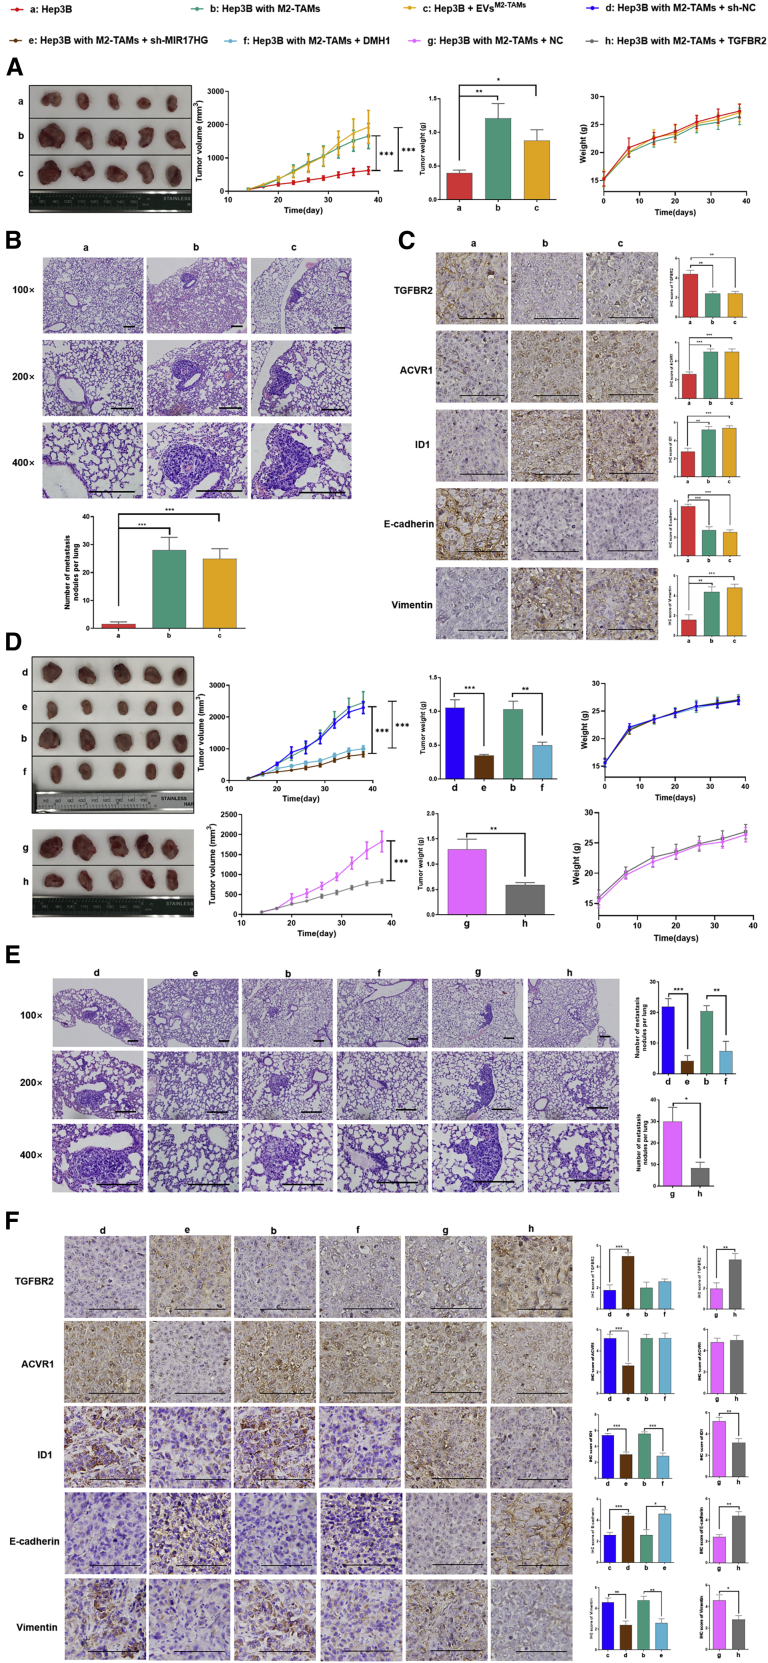
The transforming growth factor-beta (TGF-β) signaling pathway is the predominant cytokine signaling pathway in the development and progression of hepatocellular carcinoma (HCC). Bone morphogenetic protein (BMP), another member of the TGF-β superfamily, has been frequently found to participate in crosstalk with the TGF-β pathway. However, the complex interaction between the TGF-β and BMP pathways has not been fully elucidated in HCC. We found that the imbalance of TGF-β1/BMP-7 pathways was associated with aggressive pathological features and poor clinical outcomes in HCC. The induction of the imbalance of TGF-β1/BMP-7 pathways in HCC cells could significantly promote HCC cell invasion and stemness by increasing inhibitor of differentiation 1 (ID1) expression. We also found that the microRNA (miR)-17-92 cluster, originating from the extracellular vesicles (EVs) of M2-polarized tumor-associated macrophages (M2-TAMs), stimulated the imbalance of TGF-β1/BMP-7 pathways in HCC cells by inducing TGF-β type II receptor (TGFBR2) post-transcriptional silencing and inhibiting activin A receptor type 1 (ACVR1) post-translational ubiquitylation by targeting Smad ubiquitylation regulatory factor 1 (Smurf1). In vivo, short hairpin (sh)-MIR17HG and ACVR1 inhibitors profoundly attenuated HCC cell growth and metastasis by rectifying the imbalance of TGF-β1/BMP-7 pathways. Therefore, we proposed that the imbalance of TGF-β1/BMP-7 pathways is a feasible prognostic biomarker and recovering the imbalance of TGF-β1/BMP-7 pathways might be a potential therapeutic strategy for HCC.


Conflict of interest statement

Declaration of interests The authors declare no competing interests.

Figures

None
Graphical abstract
Figure 1
Figure 1
The imbalance of TGF-β1/BMP-7 pathways was detected at the mRNA level in HCC and was associated with poor clinical outcomes (A) The KOBAS tool was used for pathway enrichment analysis of the differential gene between TGFBR2hi and TGFBR2lo HCC tissues in TCGA. (B) Differential expression of BMP-8B, BMP-7, GREM2, NOG, FSTL1, and SMAD6 of the BMP pathway between TGFBR2hi and TGFBR2lo HCC tissues in TCGA. (C) Core genes of the TGF-β and BMP pathways were used for unsupervised clustering, and 359 patients from TCGA cohort were divided into two groups: cluster 1 and cluster 2. (D) The consistency of TGF-β and BMP signaling combination groups was compared with clusters 1 and 2. (E) The OS was compared between the imbalanced group and the balanced group for 359 HCC samples. (F) GSEA identified greater enrichment of gene sets related to EMT, liver cancer survival, and proliferation in the imbalanced group compared with the balanced group. For all panels, ∗p < 0.05, ∗∗p < 0.01, ∗∗∗p < 0.001.
Figure 2
Figure 2
The imbalance of TGF-β1/BMP-7 pathways was validated at the protein level in HCC and was associated with aggressive pathological features and poor clinical outcomes (A and B) Representative images of IHC staining for TGF-β1/BMP-7 pathway components in cohort I. Scale bars, 50 μm. (C) Kaplan-Meier survival analysis showing survival rates based on the expression of TGF-β1/BMP-7 pathway components in cohort I. (D) Representative HCC tumor samples showing the expression of 4′,6-diamidino-2-phenylindole (DAPI), hepatocyte paraffin antigen 1 (HepPar-1), TGFBR2, and ACVR1 by multispectral IF staining in cohort II. Scale bars, 50 μm. (E) Scatterplot depicting the correlation between TGFBR2 levels and ACVR1 levels in HepPar-1+ HCC cells in cohort II. (F and G) Kaplan-Meier survival analysis showing OS rates and DFS rates between the imbalanced group and balanced group in cohort II.
Figure 3
Figure 3
The imbalance of TGF-β1/BMP-7 pathways dramatically promoted HCC cell invasion by upregulating EMT and stemness via increasing inhibitor of differentiation (ID1) (A) Western blotting of the levels of TGF-β1/BMP-7 pathway components in HepG2 cells with separate or simultaneous TGFBR2 knockdown (TGFBR2KD) and ACVR1 overexpression (ACVR1OE). (B) PCR and western blotting of stem cell-related genes, including OCT4, SOX2, and NANOG, in HepG2 cells. (C) PCR and western blotting of EMT-related genes, including E-cadherin, vimentin, slug, and snail, in HepG2 cells. (D) Wound-healing assay in HepG2 cells at 24 and 48 h. Scale bars, 200 μm. (E) Transwell assay after 24 h in HepG2. Scale bars, 200 μm. (F and G) Transwell assay (scale bars, 100 μm) (F) and western blotting (G) of ID1, EMT, and stemness-related genes in TGFBR2KD and ACVR1OE HepG2 cells after transfection with si-ID1. (H) Luciferase activity assays were applied to assess the effect of ID1 on the promoter activity of OCT4, SOX2, NANOG, Snail, and Slug. (I) Transwell assays were performed in TGFBR2KD and ACVR1OE HepG2 cells after transfection with si-SOX2. Scale bars, 100 μm. For all panels, ∗p < 0.05, ∗∗p < 0.01, ∗∗∗p < 0.001.
Figure 4
Figure 4
The imbalance of TGF-β1/BMP-7 pathways was regulated by the miR-17-92 cluster, which promoted cell invasion and stemness in HCC (A) The miRNA expression was compared in the imbalanced group compared with the balanced group by analyzing the HCC RNA-seq data of cohort I. (B) Networks of miR-17-92 cluster and differentially expressed genes between the imbalanced and balanced groups of 359 HCC patients from TCGA. (C) PCR array of TGF-β1 and BMP-7 pathways in HepG2MIR17HGhi cells compared with HepG2NC and HepG2 cells and in Hep3BMIR17HGlo cells compared with Hep3BNC and Hep3B cells. (D and E) Western blotting for components of the TGFβ1 and BMP-7 pathways and for ID1 and EMT genes. (F) PCR array for stem cell-associated genes in HepG2MIR17HGhi cells compared with HepG2NC and HepG2 cells and in Hep3BMIR17HGlo cells compared with Hep3BNC and Hep3B cells. (G) Wound closure was detected in HepG2MIR17HGhi, HepG2NC, and HepG2 cells at 24 and 48 h (left); wound closure was detected in Hep3BMIR17HGlo, Hep3BNC, and Hep3B cells at 48 and 72 h (right). Scale bars, 200 μm. (H) Cell invasion of HepG2MIR17HGhi and Hep3BMIR17HGlo cells compared with that of their controls. The graphs depict the number of invasive cells after 24 h. Scale bars, 100 μm. For all panels, ∗p < 0.05, ∗∗p < 0.01, ∗∗∗p < 0.001.
Figure 5
Figure 5
miR-17-92 cluster promoted the imbalance of TGF-β1/BMP-7 pathways by interfering with TGFBR2 mRNA levels and enhancing ACVR1 protein levels via Smurf1 silencing (A) Luciferase reporter assays involving different 3′ UTRs were used to identify the targeted relationship of the miR-17-92 cluster with TGFBR2. (B and C) PCR array and western blotting for the mRNA and protein expression of Smurf1 in HepG2MIR17HGhi and Hep3BMIR17HGlo cells compared with their controls. (D) Luciferase reporter assays involving different 3′ UTRs were used to identify the targeting relationship of the miR-17-92 cluster with Smurf1. (E) A PCR array was used to detect the mRNA expression of TGFBR2 and Smurf1 in HepG2 cells transfected with the miR-17-92 cluster. ∗p < 0.05, ∗∗p < 0.01, ∗∗∗p < 0.001.
Figure 6
Figure 6
M2-TAMs manipulate the imbalance of TGF-β1/BMP-7 pathways in HCC (A) The differences in the proportion of infiltrating immune cells between the imbalanced group and balanced group were analyzed by using CIBERSORT in TCGA cohort. (B) Immunohistochemical (IHC) analysis showed infiltration of CD68+, CD163+, and CD66b+ cells in tumor sections from cohort I. Scale bars, 50 μm. Student’s t test was used to analyze the differences in CD68+, CD163+, and CD66b+ cell infiltration between the imbalanced group and the balanced group. (C) Representative HCC tumor samples of cohort II showing the expression of DAPI, CD68, CD163, HepPar-1, TGFBR2, and ACVR1 via multispectral IF staining. Scale bars, 50 μm. (D) Student’s t test was used to analyze the difference in CD68+CD163+ M2-TAM infiltration between the imbalanced group and balanced group in cohort II. (E) Scatterplot depicting the statistical correlations between CD68+CD163+ M2-TAM infiltration and the expression of TGFBR2 in HepPar-1+ HCC cells and the expression of ACVR1 in HepPar-1+ HCC cells in cohort II. (F) OS curve and DFS curve for M2-TAM infiltration combined with imbalance of TGF-β1/BMP-7 pathways. (G and H) PCR array and western blotting to assess the mRNA and protein expression of TGF-β and BMP-7 pathway components in HepG2 and Hep3B cells cocultured with M2-TAMs compared to cocultured THP-1 cells or THP-1 cells alone. *p < 0.05, **p < 0.01, ***p < 0.001.
Figure 7
Figure 7
M2-TAMs increased the levels of the MIR17HG and miR-17-92 cluster in HCC cells via EVs to exacerbate the imbalance of the TGF-β1/BMP-7 pathways (A) PCR array for the expression of the MIR17HG and miR-17-92 cluster in HepG2 and Hep3B cells cocultured with M2-TAMs compared to THP-1 cells cocultured or cultured alone. (B) The expression of the MIR17HG and miR-17-92 cluster in HepG2 cells was detected by PCR after treatment with EVs from M2-TAMs or EV-free supernatant from M2-TAMs or conditioned media from M2-TAMs. (C) HepG2 cells were treated with CSFE-labeled EVs secreted by M2-TAMs, and HepG2 cells were visualized by staining with DAPI and actin. Scale bars, 50 μm. (D) Western blotting of specific membrane proteins from control cells and EV lysates from M2-TAMs. (E) NTA of EVs from M2-TAMs. (F) TEM for EVs from M2-TAMs. Scale bars, 200 μm. (G−I) HepG2 cells cocultured with M2-TAMs were treated with sh-MIR17HG, and western blotting of TGF-β1 and BMP-7 pathway components and EMT genes was performed. PCR assays of stemness genes and migration (scale bars, 200 μm) and invasion (scale bars, 100 μm) abilities were performed. *p < 0.05, **p < 0.01, ***p < 0.001.
Figure 8
Figure 8
Reversing the imbalance of TGF-β1/BMP-7 pathways effectively attenuated M2-TAM-abundant HCC xenograft growth and metastasis in vivo (A) The tumor volume, tumor growth curve, tumor weight, and weight curve of the mice are shown. (B) Pulmonary metastatic nodules were detected by hematoxylin and eosin (H&E) staining (scale bars, 100 μm). (C) IHC staining (scale bars, 50 μm) of TGFBR2, ACVR1, ID1, E-cadherin, and vimentin was analyzed under the following conditions: engraftment of Hep3B cells, engraftment of Hep3B cells cocultured with M2-TAMs, and engraftment of Hep3B cells treated with EVs from M2-TAMs. (D) The tumor volume, tumor growth curve, tumor weight, and weight curve of the mice are shown. (E) Pulmonary metastatic nodules were detected by H&E (scale bars, 100 μm). (F) IHC (scale bars, 50 μm) staining of TGFBR2, ACVR1, ID1, E-cadherin, and vimentin was analyzed under the following conditions: engraftment of Hep3B cells cocultured with M2-TAMs + injection of sh-NC lentivirus, engraftment of Hep3B cells cocultured with M2-TAMs + injection of sh-MIR17HG lentivirus, engraftment of Hep3B cells cocultured with M2-TAMs, engraftment of Hep3B cells cocultured with M2-TAMs + injection of DMH1, engraftment of Hep3B cells cocultured with M2-TAMs + injection of NC lentivirus, and engraftment of Hep3B cells cocultured with M2-TAMs + injection of TGFBR2 lentivirus. ∗p < 0.05, ∗∗p < 0.01, ∗∗∗p < 0.001.

References

    1. Bray F., Ferlay J., Soerjomataram I., Siegel R.L., Torre L.A., Jemal A. Global cancer statistics 2018: GLOBOCAN estimates of incidence and mortality worldwide for 36 cancers in 185 countries. CA Cancer J. Clin. 2018;68:394–424. - PubMed
    1. Orcutt S.T., Anaya D.A. Liver Resection and Surgical Strategies for Management of Primary Liver Cancer. Cancer Control. 2018;25 1073274817744621. - PMC - PubMed
    1. Izzo F., Granata V., Grassi R., Fusco R., Palaia R., Delrio P., Carrafiello G., Azoulay D., Petrillo A., Curley S.A. Radiofrequency Ablation and Microwave Ablation in Liver Tumors: An Update. Oncologist. 2019;24:e990–e1005. - PMC - PubMed
    1. Ling C.Q., Fan J., Lin H.S., Shen F., Xu Z.Y., Lin L.Z., Qin S.K., Zhou W.P., Zhai X.F., Li B., Zhou Q.H., Chinese Integrative Therapy of Primary Liver Cancer Working Group Clinical practice guidelines for the treatment of primary liver cancer with integrative traditional Chinese and Western medicine. J. Integr. Med. 2018;16:236–248. - PubMed
    1. Zhao H.T., Meng Y.B., Zhai X.F., Cheng B.B., Yu S.S., Yao M., Yin H.X., Wan X.Y., Yang Y.K., Liu H. Comparable effects of Jiedu Granule, a compound Chinese herbal medicine, and sorafenib for advanced hepatocellular carcinoma: A prospective multicenter cohort study. J. Integr. Med. 2020;18:319–325. - PubMed

Publication types

MeSH terms

Substances