. 2021;12(1):159-180.
doi: 10.1016/j.jcmgh.2021.02.002. Epub 2021 Feb 15.

Targeting Cholesterol Metabolism as Efficient Antiviral Strategy Against the Hepatitis E Virus

Affiliations

Targeting Cholesterol Metabolism as Efficient Antiviral Strategy Against the Hepatitis E Virus

Mirco Glitscher et al. Cell Mol Gastroenterol Hepatol. 2021.

Abstract

Background and aims: The Hepatitis E virus hijacks the endosomal system for its release. These structures are highly dependent on cholesterol. Hence, this study investigates the impact of HEV on cholesterol-metabolism, the effect of intracellular cholesterol content on HEV-release and the potential of cholesterol-modulators to serve as antivirals.

Methods: Intracellular cholesterol-content of cells was modulated and impacts on HEV were monitored using qPCR, Western blot, microscopy, virus-titration and density-gradient centrifugation. Blood-lipids and HEV-RNA were routinely quantified in chronically infected patients during follow-up visits.

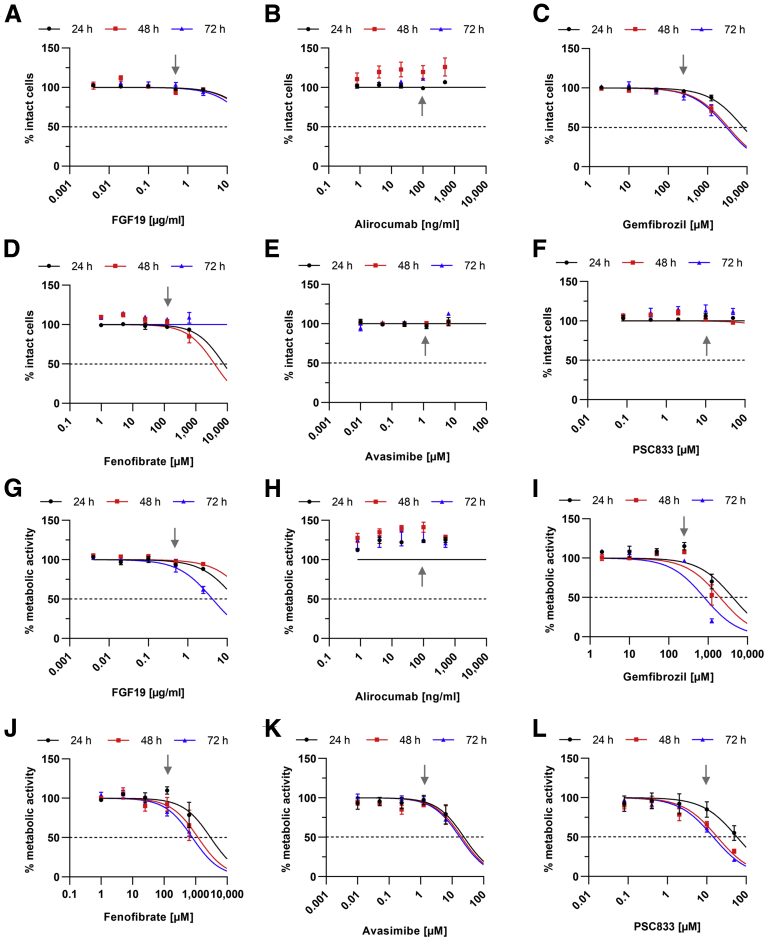
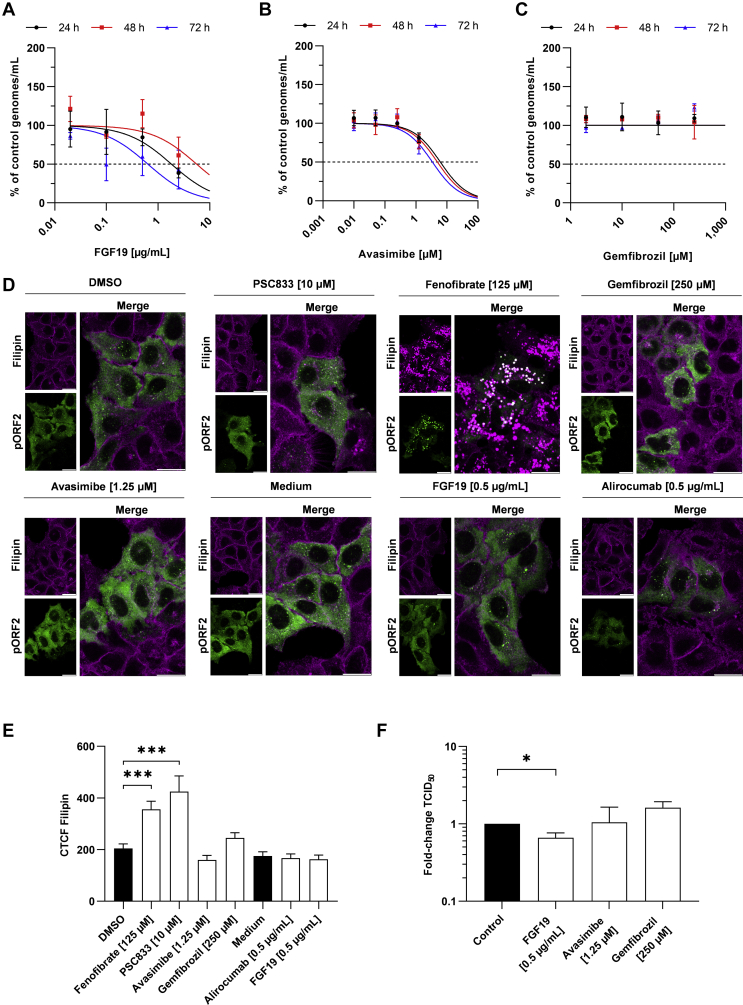
Results: In HEV-infected cells, decreased levels of cholesterol are found. In patients, HEV infection decreases serum-lipid concentrations. Importantly, statin treatment herein increases viral titers. Similarly, reduction of intracellular cholesterol via simvastatin treatment increases viral release in vitro. On the contrary, elevating intracellular cholesterol via LDL or 25-hydroxycholesterol strongly reduces viral release due to enhanced lysosomal degradation of HEV. Drug-induced elevation of intracellular cholesterol via fenofibrate or PSC833 impairs HEV release via the same mechanism.

Conclusions: This study analyses the crosstalk between HEV and intracellular cholesterol. The results highlight the importance of an intact cholesterol homeostasis for HEV-release and thereby identify a potential target for antiviral strategies. Especially fenofibrate is considered a promising novel antiviral against HEV. Beyond this, the study may help clinicians evaluating co-treatments of HEV-infected patients with statins, as this may be counter indicated.

Keywords: Antiviral; Cholesterol; HEV; Lipids; Lysosomes.


Figures

None
Graphical abstract
Figure 1
Figure 1
HEV dysregulates cholesterol in vitro and in vivo. (A) Representative filipin stain of cholesterol (purple) and pORF2 (green) in uninfected and infected cells; scale bar = 20 μm. (B) Quantification of A; filipin intensity depicted as corrected total cell fluorescence (CTCF) per cell; unpaired t test with Holm-Sidak correction. (C) Gene expression profiling of persistently HEV-infected A549 cells vs uninfected A549/D3 cells. (D) qPCR validation of C, fold-change messenger RNA (mRNA) infected vs uninfected; unpaired t test with Holm-Sidak correction. (E–H) Comparison blood lipids in patients at t–1, t0, and t+1; t–1 vs t0 (triglycerides [TG] = 29 pairs / total cholesterol [TC] = 29 pairs / LDL = 29 pairs / HDL = 28 pairs); t0 vs t+1 (TG= 20 pairs / TC = 20 pairs / LDL = 21 pairs / HDL = 21 pairs); paired, nonparametric t test. ∗P < .05, ∗∗P < .01, ∗∗∗P < .001.
Figure 2
Figure 2
Intracellular cholesterol is increased via LDL or 25-HC treatment and decreased via simvastatin treatment. (A) Representative immunofluorescent filipin stain of cholesterol (purple) and pORF2 (green) upon treatment in persistently HEV-infected A549 cells; scale bar = 20 μm. (B) Quantification of A; filipin intensity depicted as CTCF per cell. (C) qPCR evaluation of transcriptional effects of treatment with 25-HC in Huh-7 or A549/D3 cells, values referred to respective untreated control. (D) Cytotoxicity in persistently HEV-infected cells treated with different compounds as determined via lactate dehydrogenase assay; untreated cells were set to 100%, changes in amount of intact cells are depicted as % of untreated control. (E) Cytostaticity in persistently HEV-infected cells treated with different compounds as determined via PrestoBlue assay; untreated cells were set to 100%, changes in metabolic activity are depicted as % of untreated control. Unpaired t test with Holm-Sidak correction for all panels. ∗P < .05, ∗∗P < .01, ∗∗∗P < .001, ∗∗∗∗P < .0001. DMSO, dimethyl sulfoxide.
Figure 3
Figure 3
HEV release is inhibited by LDL and 25-HC but induced by simvastatin. (A) Representative Western blot of pORF2 and GAPDH; neg = uninfected A549/D3 cells; black arrows indicate pORF2 bands. (B–D) Quantification of pORF2-signals in A; fold-change compared with untreated group; unpaired t test with Holm-Sidak correction. (E) Fold-change of intracellular HEV transcripts as determined by RT-qPCR; unpaired t test with Holm-Sidak correction. (F) Fold-change of extracellular HEV RNA as determined by RT-qPCR; unpaired t test with Holm-Sidak correction. (G) Fold-change of released infectious viral particles as determined by end-point dilution assay; unpaired t test with Holm-Sidak correction. (H) HEV RNA in fractions of density-gradients as determined by RT-qPCR; depicted as % of whole genomes in gradient. (I) HEV titer in chronically infected patients with or without statin treatment; n = 42 patients, 129 measured values (without = 74 values; with = 55 values); Mann-Whitney-test. ∗P < .05, ∗∗P < .01, ∗∗∗P < .001, ∗∗∗∗P < .0001.
Figure 4
Figure 4
Statin treatment does not reduce blood-lipids in chronically HEV-infected patients. (A–D) Serum-lipid concentration in chronically infected patients grouped as treated or untreated with statins; n = 42 patients; TG (without = 53 values; with = 45 values), TC (without = 52 values; with = 44 values), LDL (without = 56 values; with = 45 values), HDL (without = 52 values; with = 44 values). Mann-Whitney test.
Figure 5
Figure 5
High cholesterol induces lysosomal localization of HEV. (A) Representative immunofluorescent stain of DAPI (blue), pORF2 (green), and LAMP2 (red) upon treatment in persistently HEV-infected A549 cells; scale bar = 20 μm; zoom = magnified section indicated with white square in merge. (B) Quantification of A; pORF2 intensity depicted as CTCF per cell. (C) Quantification of A; thresholded Mander’s overlap coefficient (tMOC) = red signal being present in green areas per cell. Unpaired t test with Holm-Sidak correction for all panels; ∗P < .05, ∗∗P < .01, ∗∗∗P < .001, ∗∗∗∗P < .0001.
Figure 6
Figure 6
Inhibition of lysosomal degradation rescues cholesterol-induced pORF2 reduction. (A) Representative immunofluorescent stain of DAPI (blue), pORF2 (green), and LAMP2 (red) upon treatment in persistently HEV-infected A549 cells; scale bar = 20 μm; zoom = magnified section indicated with white square in merge. (B) Quantification of A; pORF2 intensity depicted as CTCF per cell. (C) Quantification of A; tMOC = red signal being present in green areas per cell. (D) Representative Western blot of pORF2 and GAPDH of leupeptin-treated cells; neg = uninfected A549/D3 cells; black arrows indicate pORF2 bands. (E) Quantification of pORF2-signals in D; fold-change compared with untreated group. Unpaired t test with Holm-Sidak correction for all panels; ∗∗P < .01, ∗∗∗P < .001.
Figure 7
Figure 7
Cholesterol-modulating drugs are not cytotoxic at concentrations showing inhibition of HEV. (A–F) Dose-response curve of persistently HEV-infected cells treated with different compounds as determined via lactate dehydrogenase assay; untreated cells were set to 100%, changes in amount of intact cells are depicted as % of untreated control. Gray arrows indicate highest concentrations used for subsequent experiments. (G–L) Dose-response curve of persistently HEV-infected cells treated with different compounds as determined via PrestoBlue assay; untreated cells were set to 100%, changes in metabolic activity are depicted as % of untreated control. Gray arrows indicate highest concentrations used for subsequent experiments.
Figure 8
Figure 8
Antiviral effect of drugs is accompanied by increased intracellular cholesterol. (A–C) Dose-response curve of viral RNA being released by treated persistently HEV-infected cells as determined via RT-qPCR; untreated cells were set to 100%, changes in RNA amount are depicted as % of untreated control; basis for calculation of EC50. (D) Representative immunofluorescent filipin stain of cholesterol (purple) and pORF2 (green) in untreated or treated persistently HEV-infected A549 cells; scale bar = 20 μm. (E) Quantification of F; Cholesterol intensity depicted as CTCF per cell. (F) Fold change of released infectious viral particles as determined by end-point dilution assay. Unpaired t test with Holm-Sidak correction for all panels; ∗P < .05, ∗∗∗P < .001.
Figure 9
Figure 9
Drugs modulating cholesterol are effective against HEV release. (A-C) Dose-response curve of viral RNA being released by treated, persistently HEV-infected cells as determined via RT-qPCR; untreated cells set to 100%, changes in RNA amount depicted as % of control. (D) Representative Western blot of pORF2 and GAPDH; neg = uninfected A549/D3 cells; black arrows indicate pORF2 bands. (E) Quantification of pORF2-signals in D; fold change compared with untreated group. (F) Fold change of released infectious viral particles as determined by end-point dilution assay. (G) HEV RNA in fractions of density gradients as determined by RT-qPCR; % of whole genomes in gradient. Unpaired t test with Holm-Sidak correction for all panels; ∗∗P < .01, ∗∗∗∗P < .0001.
Figure 10
Figure 10
Fenofibrate and PSC833 induce similar changes in cholesterol in A549/D3 and Huh-7 cells. (A) Representative immunofluorescent filipin stain of cholesterol (purple) in A549/D3 and Huh-7 cells; scale bar = 20 μm. (B) Quantification of A; Cholesterol intensity depicted as CTCF per cell. Unpaired t test with Holm-Sidak correction for all panels; ∗P < .05, ∗∗∗P < .001, ∗∗∗∗P < .0001.
Figure 11
Figure 11
Antiviral effect of fenofibrate, PSC833, and alirocumab due to lysosomal localization of HEV. (A) Representative immunofluorescent stain of DAPI (blue), pORF2 (green), and LAMP2 (red) upon treatment in persistently HEV-infected A549 cells; scale bar = 20 μm; zoom = magnified section indicated with white square in merge. (B) Quantification of A; pORF2 intensity depicted as CTCF per cell. (C) Quantification of A; tMOC = red signal being present in green areas per cell. Unpaired t test with Holm-Sidak correction for all panels; ∗∗P < .01, ∗∗∗P < .001, ∗∗∗∗P < .0001.
Figure 12
Figure 12
Inhibition of lysosomal degradation rescues drug-induced, cholesterol-dependent pORF2 reduction. (A) Representative immunofluorescent stain of DAPI (blue), pORF2 (green), and LAMP2 (red) upon treatment in persistently HEV-infected A549 cells; scale bar = 20 μm; zoom = magnified section indicated with white square in merge. (B) Quantification of A; pORF2 intensity depicted as CTCF per cell. (C) Quantification of A; tMOC = red signal being present in green areas per cell. Unpaired t test with Holm-Sidak correction for all panels; ∗P < .05, ∗∗P < .01.
Figure 13
Figure 13
FGF19, avasimibe, or gemfibrozil treatment is not accompanied by lysosomal localization of HEV. (A) Representative immunofluorescent stain of DAPI (blue), pORF2 (green), and LAMP2 (red) upon treatment in persistently HEV-infected A549 cells; scale bar = 20 μm; zoom = magnified section indicated with white square in merge. (B) Quantification of A; pORF2 intensity depicted as CTCF per cell. (C) Quantification of A; tMOC = red signal being present in green areas per cell. Unpaired t test with Holm-Sidak correction for all panels; ∗∗∗∗P < .0001.

References

    1. Purdy M.A., Harrison T.J., Jameel S., Meng X.-J., Okamoto H., van der Poel W.H.M., Smith D.B. Ictv Report Consortium. ICTV virus taxonomy profile: hepeviridae. J Gen Virol. 2017;98:2645–2646. - PMC - PubMed
    1. Boxall E., Herborn A., Kochethu G., Pratt G., Adams D., Ijaz S., Teo C.-G. Transfusion-transmitted hepatitis E in a ‘nonhyperendemic’ country. Transfus Med. 2006;16:79–83. - PubMed
    1. Ricci A., Allende A., Bolton D., Chemaly M., Davies R., Fernandez Escamez P.S., Herman L., Koutsoumanis K., Lindqvist R., Nørrung B., Robertson L., Ru G., Sanaa M., Simmons M., Skandamis P., Snary E., Speybroeck N., Ter Kuile B., Threlfall J., Wahlström H., Di Bartolo I., Johne R., Pavio N., Rutjes S., van der Poel W., Vasickova P., Hempen M., Messens W., Rizzi V., Latronico F., Girone R. Public health risks associated with hepatitis E virus (HEV) as a food-borne pathogen. EFSA J. 2017;15:e4886. - PMC - PubMed
    1. Minuk G.Y., Sun A., Sun D.F., Uhanova J., Nicolle L.E., Larke B., Giulivi A. Serological evidence of hepatitis E virus infection in an indigenous North American population. Can J Gastroenterol. 2007;21:439–442. - PMC - PubMed
    1. Echevarría J.M., González J.E., Lewis-Ximenez L.L., Dos Santos D.R.L., Munné M.S., Pinto M.A., Pujol F.H., Rodríguez-Lay L.A. Hepatitis E virus infection in Latin America: a review. J Med Virol. 2013;85:1037–1045. - PubMed

Publication types

LinkOut - more resources