Review
. 2021 Jan 4;218(1):e20200264.
doi: 10.1084/jem.20200264.

Tumor-infiltrating dendritic cell states are conserved across solid human cancers

Affiliations
Review

Tumor-infiltrating dendritic cell states are conserved across solid human cancers

Genevieve M Gerhard et al. J Exp Med. .

Abstract

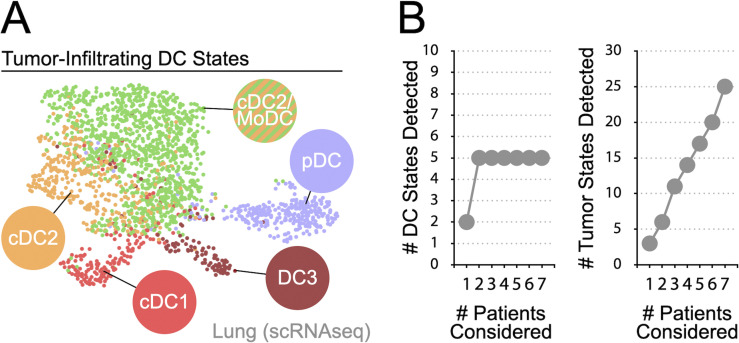
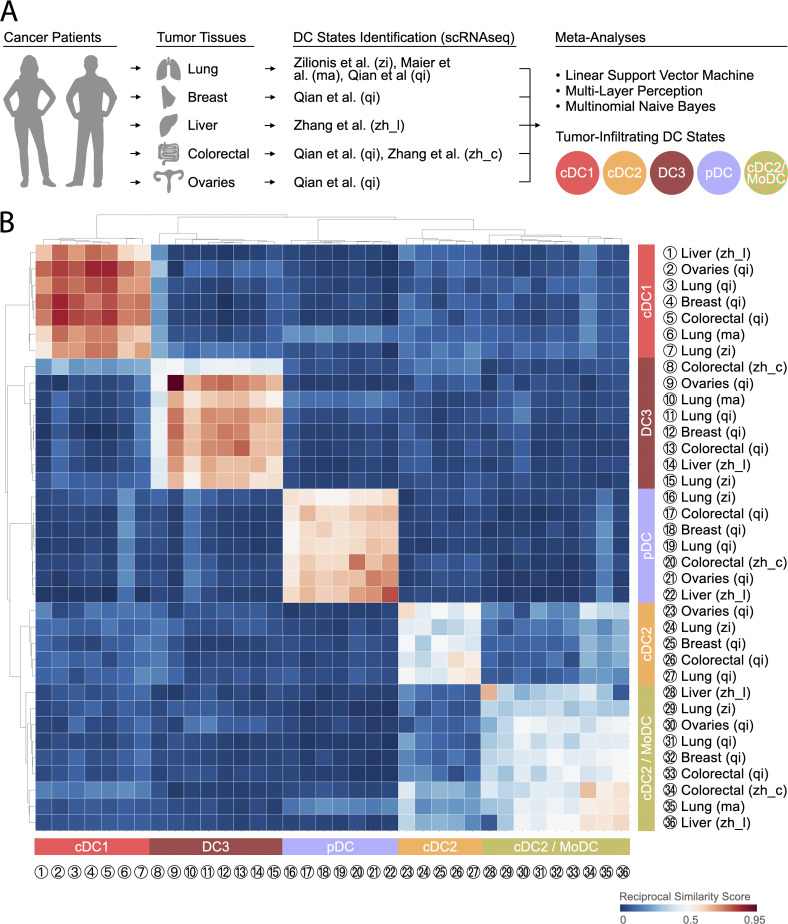
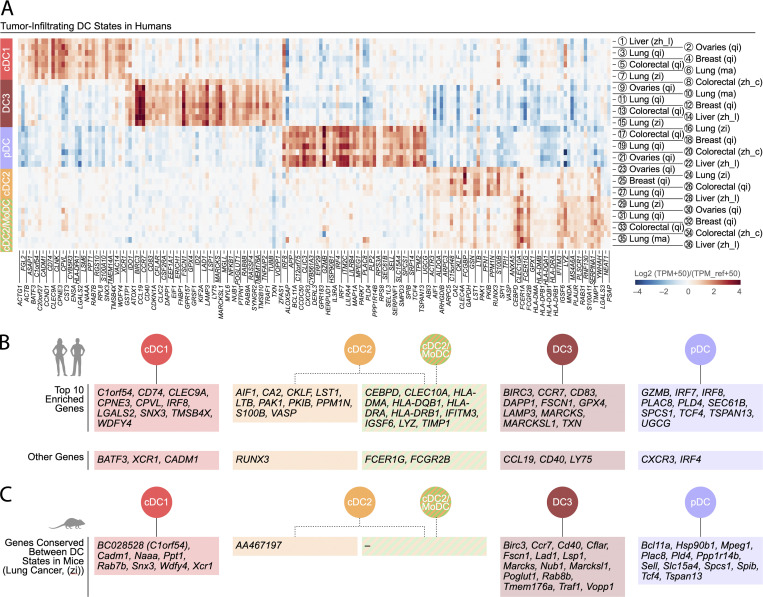
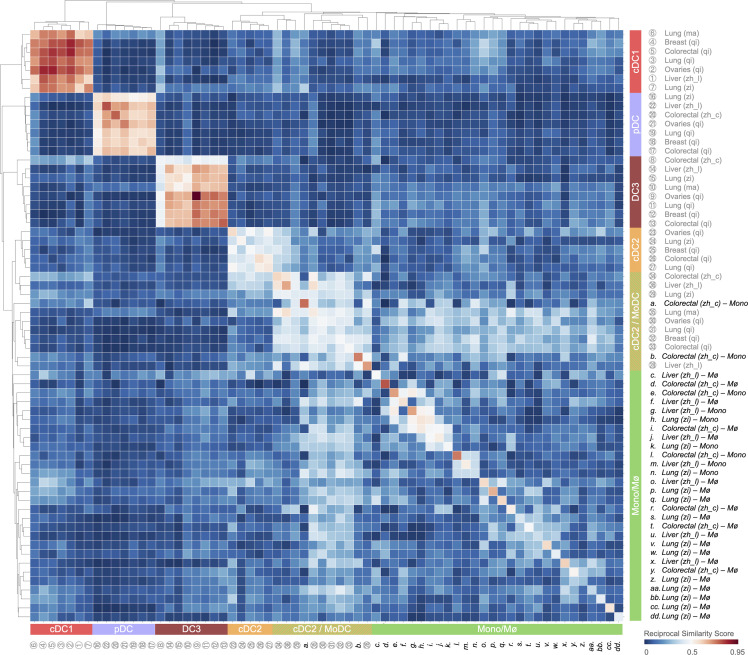
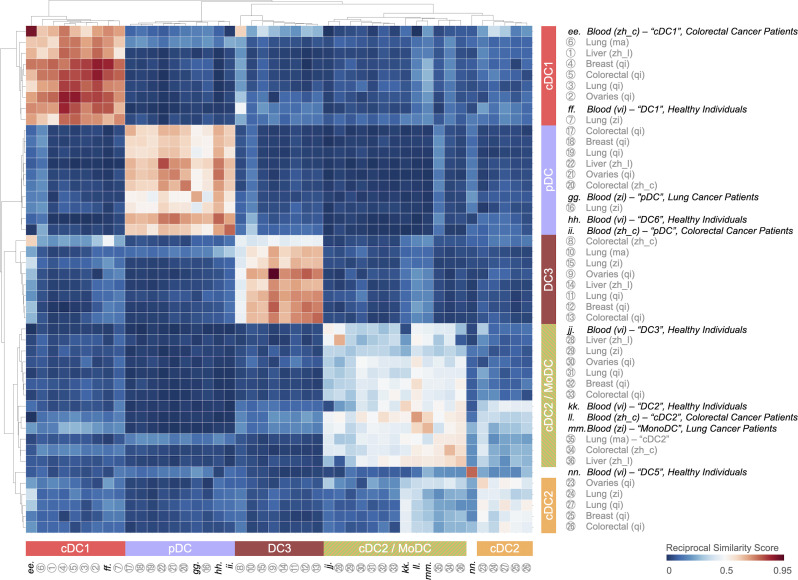
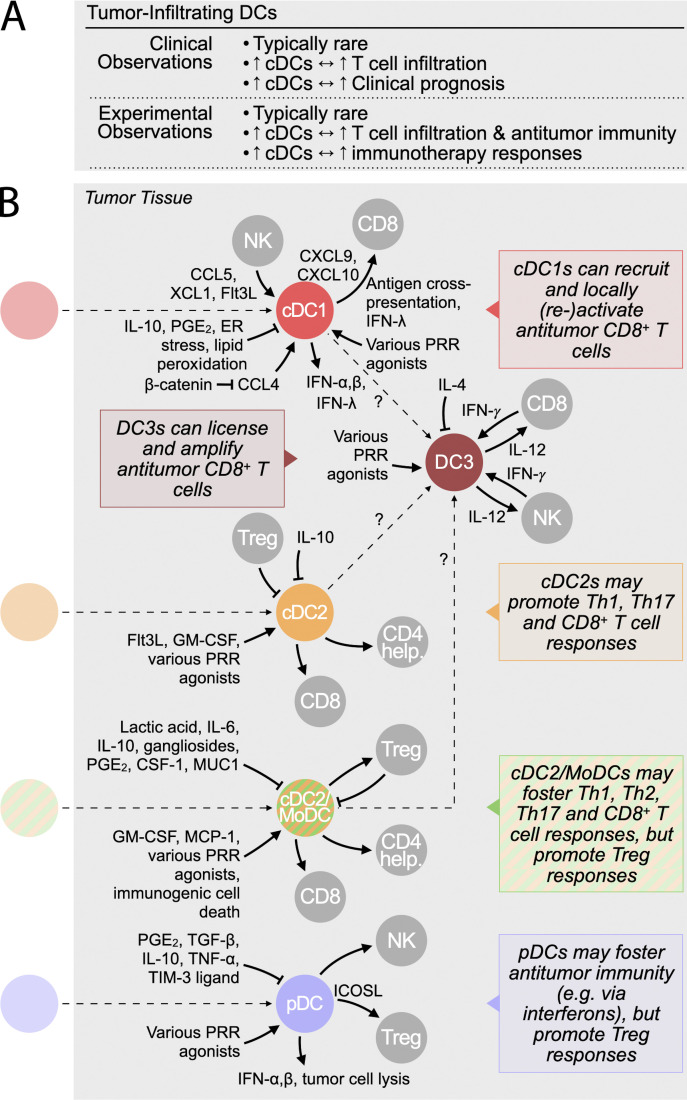
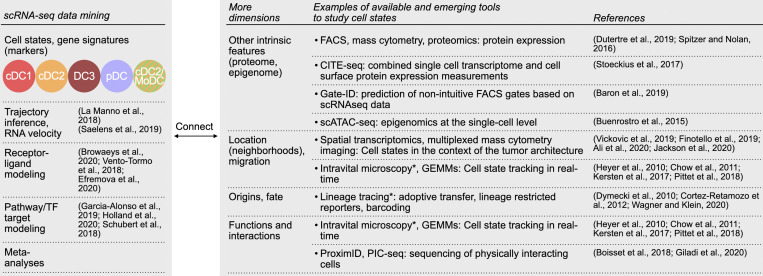
Dendritic cells (DCs) contribute a small fraction of the tumor microenvironment but are emerging as an essential antitumor component based on their ability to foster T cell immunity and immunotherapy responses. Here, we discuss our expanding view of DC heterogeneity in human tumors, as revealed with meta-analysis of single-cell transcriptome profiling studies. We further examine tumor-infiltrating DC states that are conserved across patients, cancer types, and species and consider the fundamental and clinical relevance of these findings. Finally, we provide an outlook on research opportunities to further explore mechanisms governing tumor-infiltrating DC behavior and functions.


Conflict of interest statement

Disclosures: R. Bill reported that is wife is an employee and stockholder of CSL Behring. His salary is funded by a postdoc fellowship of the Swiss National Science Foundation (SNSF; P400PM_183852). M.J. Pittet reported personal fees from Aileron Therapeutics, AstraZeneca, Cygnal Therapeutics, Elstar Therapeutics, KSQ Therapeutics, Merck, and Siamab Therapeutics outside the submitted work. No other disclosures were reported.

Figures

Figure 1.
Figure 1.
scRNA-seq–based detection of tumor-infiltrating DC states in human NSCLC. (A) Uniform manifold approximation and projection of tumor-infiltrating DC states identified in NSCLC by scRNA-seq. (B) Cumulative plots show the total number of identifiable DC states (left) or tumor cell states (right), with every patient added. The order of patients is determined by accumulating number of cell states detected. All panels are adapted from Zilionis et al. (2019).
Figure 2.
Figure 2.
Five tumor-infiltrating DC states are conserved across solid human cancer types. (A) Cartoon illustrating the human tumor tissues and scRNA-seq studies that were used to compare the transcriptome of tumor-infiltrating DC states. Specific references are as follows: zi, Zilionis et al. (2019); ma, Maier et al. (2020); qi, Qian et al. (2020); zh_l, Zhang et al. (2019); zh_c, Zhang et al. (2020). (B) Heatmap showing a reciprocal similarity score r for each tumor-infiltrating DC state comparison pair, as defined in the supplemental text. The score was calculated using the probability estimates returned by the Linear Support Vector Machine classifier on log-transformed data. The DC populations numbered 1 to 36 refer to previously published states, which are referenced in Table S1. Five conserved states are identified as follows: cDC1 (red), cDC2 (orange), cDC2/MoDC (orange-green striped), DC3 (dark red), and pDC (violet). (State 8 is heterogeneous: its reclustering reveals two new states that are similar to other cDC1 and DC3 states based on marker gene comparison; Zhang et al., 2020.)
Figure 3.
Figure 3.
Human tumor-infiltrating DC states show distinctive gene expression profiles across solid cancer types. (A) Enriched genes in human tumor-infiltrating DC states. The identification of these genes is detailed in the supplemental text. The DC populations numbered 1 to 36 refer to previously published states (see Fig. 2 B for definitions) and are detailed in Table S1. The five conserved DC states are identified as follows: cDC1 (red), cDC2 (orange), cDC2/MoDC (orange-green striped), DC3 (dark red), and pDC (violet). (B) Highlight of the 10 most differentially expressed genes for each human tumor-infiltrating DC state across cancer types. Additional differentially expressed genes of interest are also shown. (C) List of the enriched genes from Fig. 3, A and B, that are also conserved between mouse tumor-infiltrating DC states, based on data obtained in a murine lung adenocarcinoma model driven by KrasG12D and loss of Tp53 (Zilionis et al., 2019).
Figure S1.
Figure S1.
Tumor-infiltrating cDC1, cDC2, DC3, and pDC states are distinct from monocyte and macrophage states, whereas the tumor-infiltrating cDC2/MoDC state is not. Heatmap showing a reciprocal similarity score r for each tumor-infiltrating DC, monocyte, and macrophage state. This score was calculated using the probability estimates returned by the Linear Support Vector Machine classifier on log-transformed data. The DC populations numbered 1 to 36 refer to previously published states, which are referenced in Table S1. The monocyte (Mono) and macrophage (Mø) populations lettered a to dd also refer to previously published states, also referenced in Table S1. Five conserved DC states are identified as follows: cDC1 (red), cDC2 (orange), cDC2/MoDC (orange-green striped), DC3 (dark red), and pDC (violet). Monocyte and macrophage states are highlighted in green.
Figure S2.
Figure S2.
Tumor-infiltrating cDC1, cDC2, cDC2/MoDC, and pDC states resemble circulating DC states in peripheral blood of cancer patients and healthy individuals, whereas the tumor-infiltrating DC3 state does not. Heatmap showing a reciprocal similarity score r for each tumor-infiltrating and blood DC state. This score was calculated using the probability estimates returned by the Linear Support Vector Machine classifier on log-transformed data. The DC populations numbered 1 to 36 refer to previously published states, which are referenced in Table S1. The blood DC states lettered ee to nn also refer to previously published states, which are also referenced in Table S1. Five conserved DC states are identified as follows: cDC1 (red), cDC2 (orange), cDC2/MoDC (orange-green striped), DC3 (dark red), and pDC (violet).
Figure 4.
Figure 4.
Relevance, regulation, and function of tumor-infiltrating DC states. (A) Overall clinical and experimental observations related to tumor-infiltrating DCs, T cell infiltration, and outcome. (B) Each DC state can be positively or negatively regulated by tumor microenvironment–derived factors that influence their antitumor capacity, as identified in experimental studies. Thin dashed lines/arrows represent cell migration or differentiation into another state. Solid arrows and inhibitory signs identify factors that regulate target cell function either positively or negatively. The text boxes describe key functions of the respective DC states. The cDC2 and cDC2/MoDC names represent the states identified in the meta-analysis, and their functions might differ from those of classically gated cDC2s and MoDCs. For instance, classically gated cDC2s from prior studies in mice may include cells from both the cDC2 and cDC2/MoDC states, and classically gated MoDCs from prior studies may include cells from the cDC2/MoDC state.
Figure 5.
Figure 5.
Increasing the number of measured dimensions of tumor-infiltrating DC states. Computational tools can predict multiple dimensions of tumor-infiltrating DC states from single-cell transcriptomes such as fate potential (trajectory inference and RNA velocity), cell–cell interactions, and downstream targets of these ligand–receptor cell–cell interactions (ligand–target modeling), active transcription factors and signaling pathways (transcription factor–target and pathway–target modeling), and conservation of DC states (meta-analyses as performed in this review). These computational prediction tools are instrumental to generate testable hypotheses about tumor-infiltrating DC states; however, multimodal approaches that measure both single-cell transcriptomes and other dimensions are emerging. Available and emerging tools permit the evaluation of other intrinsic features of cells, their location, origins, fate, and functions. *, tools applicable to exploratory models only; GEMM, genetically engineered mouse model.

References

    1. Albert M.L., Darnell J.C., Bender A., Francisco L.M., Bhardwaj N., and Darnell R.B.. 1998. Tumor-specific killer cells in paraneoplastic cerebellar degeneration. Nat. Med. 4:1321–1324. 10.1038/3315 - DOI - PubMed
    1. Alcántara-Hernández M., Leylek R., Wagar L.E., Engleman E.G., Keler T., Marinkovich M.P., Davis M.M., Nolan G.P., and Idoyaga J.. 2017. High-Dimensional Phenotypic Mapping of Human Dendritic Cells Reveals Interindividual Variation and Tissue Specialization. Immunity. 47:1037–1050.e6. 10.1016/j.immuni.2017.11.001 - DOI - PMC - PubMed
    1. Ali H.R., Jackson H.W., Zanotelli V.R.T., Danenberg E., Fischer J.R., Bardwell H., Provenzano E., Ali H.R., Al Sa’d M., Alon S., et al. 2020. Imaging mass cytometry and multiplatform genomics define the phenogenomic landscape of breast cancer. Nat. Can. 1:163–175. 10.1038/s43018-020-0026-6 - DOI - PubMed
    1. Anandasabapathy N., Feder R., Mollah S., Tse S.W., Longhi M.P., Mehandru S., Matos I., Cheong C., Ruane D., Brane L., et al. 2014. Classical Flt3L-dependent dendritic cells control immunity to protein vaccine. J. Exp. Med. 211:1875–1891. 10.1084/jem.20131397 - DOI - PMC - PubMed
    1. Ardouin L., Luche H., Chelbi R., Carpentier S., Shawket A., Montanana Sanchis F., Santa Maria C., Grenot P., Alexandre Y., Grégoire C., et al. 2016. Broad and Largely Concordant Molecular Changes Characterize Tolerogenic and Immunogenic Dendritic Cell Maturation in Thymus and Periphery. Immunity. 45:305–318. 10.1016/j.immuni.2016.07.019 - DOI - PubMed

Publication types