

Seasonal and elevational variability in the induction of specialized compounds from mountain birch (Betula pubescens var. pumila) by winter moth larvae (Operophtera brumata)
- PMID: 33601421
- PMCID: PMC8190950
- DOI: 10.1093/treephys/tpab023
Seasonal and elevational variability in the induction of specialized compounds from mountain birch (Betula pubescens var. pumila) by winter moth larvae (Operophtera brumata)
Abstract
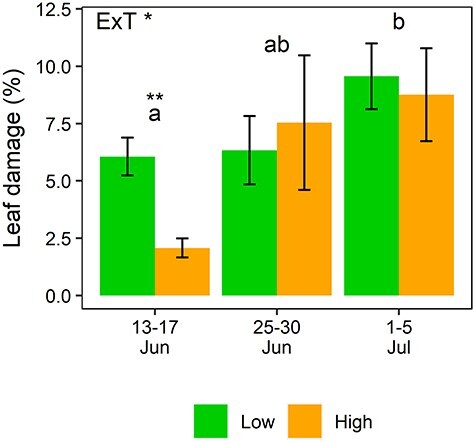
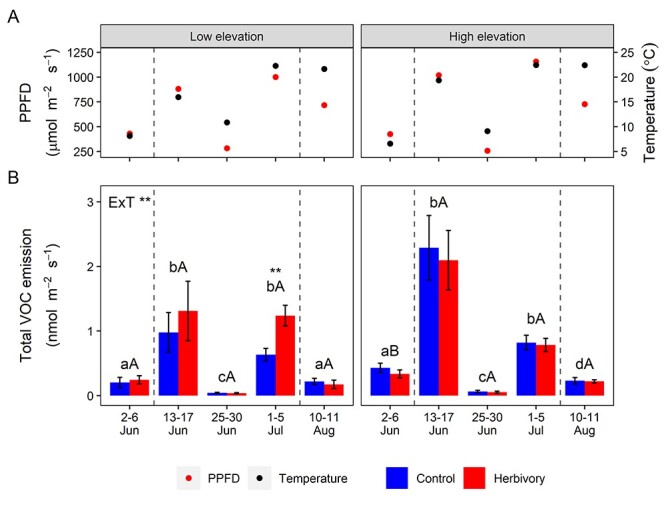
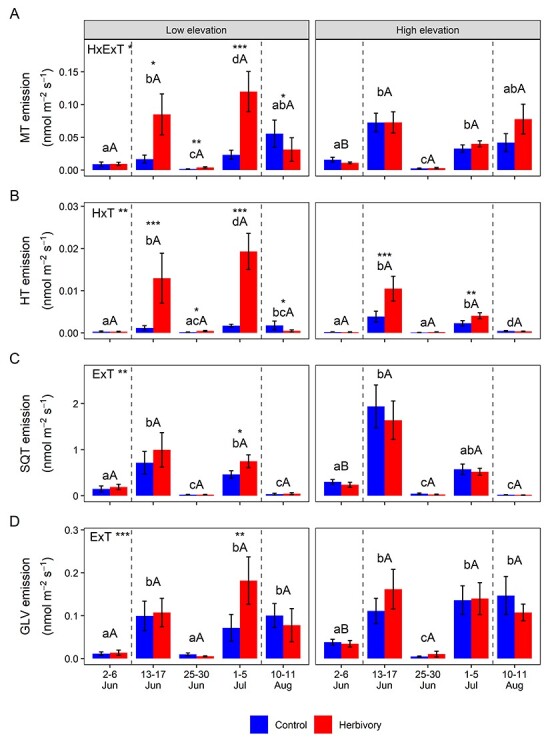
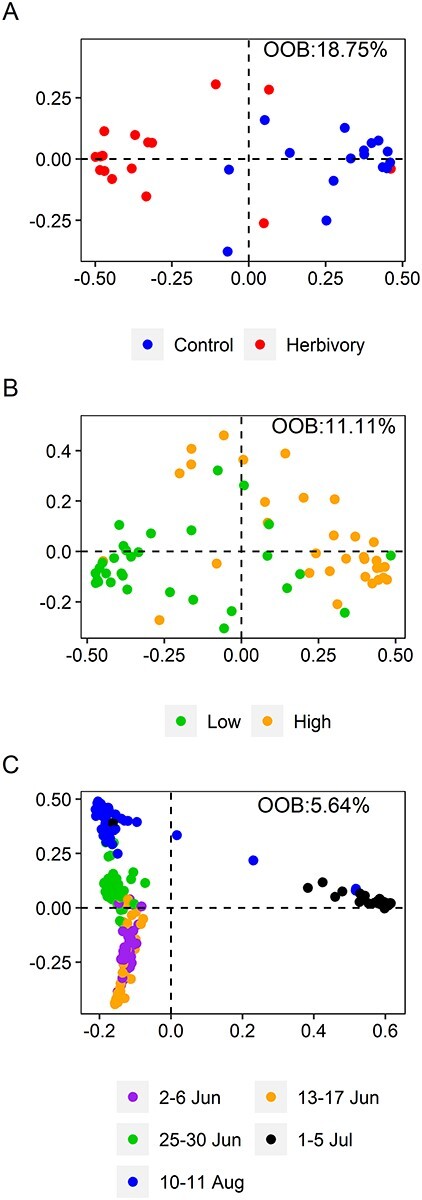
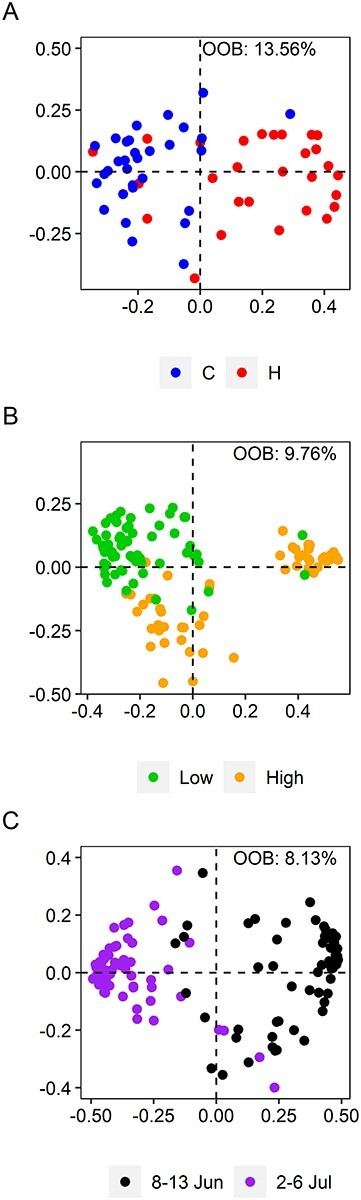
The mountain birch [Betula pubescens var. pumila (L.)] forest in the Subarctic is periodically exposed to insect outbreaks, which are expected to intensify due to climate change. To mitigate abiotic and biotic stresses, plants have evolved chemical defenses, including volatile organic compounds (VOCs) and non-volatile specialized compounds (NVSCs). Constitutive and induced production of these compounds, however, are poorly studied in Subarctic populations of mountain birch. Here, we assessed the joint effects of insect herbivory, elevation and season on foliar VOC emissions and NVSC contents of mountain birch. The VOCs were sampled in situ by an enclosure technique and analyzed by gas chromatography-mass spectrometry. NVSCs were analyzed by liquid chromatography-mass spectrometry using an untargeted approach. At low elevation, experimental herbivory by winter moth larvae (Operophtera brumata) increased emissions of monoterpenes and homoterpenes over the 3-week feeding period, and sesquiterpenes and green leaf volatiles at the end of the feeding period. At high elevation, however, herbivory augmented only homoterpene emissions. The more pronounced herbivory effects at low elevation were likely due to higher herbivory intensity. Of the individual compounds, linalool, ocimene, 4,8-dimethylnona-1,3,7-triene, 2-methyl butanenitrile and benzyl nitrile were among the most responsive compounds in herbivory treatments. Herbivory also altered foliar NVSC profiles at both low and high elevations, with the most responsive compounds likely belonging to fatty acyl glycosides and terpene glycosides. Additionally, VOC emissions from non-infested branches were higher at high than low elevation, particularly during the early season, which was mainly driven by phenological differences. The VOC emissions varied substantially over the season, largely reflecting the seasonal variations in temperature and light levels. Our results suggest that if insect herbivory pressure continues to rise in the mountain birch forest with ongoing climate change, it will significantly increase VOC emissions with important consequences for local trophic interactions and climate.
Keywords: biotic stress; geometrid moth; global change; plant–insect interactions; secondary metabolites; volatile organic compounds.
© The Author(s) 2021. Published by Oxford University Press. All rights reserved. For permissions, please e-mail: journals.permission@oup.com.
Conflict of interest statement
None declared.
Figures
References
-
- Ameye M, Allmann S, Verwaeren J, Smagghe G, Haesaert G, Schuurink RC, Audenaert K (2018) Green leaf volatile production by plants: a meta-analysis. New Phytol 220:666–683. - PubMed
-
- Ammunet T, Bylund H, Jepsen JU (2015) Northern geometrids and climate change: from abiotic factors to trophic interactions. In: Bjorkman C, Niemela P (eds) Climate change and insect pests. CABI Publishing, Wallingford, pp 235–247.
-
- Bale JS, Masters GJ, Hodkinson ID et al. (2002) Herbivory in global climate change research: direct effects of rising temperature on insect herbivores. Glob Chang Biol 8:1–16.
-
- Bates D, Mächler M, Bolker B, Walker S (2015) Fitting linear mixed-effects models using lme4. J Stat Softw 67:1–48.
Publication types
MeSH terms
Substances
LinkOut - more resources
Full Text Sources
Other Literature Sources
