. 2021 Feb 18;18(1):8.
doi: 10.1186/s12014-020-09306-6.

Time dependent effect of cold ischemia on the phosphoproteome and protein kinase activity in fresh-frozen colorectal cancer tissue obtained from patients

Affiliations

Time dependent effect of cold ischemia on the phosphoproteome and protein kinase activity in fresh-frozen colorectal cancer tissue obtained from patients

Tineke E Buffart et al. Clin Proteomics. .

Abstract

Background: Based on their potential to analyze aberrant cellular signaling in relation to biological function, kinase activity profiling in tumor biopsies by peptide microarrays and mass spectrometry-based phosphoproteomics may guide selection of protein kinase inhibitors in patients with cancer. Variable tissue handling procedures in clinical practice may influence protein phosphorylation status and kinase activity and therewith may hamper biomarker discovery. Here, the effect of cold ischemia time (CIT) on the stability of kinase activity and protein phosphorylation status in fresh-frozen clinical tissue samples was studied using peptide microarrays and mass spectrometry-based phosphoproteomics.

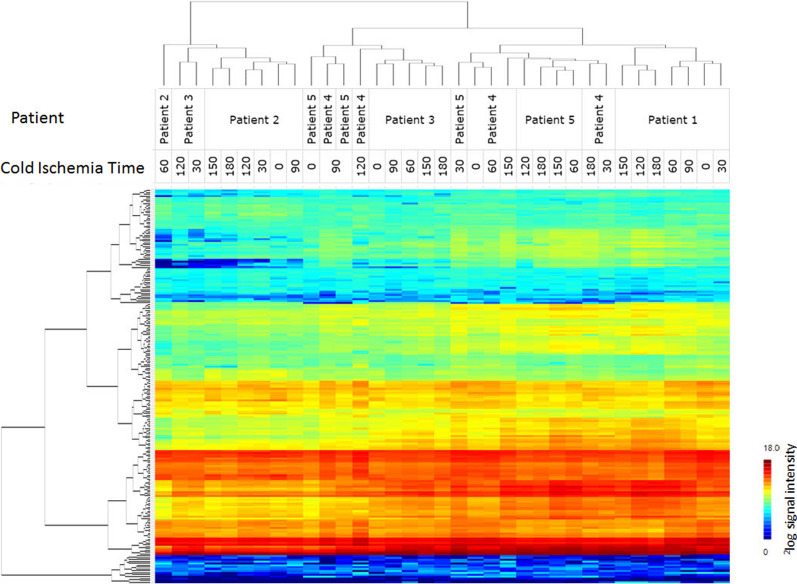
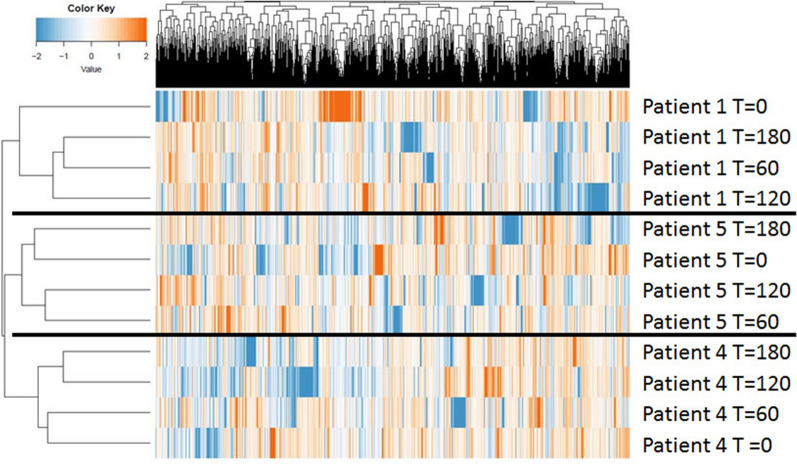
Methods: Biopsies of colorectal cancer resection specimens from five patients were collected and snap frozen immediately after surgery and at 6 additional time points between 0 and 180 min of CIT. Kinase activity profiling was performed for all samples using a peptide microarray. MS-based global phosphoproteomics was performed in tumors from 3 patients at 4 time points. Statistical and cluster analyses were performed to analyze changes in kinase activity and phosphoproteome resulting from CIT.

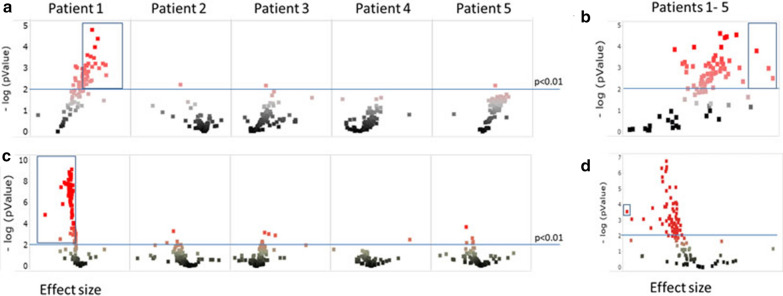
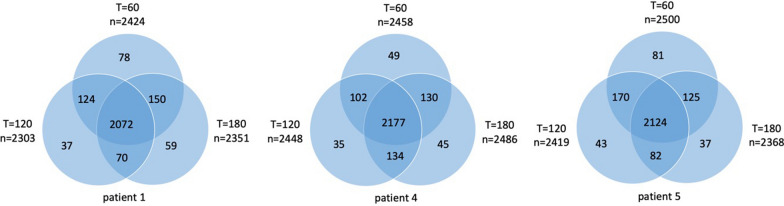
Results: Unsupervised cluster analysis of kinase activity and phosphoproteome data revealed that samples from the same patients cluster together. Continuous ANOVA analysis of all 7 time points for 5 patient samples resulted in 4 peptides out of 210 (2%) with significantly (p < 0.01 and fold change > 2) altered signal intensity in time. In 4 out of 5 patients tumor kinase activity was stable with CIT. MS-based phosphoproteomics resulted in the detection of 10,488 different phosphopeptides with on average 6044 phosphopeptides per tumor sample. 2715 phosphopeptides were detected in all samples at time point 0, of which 90 (3.3%) phosphopeptides showed significant changes in intensity with CIT (p < 0.01). Only two phosphopeptides were significantly changed in all time points, including one peptide (PKP3) with a fold change > 2.

Conclusions: The vast majority of the phosphoproteome as well as the activity of protein kinases in colorectal cancer resection tissue is stable up to 180 min of CIT and reflects tumor characteristics. However, specific changes in kinase activity with increasing CIT were observed. Therefore, stringent tissue collection procedures are advised to minimize changes in kinase activity during CIT.

Keywords: Cancer; Cold ischemia; Mass spectrometry; Peptide microarray; Phosphoproteomics; Protein kinase.


Conflict of interest statement

The authors declare no conflicts of interest. AvdB, NB, TvdL, RdW, RR, and RH, are/were employed by PamGene International BV.

Figures

Fig. 1
Fig. 1
Unsupervised hierarchical cluster analysis of tyrosine and serine/threonine kinase activity profiles. Unsupervised cluster analyses of the phosphorylation profiles of the tumor samples from five patients on time points 0, 30, 60, 90, 120, 150 and 180 min of CIT. The different tumor samples included in the study are represented on the X-axis and 2log signal intensity of each kinase is represented on the Y-axis. Tumor samples from the same patient largely cluster together indicating that changes in kinase activity are more pronounced between tumors of different patients rather than based on differences in CIT
Fig. 2
Fig. 2
Mean protein tyrosine kinase (PTK) and serine/threonine kinase (STK) activity with CIT (peptide microarray). The mean signal intensity of all peptides at seven time points (T = 0, 30, 60, 90, 120, 150 and 180 min of CIT) for the tumors of all five patients (patient 1–5) for PTK and STK are represented (X-axis). The mean value for all samples is represented in a 2log scale (Y-axis). For each peptide values were the average of six datapoints. First, the median signal minus background values per array for all the technical replicates were calculated and then the average for the sample preparation replicates was calculated. Subsequently the mean of all peptides was calculated
Fig. 3
Fig. 3
Heatmap of protein tyrosine kinase (PTK) and serine/threonine kinase (STK) phosphorylation. Heatmap of 2log transformed mean signal intensities for PTK and STK activity (X-axis) profiles of the tumors of patient 1–5 as function of CIT for the time points 0, 30, 60, 90, 120, 150 and 180 min (Y-axis). Only peptides that passed quality control were included. Peptides are ordered by signal intensity
Fig. 4
Fig. 4
Correlation of signal intensity with CIT. Statistical analysis of the correlation of signal intensity with time till freezing analyzed per tumor (a PTK and c STK) and for all tumors combined (b PTK and d STK) represented in Volcano plots. The -log p-values (Y-axis) are plotted as function of effect size (X-axis). Peptides are colored according to p-values. Peptides with a p-value < 0.01 and effect size > 2 are boxed. In total 33 (35.5%) peptides (box in a, patient 1) and 3 (3%) peptides (box in b) of the peptides were phosphorylated with a significant (p < 0.01) and ≥ twofold increased signal after 180 min of CIT. For STK 62 (53%, box in c, patient 1) and 1 (0.9%, box in d) peptides showed a significant (p < 0.01) and ≥ twofold decreased signal intensities with 180 min of CIT
Fig. 5
Fig. 5
Unsupervised hierarchical clustering of phosphopeptides. Unsupervised cluster analysis of the 2715 phosphopeptides detected in all t = 0 samples. Tumor samples are represented on the X-axis and the signal intensities of the phosphopeptides are represented on the Y-axis. Unsupervised clustering of three different tumors at four different time points shows a clear clustering of the samples per tumor indicating that cold ischemia does not obscure interpatient differences in the phosphoproteome
Fig. 6
Fig. 6
The number of phosphopeptides during CIT. For each patient (patient 1, 4 and 5) the number of phosphopeptides detected at each timepoint (t = 60, t = 120 and t = 180 min of CIT) compared to the 2715 phospopeptides detected at all three T = 0 timepoints. Numbers are represented in a venndiagram of each patient
Fig. 7
Fig. 7
Signal intensities of peptides changing with CIT. Overview of mean (line) and standard deviation (error bars) of the signal intensities of the 90 peptides significantly changing with CIT compared to T = 0 (Y-axis). The different times of CIT compared to t = 0 (t = 60, 120 and 180 min thereafter) are represented on the X-axis

References

    1. Schlessinger J. Cell signaling by receptor tyrosine kinases. Cell. 2000;103(2):211–225. doi: 10.1016/S0092-8674(00)00114-8. - DOI - PubMed
    1. Blume-Jensen P, Hunter T. Oncogenic kinase signalling. Nature. 2001;411(6835):355–365. doi: 10.1038/35077225. - DOI - PubMed
    1. Wistuba II, Gelovani JG, Jacoby JJ, Davis SE, Herbst RS. Methodological and practical challenges for personalized cancer therapies. Nat Rev Clin Oncol. 2011;8(3):135–141. doi: 10.1038/nrclinonc.2011.2. - DOI - PubMed
    1. Piersma SR, Labots M, Verheul HM, Jimenez CR. Strategies for kinome profiling in cancer and potential clinical applications: chemical proteomics and array-based methods. Anal Bioanal Chem. 2010;397(8):3163–3171. doi: 10.1007/s00216-010-3784-7. - DOI - PubMed
    1. Folkvord S, Flatmark K, Dueland S, de Wijn R, Groholt KK, Hole KH, et al. Prediction of response to preoperative chemoradiotherapy in rectal cancer by multiplex kinase activity profiling. Int J Radiat Oncol Biol Phys. 2010;78(2):555–562. doi: 10.1016/j.ijrobp.2010.04.036. - DOI - PubMed