

The impact of local and national restrictions in response to COVID-19 on social contacts in England: a longitudinal natural experiment
- PMID: 33602244
- PMCID: PMC7892289
- DOI: 10.1186/s12916-021-01924-7
The impact of local and national restrictions in response to COVID-19 on social contacts in England: a longitudinal natural experiment
Abstract
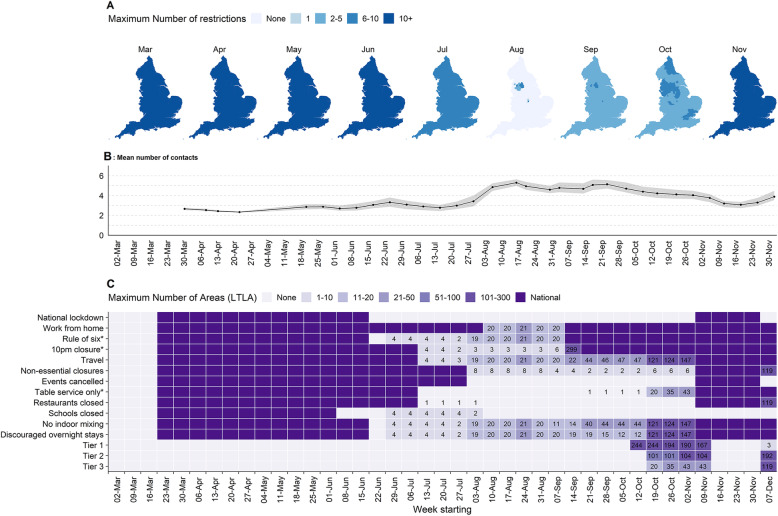
Background: England's COVID-19 response transitioned from a national lockdown to localised interventions. In response to rising cases, these were supplemented by national restrictions on contacts (the Rule of Six), then 10 pm closing for bars and restaurants, and encouragement to work from home. These were quickly followed by a 3-tier system applying different restrictions in different localities. As cases continued to rise, a second national lockdown was declared. We used a national survey to quantify the impact of these restrictions on epidemiologically relevant contacts.
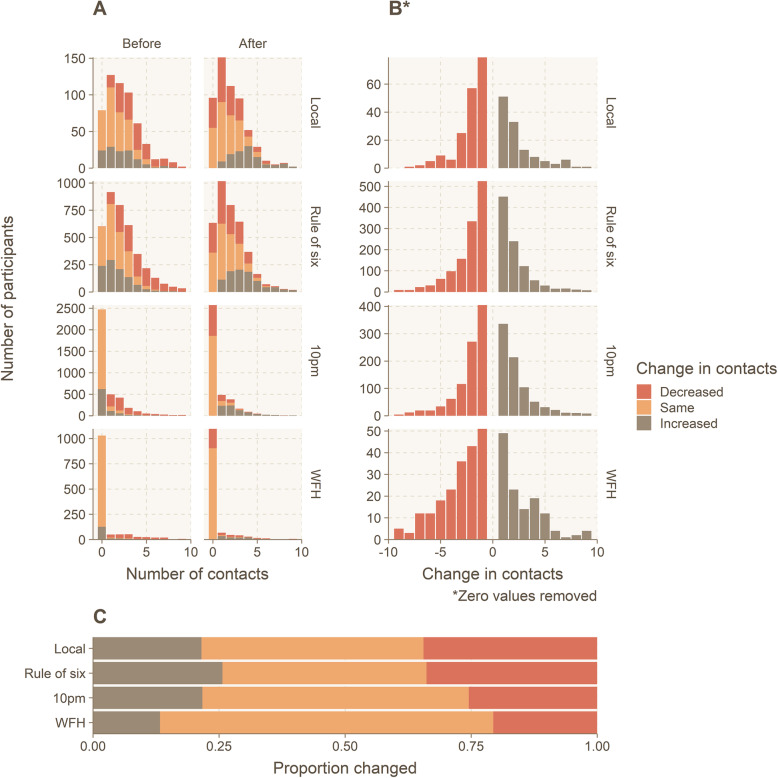
Methods: We compared paired measures on setting-specific contacts before and after each restriction started and tested for differences using paired permutation tests on the mean change in contacts and the proportion of individuals decreasing their contacts.
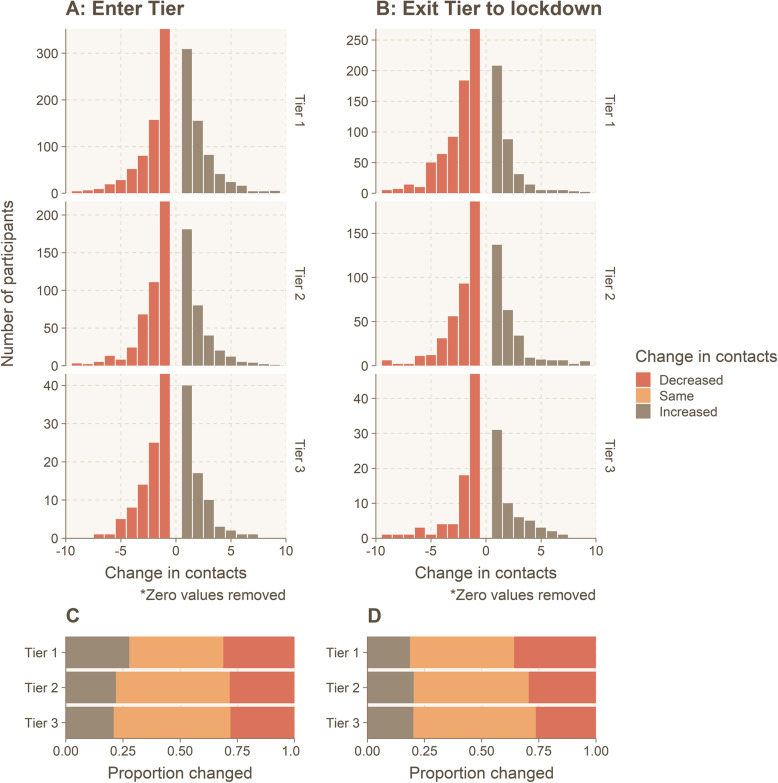
Results: Following the imposition of each measure, individuals tended to report fewer contacts than they had before. However, the magnitude of the changes was relatively small and variable. For instance, although early closure of bars and restaurants appeared to have no measurable effect on contacts, the work from home directive reduced mean daily work contacts by 0.99 (95% confidence interval CI] 0.03-1.94), and the Rule of Six reduced non-work and school contacts by a mean of 0.25 (0.01-0.5) per day. Whilst Tier 3 appeared to also reduce non-work and school contacts, the evidence for an effect of the lesser restrictions (Tiers 1 and 2) was much weaker. There may also have been some evidence of saturation of effects, with those who were in Tier 1 (least restrictive) reducing their contacts markedly when they entered lockdown, which was not reflected in similar changes in those who were already under tighter restrictions (Tiers 2 and 3).
Conclusions: The imposition of various local and national measures in England during the summer and autumn of 2020 has gradually reduced contacts. However, these changes are smaller than the initial lockdown in March. This may partly be because many individuals were already starting from a lower number of contacts.
Keywords: COVID-19; Contact survey; Disease outbreak; England; Lockdowns; Non-pharmaceutical interventions; Pandemic; United Kingdom.
Conflict of interest statement
The authors declare no competing interests.
Figures
References
-
- Prime Minister’s Office, Street 10 Downing. Prime Minister’s statement on coronavirus (COVID-19): 23 March 2020. GOV.UK. 2020. https://www.gov.uk/government/speeches/pm-address-to-the-nation-on-coron.... Accessed 11 Oct 2020.
-
- Davies NG, Kucharski AJ, Eggo RM, Gimma A, Edmunds WJ. Centre for the Mathematical Modelling of Infectious Diseases COVID-19 working group. Effects of non-pharmaceutical interventions on COVID-19 cases, deaths, and demand for hospital services in the UK: a modelling study. Lancet Public Health. 2020;5:e375–e385. doi: 10.1016/S2468-2667(20)30133-X. - DOI - PMC - PubMed
-
- Flaxman S, Mishra S, Gandy A, Unwin HJT, Mellan TA, Coupland H, et al. Estimating the effects of non-pharmaceutical interventions on COVID-19 in Europe. Nature. 2020;584:2570–61. - PubMed
-
- Prime Minister’s Office, Street 10 Downing. PM announces easing of lockdown restrictions: 23 June 2020. GOV.UK. 2020. https://www.gov.uk/government/news/pm-announces-easing-of-lockdown-restr.... Accessed 11 Oct 2020.
Publication types
MeSH terms
Grants and funding
LinkOut - more resources
Full Text Sources
Other Literature Sources
Medical
Research Materials
