. 2021 Feb 23;118(8):e1921960118.
doi: 10.1073/pnas.1921960118.

Differential biosynthesis and cellular permeability explain longitudinal gibberellin gradients in growing roots

Affiliations

Differential biosynthesis and cellular permeability explain longitudinal gibberellin gradients in growing roots

Annalisa Rizza et al. Proc Natl Acad Sci U S A. .

Abstract

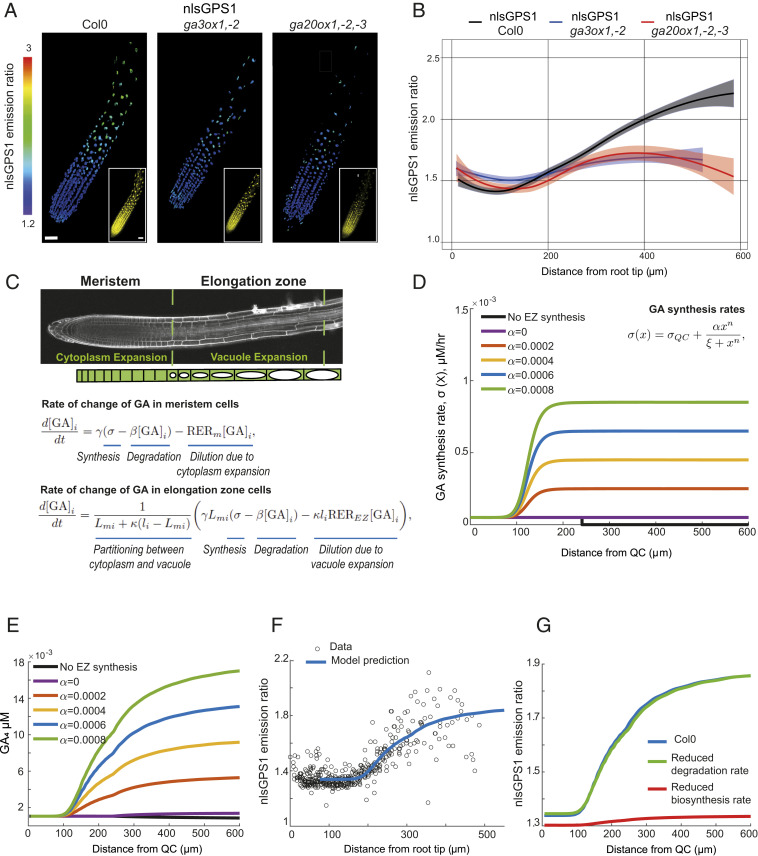
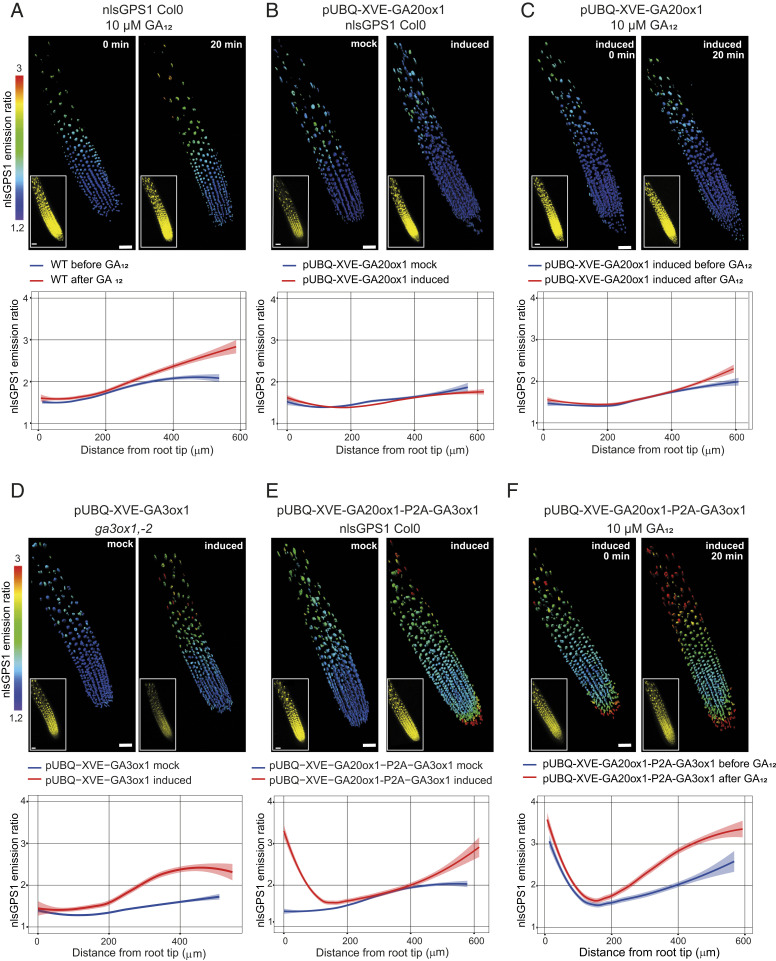
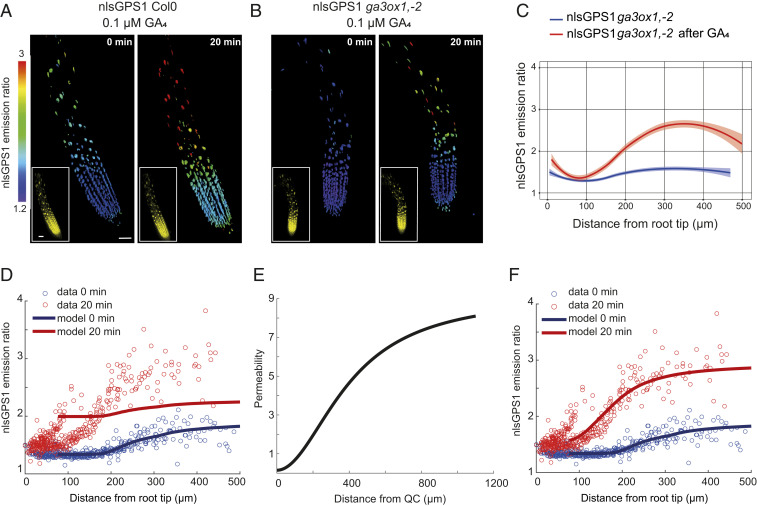
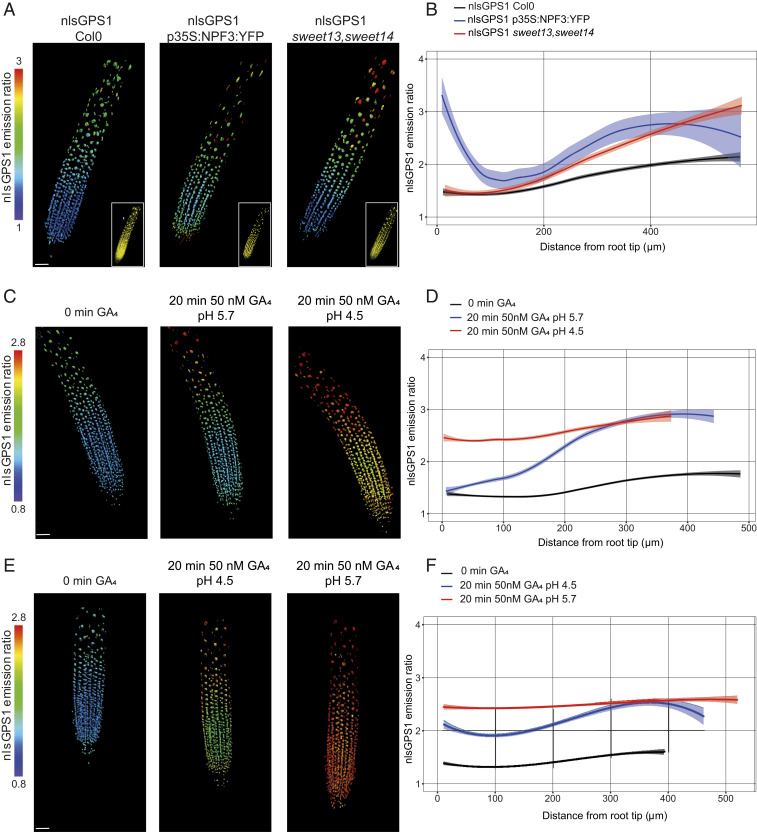
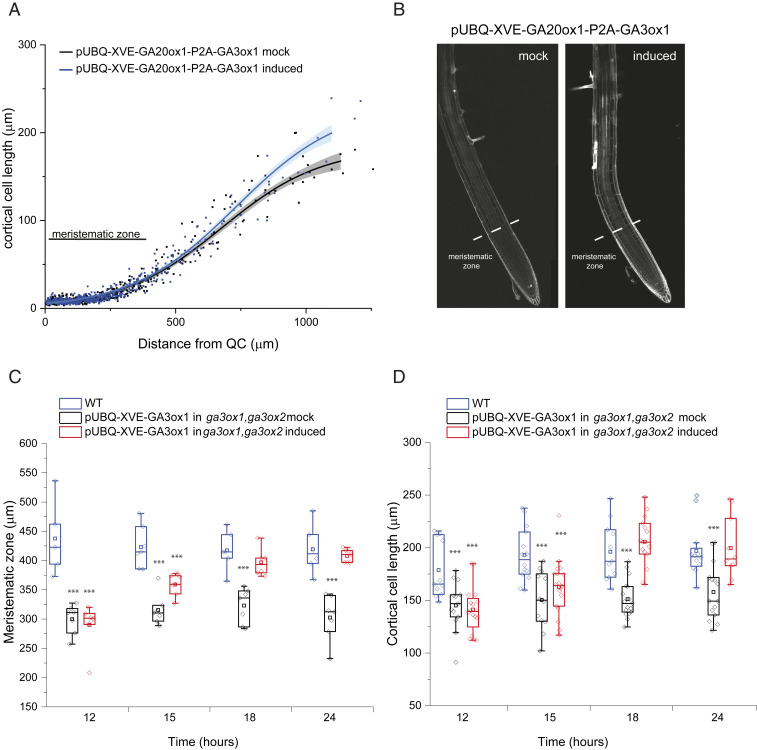
Control over cell growth by mobile regulators underlies much of eukaryotic morphogenesis. In plant roots, cell division and elongation are separated into distinct longitudinal zones and both division and elongation are influenced by the growth regulatory hormone gibberellin (GA). Previously, a multicellular mathematical model predicted a GA maximum at the border of the meristematic and elongation zones. However, GA in roots was recently measured using a genetically encoded fluorescent biosensor, nlsGPS1, and found to be low in the meristematic zone grading to a maximum at the end of the elongation zone. Furthermore, the accumulation rate of exogenous GA was also found to be higher in the elongation zone. It was still unknown which biochemical activities were responsible for these mobile small molecule gradients and whether the spatiotemporal correlation between GA levels and cell length is important for root cell division and elongation patterns. Using a mathematical modeling approach in combination with high-resolution GA measurements in vivo, we now show how differentials in several biosynthetic enzyme steps contribute to the endogenous GA gradient and how differential cellular permeability contributes to an accumulation gradient of exogenous GA. We also analyzed the effects of altered GA distribution in roots and did not find significant phenotypes resulting from increased GA levels or signaling. We did find a substantial temporal delay between complementation of GA distribution and cell division and elongation phenotypes in a GA deficient mutant. Together, our results provide models of how GA gradients are directed and in turn direct root growth.

Keywords: cell growth; gibberellin; hormone biosensor; mathematical modeling; root development.


Conflict of interest statement

The authors declare no competing interest.

Figures

Fig. 1.
Fig. 1.
GA biosynthesis in Arabidopsis roots. (A and B) nlsGPS1 emission ratios of roots 4 d post sowing in WT Col0 or GA biosynthetic mutants ga3ox1, ga3ox2 and ga20ox1, ga20ox2, ga20ox3. (A) Representative three-dimensional (3D) ratio and YFP (Inset) fluorescence images (scale bar, 30 µm). (B) Emission ratios as a function of distance from root tip. Curves of best fit and 95% CIs are computed in R using local polynomial regression (Loess) via ggplot, with smoothing parameter span = 0.75. Complete experiments were repeated at least three times with similar results (n = 10 to 30 roots). (C) Schematic of the multicellular mathematical model. The model simulates the GA and nlsGPS1 dynamics in a single cell file that represents cell files within the growth zones of the Arabidopsis root tip. We prescribe the cells’ growth and division dynamics (SI Appendix, Fig. S2): cells divide within the meristem and elongate slowly due to cytoplasmic expansion before ceasing division on entering the elongation zone, where they undergo rapid elongation because of vacuolar expansion. We simulated a system of ordinary differential equations for the cytoplasmic GA concentration in each cell, i, (denoted by [GA]i (t), in terms of time (t)). As shown, the GA dynamics depend on the GA synthesis rate, (σ[x], in which x denotes the distance from the QC), the GA degradation rate, β, the relative elongation rate in the meristem, RERm, the relative elongation rate in the elongation zone, REREZ, the proportion of the meristem cells that is cytoplasm, γ, the ratio between vacuolar and cytoplasmic GA concentrations, κ, the cell length, li(t), and the length of the cell on leaving the meristem (Lmi). We consider GA synthesis rates of the form σ(x)=σQC+αxn/(ξn+xn), as shown in D for n = 10, σQC = 0.00005 and ξ = 125. (D) GA synthesis rate distribution for different values of α. EZ, elongation zone. (E) Prediction of GA distribution with different α values (corresponding to the synthesis rate distributions shown in D). (F) Model prediction with a high GA biosynthesis rate in the elongation zone (α = 0.0006) reproduces the distribution observed in the nlsGPS1 data. Model parameter values are given in SI Appendix, Table S1. (G) Model predictions of nlsGPS1 emission ratios in WT Col0 versus reduced degradation mutant, ga2ox q, and reduced synthesis mutant, ga20ox1, ga20ox2, ga20ox3.
Fig. 2.
Fig. 2.
Mapping GA biosynthetic enzyme activities in Arabidopsis roots. (AF) nlsGPS1 emission ratios of roots 5 d post sowing. Shown are representative 3D images of emission ratios and YFP fluorescence (Inset) and the emission ratios as a function of distance from root tip (scale bar, 30 µm). Curves of best fit and 95% CIs are computed in R using local polynomial regression (Loess) via ggplot, with smoothing parameter span = 0.75. Complete experiments were repeated at least three times with similar results (n = 15 to 36 roots). (A, C, and F) Before (0 min) and 20 min after 10 µM GA12. (BF) β-estradiol inducible GA enzyme transgenic lines 24 h after induction with 5 µM 17-β-estradiol (induced) or with 0.2% DMSO mock induction (mock).
Fig. 3.
Fig. 3.
Patterned cellular permeability explains the exogenous GA–generated gradient in Arabidopsis roots. (A and B) Representative 3D images of nlsGPS1 emission ratios and YFP fluorescence (Inset) of WT Col0 and ga3ox1, ga3ox2 roots 4 d post sowing before and 20 min after 0.1 µM GA4 (scale bar, 30 µm). (C) nlsGPS1 emission ratios for nuclei of ga3ox1, ga3ox2 double mutant as a function of distance from the root tip before and after GA4. Curves of best fit and 95% CIs are computed in R using local polynomial regression (Loess) via ggplot, with smoothing parameter span = 0.75. Complete experiments were repeated at least three times with similar result (n = 10 roots). (D) Model prediction and experimental data for the nlsGPS1 distribution after a 0.1 µM GA4 dose assuming spatially homogeneous permeability. (E) Spatially varying permeability specified in model predictions shown in F. (F) Model prediction and experimental data for the nlsGPS1 distribution after a 0.1 µM GA4 dose, assuming a spatially varying permeability as shown in E. Model parameters for D and F are given in SI Appendix, Table S1.
Fig. 4.
Fig. 4.
Endogenous GA levels in transporter mutants and exogenous GA accumulation under low pH. (A, C, and E) Representative 3D images of nlsGPS1 emission ratios and YFP fluorescence (A only, Inset). (Scale bar, 30 µm.) (B, D, and F) Emission ratios as a function of distance from root tip. Curves of best fit and 95% CIs are computed in R using local polynomial regression (Loess) via ggplot, with smoothing parameter span = 0.75. Complete experiments were repeated at least three times with similar results (n = 15 to 36 roots). (A and B) nlsGPS1 emission ratios of roots 4 d post sowing in WT Col0, p35S:NPF3:YFP, and sweet13, sweet14 double mutant. (CF) nlsGPS1 emission ratios of seedlings grown in the RootChip8S. (C) Still frames from Movie S1 at 0, 20 min post-GA at pH 5.7, and 20 min post-GA at low pH 4.5. (E) Still frames from Movie S2 at 0, 20 min post-GA at low pH 4.5, and 20 min post-GA at pH 5.7.
Fig. 5.
Fig. 5.
GA root growth phenotypes with GA overproduction and complementation. (A and B) Five-day-old roots of nlsGPS1 in pUBQ-XVE-AtGA20ox1-P2A-GA3ox1 line after 24 h with mock (0.2% DMSO) or 5 µM 17-β-estradiol induction. (A) Cortical cell length from the QC to the elongation zone with the border between meristematic zone and elongation zone indicated. Curves of best fit and 95% CIs are computed in R using local polynomial regression (Loess) via ggplot, with smoothing parameter span = 0.75. (B) Representative images of PI-stained roots with the border between meristematic zone and elongation zone indicated. (C and D) Beeswarm and box plots of growth phenotypes for 5-d-old roots of nlsGPS1 in either WT or a pUBQ-XVE-AtGA3ox1 in ga3ox1, ga3ox2 mutant line after 12, 15, 18 and 24 h induction with 5 µM 17-β-estradiol or mock solution (0.2% DMSO). Asterisks indicate a significant difference between treatments and untreated WT (one-way ANOVA test; ***P < 0.001). (C) Meristematic zone length including root cap. (D) Mature cortical cell length (950 µm from the QC).

References

    1. Hu Y., et al., Gibberellins play an essential role in late embryogenesis of Arabidopsis. Nat. Plants 4, 289–298 (2018). - PubMed
    1. Cheng H., et al., Gibberellin regulates Arabidopsis floral development via suppression of DELLA protein function. Development 131, 1055–1064 (2004). - PubMed
    1. Alabadí D., Gil J., Blázquez M. A., García-Martínez J. L., Gibberellins repress photomorphogenesis in darkness. Plant Physiol. 134, 1050–1057 (2004). - PMC - PubMed
    1. An F., et al., Coordinated regulation of apical hook development by gibberellins and ethylene in etiolated Arabidopsis seedlings. Cell Res. 22, 915–927 (2012). - PMC - PubMed
    1. Hedden P., The genes of the green revolution. Trends Genet. 19, 5–9 (2003). - PubMed

Publication types

MeSH terms

LinkOut - more resources