. 2021 Feb 23;118(8):e2012843118.
doi: 10.1073/pnas.2012843118.

Nonselective cation permeation in an AMPA-type glutamate receptor

Affiliations

Nonselective cation permeation in an AMPA-type glutamate receptor

Johann Biedermann et al. Proc Natl Acad Sci U S A. .

Abstract

Fast excitatory synaptic transmission in the central nervous system relies on the AMPA-type glutamate receptor (AMPAR). This receptor incorporates a nonselective cation channel, which is opened by the binding of glutamate. Although the open pore structure has recently became available from cryo-electron microscopy (Cryo-EM), the molecular mechanisms governing cation permeability in AMPA receptors are not understood. Here, we combined microsecond molecular dynamic (MD) simulations on a putative open-state structure of GluA2 with electrophysiology on cloned channels to elucidate ion permeation mechanisms. Na+, K+, and Cs+ permeated at physiological rates, consistent with a structure that represents a true open state. A single major ion binding site for Na+ and K+ in the pore represents the simplest selectivity filter (SF) structure for any tetrameric cation channel of known structure. The minimal SF comprised only Q586 and Q587, and other residues on the cytoplasmic side formed a water-filled cavity with a cone shape that lacked major interactions with ions. We observed that Cl- readily enters the upper pore, explaining anion permeation in the RNA-edited (Q586R) form of GluA2. A permissive architecture of the SF accommodated different alkali metals in distinct solvation states to allow rapid, nonselective cation permeation and copermeation by water. Simulations suggested Cs+ uses two equally populated ion binding sites in the filter, and we confirmed with electrophysiology of GluA2 that Cs+ is slightly more permeant than Na+, consistent with serial binding sites preferentially driving selectivity.

Keywords: electrophysiology; ion channel; molecular dynamics; neurotransmitter.


Conflict of interest statement

The authors declare no competing interest.

Figures

Fig. 1.
Fig. 1.
AMPA receptor and the simulation setup. (A) The activated open state of the AMPA receptor from Cryo-EM [PDB ID: 5WEO (1)] with Stargazin molecules removed. The receptor is composed of ATD, LBD, and TMD. (B) The TMD and linkers to the LBD layer were included the MD simulations. The sites where the linkers were truncated and physically restrained (see Methods) are marked with red balls. Two out of the four subunits are shown. (C) The SF region of the AMPA receptor pore, with key residues labeled. Again, only two diagonally opposed subunits are drawn. (D) The computational electrophysiology setup was composed of two tetrameric AMPA channels, each embedded in a separate POPC lipid bilayer, solvated with water molecules and ions. A small cation imbalance between the two compartments α and β was maintained during the simulations. The resulting gradient gave a transmembrane potential to drive ion permeation.
Fig. 2.
Fig. 2.
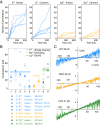
Ion conductances in GluA2. (A) Cumulative ion permeation events in the GluA2 pore for individual trajectories of K+ and Na+ simulations with the respective force fields. The simulations were performed at 303 K using an ion imbalance of 6e between two compartments α and β. (B) Conductances derived from the K+ (blue), Na+ (orange), and Cs+ (green) simulations performed with amber99sb and charmm36 force fields. Simulations were carried out at different temperatures at the nominal transmembrane voltages indicated. Filled and empty circles mark mean and individual conductances determined from MD simulations. The mean conductances from single-channel recordings for Na+, K+, and Cs+ (30 ± 2, 39 ± 2, and 45 ± 4 pS, respectively) are displayed as lines (shading are SDs of the means) with the same color code as the wet experiments. (C) Outside-out patch clamp electrophysiology of a single GluA2 (Q) channel in symmetrical Na+, K+, and Cs+. The voltage ramp (200 ms in duration) was made in the presence of 10 mM glutamate and 100 µM CTZ. The dashed lines are the fitted chord conductances, and the conductances for the individual recordings are shown.
Fig. 3.
Fig. 3.
Simulated Na+ and K+ permeation of GluA2. Simulations were performed at 303 K using an ion imbalance of 6 e between two compartments α and β. (A) Representative traces of K+ passing through the SF of the AMPA channel pore. Ions drawn in D are indicated by balls. The center of mass of the SF backbone atoms corresponds to the 10 Å point along the pore axis. The major ion binding site SI and the immediately adjacent minor site SII are indicated by dashed lines in A, B, and C. (B) One-dimensional ion occupancy of cations within the SF of the AMPA channel pore. Occupancy from simulations with (Left) the charmm36 force field and (Right) the amber99sb force field. (C) Free-energy profile for K+ permeation constructed from amber99sb force field. (D) Representative snapshots of a simulation (from Movie S1) showing multiple K+ ions passing the SF during ion conduction. The color code of ions is identical with the ion track plot in A.
Fig. 4.
Fig. 4.
Ion occupancy, dwell time distribution, and hydration states. (A) Two-dimensional ion occupancy within the SF resolved radially and along the pore axis (z-axis) as a contour plot calculated from MD simulations of GluA2 with different ion types (K+ and Na+) and force fields (amber99sb and charmm36). The simulations were performed at 303 K using an imbalance of six cations between the two compartments, α and β. The ion occupancy in number of ions per 0.001 Å3 per 500 ns was normalized according to the volume change along the radius. The center of mass of the SF backbone atoms corresponds to the 10 Å point along the pore axis. Approximate centers of the binding sites are drawn as dashed lines (SI, red and SII, blue). (B) Dwell time histograms for SI and SII binding sites. Vertical dotted lines are means of the respective dwell times. (C) The number of oxygens within the first hydration shell of the according ion type along the pore axis. The number of coordinating water oxygens is in blue, the number of coordinating protein oxygens is in orange, and their sum is in gray.
Fig. 5.
Fig. 5.
Cs+ permeation of GluA2. (A) Permeation events for Cs+ in the amber99sb force field. (B) Two-dimensional ion occupancy plots. The center of mass of the SF backbone atoms corresponds to the 10 Å point along the pore axis. Approximate centers of the binding sites are drawn as dashed lines (SI, red and SII, blue) that extend to C. (C) Free energy and hydration profiles for Cs+ along the pore axis. (D) Dwell time histograms for Cs+ in the SI and SII sites, with mean dwell time for each site indicated with a dashed line. (EH) Same as for AD but for the charmm36 force field. (I) Outward rectifying responses to voltage ramps in Na+ (green) and Cs+ (purple) measured with patch clamp electrophysiology. The outward rectification (ratio of chord conductances at +100/−100 mV) was 2.7 ± 0.3 for Na+ and 3.1 ± 0.3 for Cs+ (n = 7 patches). The inset shows the typical shift in reversal potential on exchange of external Cs+- and Na+. The pipette solution contained Na+. (J) Reversal potential of AMPAR currents in external NaCl and CsCl solution and conductance ratios of Na+ versus Cs+ for inward and outward permeation. Probability of no difference in the slope ratio was versus a ratio of 1 with paired Student’s t test.
Fig. 6.
Fig. 6.
PCA and clustering analysis. (A) Comparison of the SF in Cryo-EM structure and the representative structures of the K+, Na+, and Cs+ simulations using amber99sb force field. The representative structure is the middle structure of the most populated cluster from clustering analysis (SI Appendix, Table S1). An rmsd cutoff of 0.05 nm was used for cluster determination. A total simulation time of 2.5 μs was obtained for K+ and Na+ simulations, respectively, while for Cs+, the total simulation time is 3.0 μs. (B) Results of the PCA analysis on the SF part, where trajectories of K+, Na+, and Cs+ simulations were combined for the determination of the principal components. Conformational dynamics of the SF in K+, Na+, and Cs+ simulations were projected individually onto the first three principal modes. Less conductive states were combined from K+ simulation run 1 (300 to 450 ns), run 3 (200 to 300 ns), and run 5 (200 to 350 ns) of the lower channel (SI Appendix, Fig. S4), where only one permeation event was observed during the entire simulation period.

Similar articles

Cited by

References

    1. Twomey E. C., Yelshanskaya M. V., Grassucci R. A., Frank J., Sobolevsky A. I., Channel opening and gating mechanism in AMPA-subtype glutamate receptors. Nature 549, 60–65 (2017). - PMC - PubMed
    1. Chen S., et al. ., Activation and desensitization mechanism of AMPA receptor-TARP complex by cryo-EM. Cell 170, 1234–1246.e14 (2017). - PMC - PubMed
    1. Sommer B., Köhler M., Sprengel R., Seeburg P. H., RNA editing in brain controls a determinant of ion flow in glutamate-gated channels. Cell 67, 11–19 (1991). - PubMed
    1. Swanson G. T., Kamboj S. K., Cull-Candy S. G., Single-channel properties of recombinant AMPA receptors depend on RNA editing, splice variation, and subunit composition. J. Neurosci. 17, 58–69 (1997). - PMC - PubMed
    1. Burnashev N., Villarroel A., Sakmann B., Dimensions and ion selectivity of recombinant AMPA and kainate receptor channels and their dependence on Q/R site residues. J. Physiol. 496, 165–173 (1996). - PMC - PubMed

Publication types

LinkOut - more resources