

A de novo strategy to develop NIR precipitating fluorochrome for long-term in situ cell membrane bioimaging
- PMID: 33602816
- PMCID: PMC7923636
- DOI: 10.1073/pnas.2018033118
A de novo strategy to develop NIR precipitating fluorochrome for long-term in situ cell membrane bioimaging
Abstract
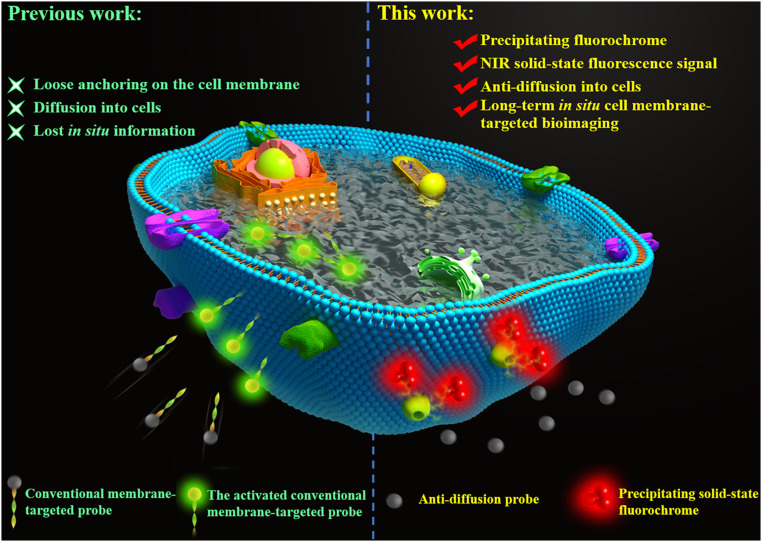
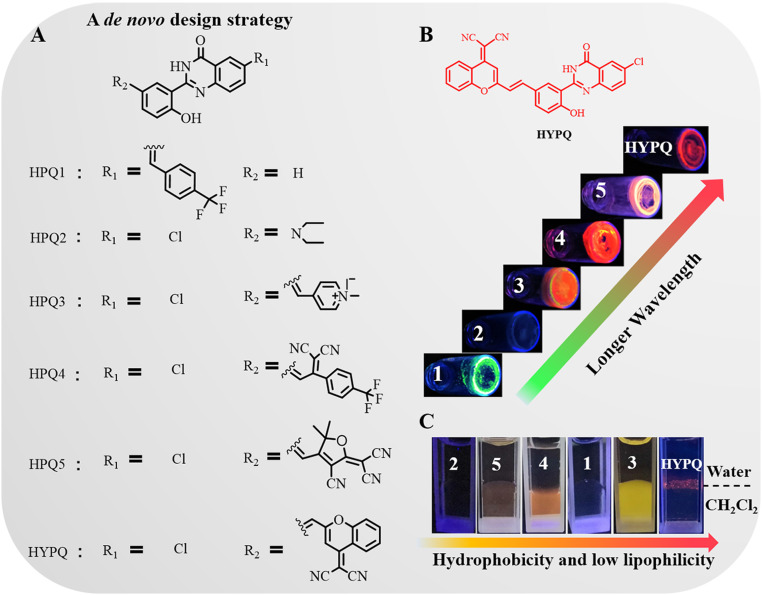
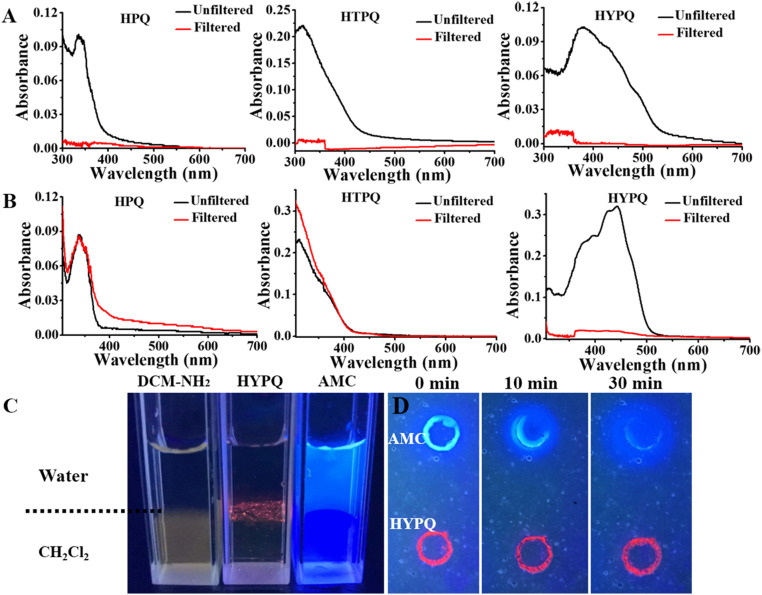
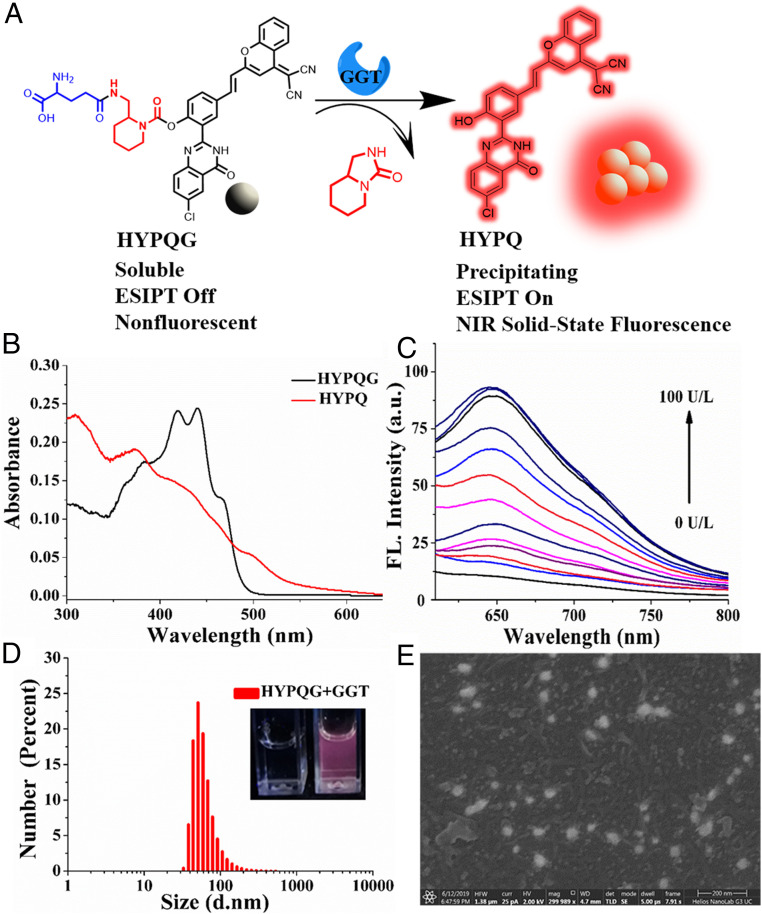
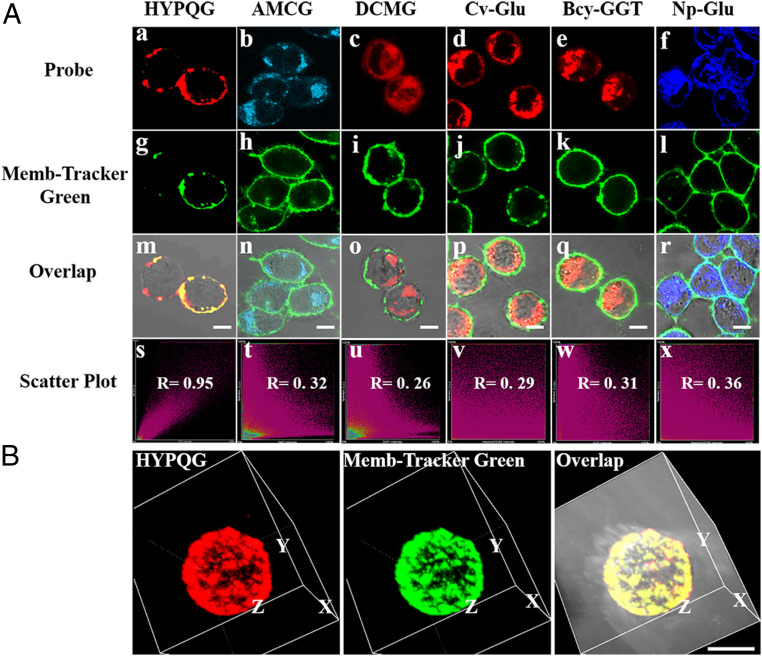
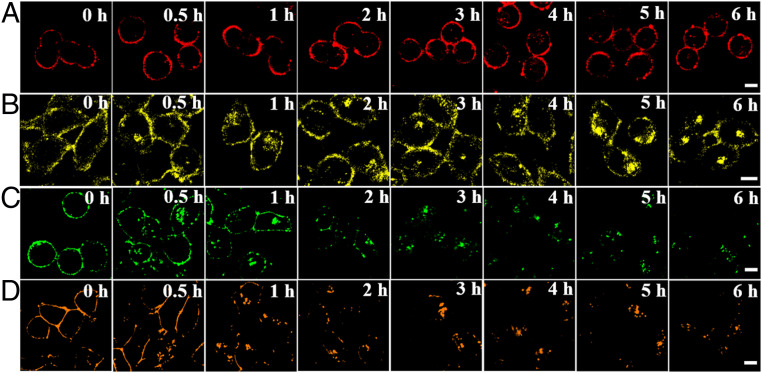
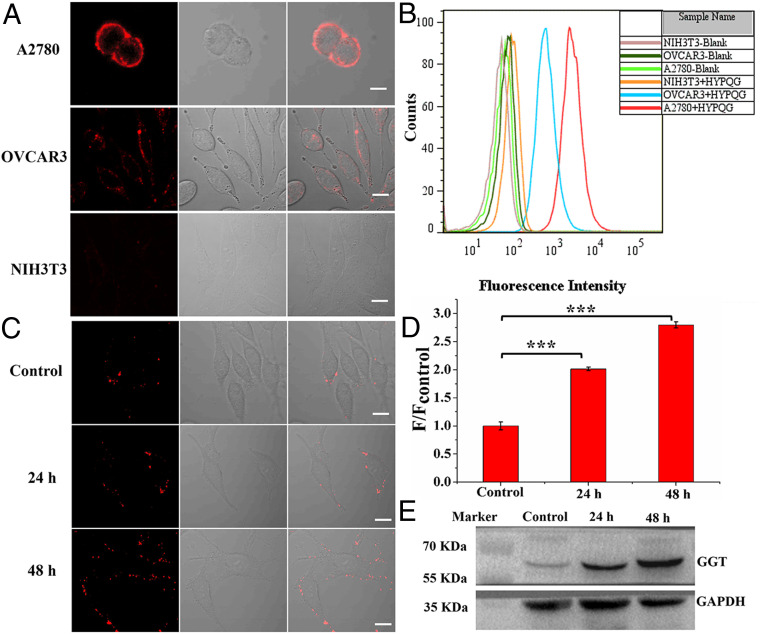
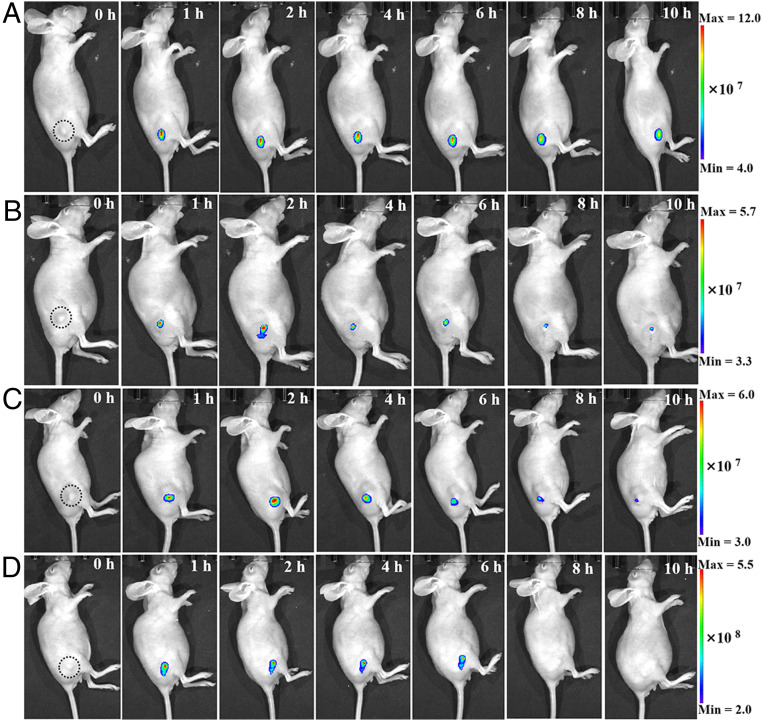
Cell membrane-targeted bioimaging is a prerequisite for studying the roles of membrane-associated biomolecules in various physiological and pathological processes. However, long-term in situ bioimaging on the cell membrane with conventional fluorescent probes leads to diffusion into cells from the membrane surface. Therefore, we herein proposed a de novo strategy to construct an antidiffusion probe by integrating a fluorochrome characterized by strong hydrophobicity and low lipophilicity, with an enzyme substrate to meet this challenge. This precipitating fluorochrome HYPQ was designed by conjugating the traditionally strong hydrophobic solid-state fluorochrome 6-chloro-2-(2-hydroxyphenyl) quinazolin-4(3H)-one (HPQ) with a 2-(2-methyl-4H-chromen-4-ylidene) malononitrile group to obtain closer stacking to lower lipophilicity and elongate emission to the far-red to near-infrared wavelength. As proof-of-concept, the membrane-associated enzyme γ-glutamyltranspeptidase (GGT) was selected as a model enzyme to design the antidiffusion probe HYPQG. Then, benefiting from the precipitating and stable signal properties of HYPQ, in situ imaging of GGT on the membrane was successfully realized. Moreover, after HYPQG was activated by GGT, the fluorescence signal on the cell membrane remained unchanged, with incubation time even extending to 6 h, which is significant for in situ monitoring of enzymatic activity. In vivo testing subsequently showed that the tumor region could be accurately defined by this probe after long-term in situ imaging of tumor-bearing mice. The excellent performance of HYPQ indicates that it may be an ideal alternative for constructing universal antidiffusion fluorescent probes, potentially providing an efficient tool for accurate imaging-guided surgery in the future.
Keywords: antidiffusion probe; cell membrane–targeted bioimaging; in vivo bioimaging; long-term in situ imaging; precipitating fluorochrome.
Conflict of interest statement
The authors declare no competing interest.
Figures
Similar articles
-
Molecular Engineering of Near-Infrared Fluorescent Probes for Cell Membrane Imaging.Molecules. 2023 Feb 16;28(4):1906. doi: 10.3390/molecules28041906. Molecules. 2023. PMID: 36838896 Free PMC article. Review.
-
In Situ Imaging of Furin Activity with a Highly Stable Probe by Releasing of Precipitating Fluorochrome.Anal Chem. 2018 Oct 2;90(19):11680-11687. doi: 10.1021/acs.analchem.8b03335. Epub 2018 Sep 19. Anal Chem. 2018. PMID: 30191711
-
In vivo tumor imaging by a γ-glutamyl transpeptidase-activatable near-infrared fluorescent probe.Anal Bioanal Chem. 2018 Oct;410(26):6771-6777. doi: 10.1007/s00216-018-1181-9. Epub 2018 Jun 16. Anal Bioanal Chem. 2018. PMID: 29909457
-
Fluorescence-Guided Cancer Diagnosis and Surgery by a Zero Cross-Talk Ratiometric Near-Infrared γ-Glutamyltranspeptidase Fluorescent Probe.Anal Chem. 2019 Jan 2;91(1):1056-1063. doi: 10.1021/acs.analchem.8b04416. Epub 2018 Dec 19. Anal Chem. 2019. PMID: 30539637
-
[Development of Novel Dark Quenchers and Their Application to Imaging Probes].Yakugaku Zasshi. 2019;139(2):277-283. doi: 10.1248/yakushi.18-00174-3. Yakugaku Zasshi. 2019. PMID: 30713240 Review. Japanese.
Cited by
-
Long-term spatiotemporal and highly specific imaging of the plasma membrane of diverse plant cells using a near-infrared AIE probe.Chem Sci. 2023 Jan 19;14(8):2139-2148. doi: 10.1039/d2sc05727a. eCollection 2023 Feb 22. Chem Sci. 2023. PMID: 36845931 Free PMC article.
-
Conjugated Aggregation-Induced Fluorescent Materials for Biofluorescent Probes: A Review.Biosensors (Basel). 2023 Jan 19;13(2):159. doi: 10.3390/bios13020159. Biosensors (Basel). 2023. PMID: 36831925 Free PMC article. Review.
-
Molecular Engineering of Near-Infrared Fluorescent Probes for Cell Membrane Imaging.Molecules. 2023 Feb 16;28(4):1906. doi: 10.3390/molecules28041906. Molecules. 2023. PMID: 36838896 Free PMC article. Review.
-
Enzyme-Instructed Aggregation/Dispersion of Fluorophores for Near-Infrared Fluorescence Imaging In Vivo.Molecules. 2023 Jul 12;28(14):5360. doi: 10.3390/molecules28145360. Molecules. 2023. PMID: 37513233 Free PMC article. Review.
-
Molecularly engineered AIEgens with enhanced quantum and singlet-oxygen yield for mitochondria-targeted imaging and photodynamic therapy.Chem Sci. 2022 Aug 3;13(32):9373-9380. doi: 10.1039/d2sc00889k. eCollection 2022 Aug 17. Chem Sci. 2022. PMID: 36092996 Free PMC article.
References
-
- Li L., Shen X., Xu Q. H., Yao S. Q., A switchable two-photon membrane tracer capable of imaging membrane-associated protein tyrosine phosphatase activities. Angew. Chem. Int. Ed. Engl. 52, 424–428 (2013). - PubMed
-
- Mu J., et al. ., A small-molecule FRET reporter for the real-time visualization of cell-surface proteolytic enzyme functions. Angew. Chem. Int. Ed. Engl. 53, 14357–14362 (2014). - PubMed
Publication types
MeSH terms
Substances
Associated data
LinkOut - more resources
Full Text Sources
Other Literature Sources
Research Materials
Miscellaneous
