. 2021 Feb 19;371(6531):eaba0862.
doi: 10.1126/science.aba0862.

Clinically relevant mutations in core metabolic genes confer antibiotic resistance

Affiliations

Clinically relevant mutations in core metabolic genes confer antibiotic resistance

Allison J Lopatkin et al. Science. .

Abstract

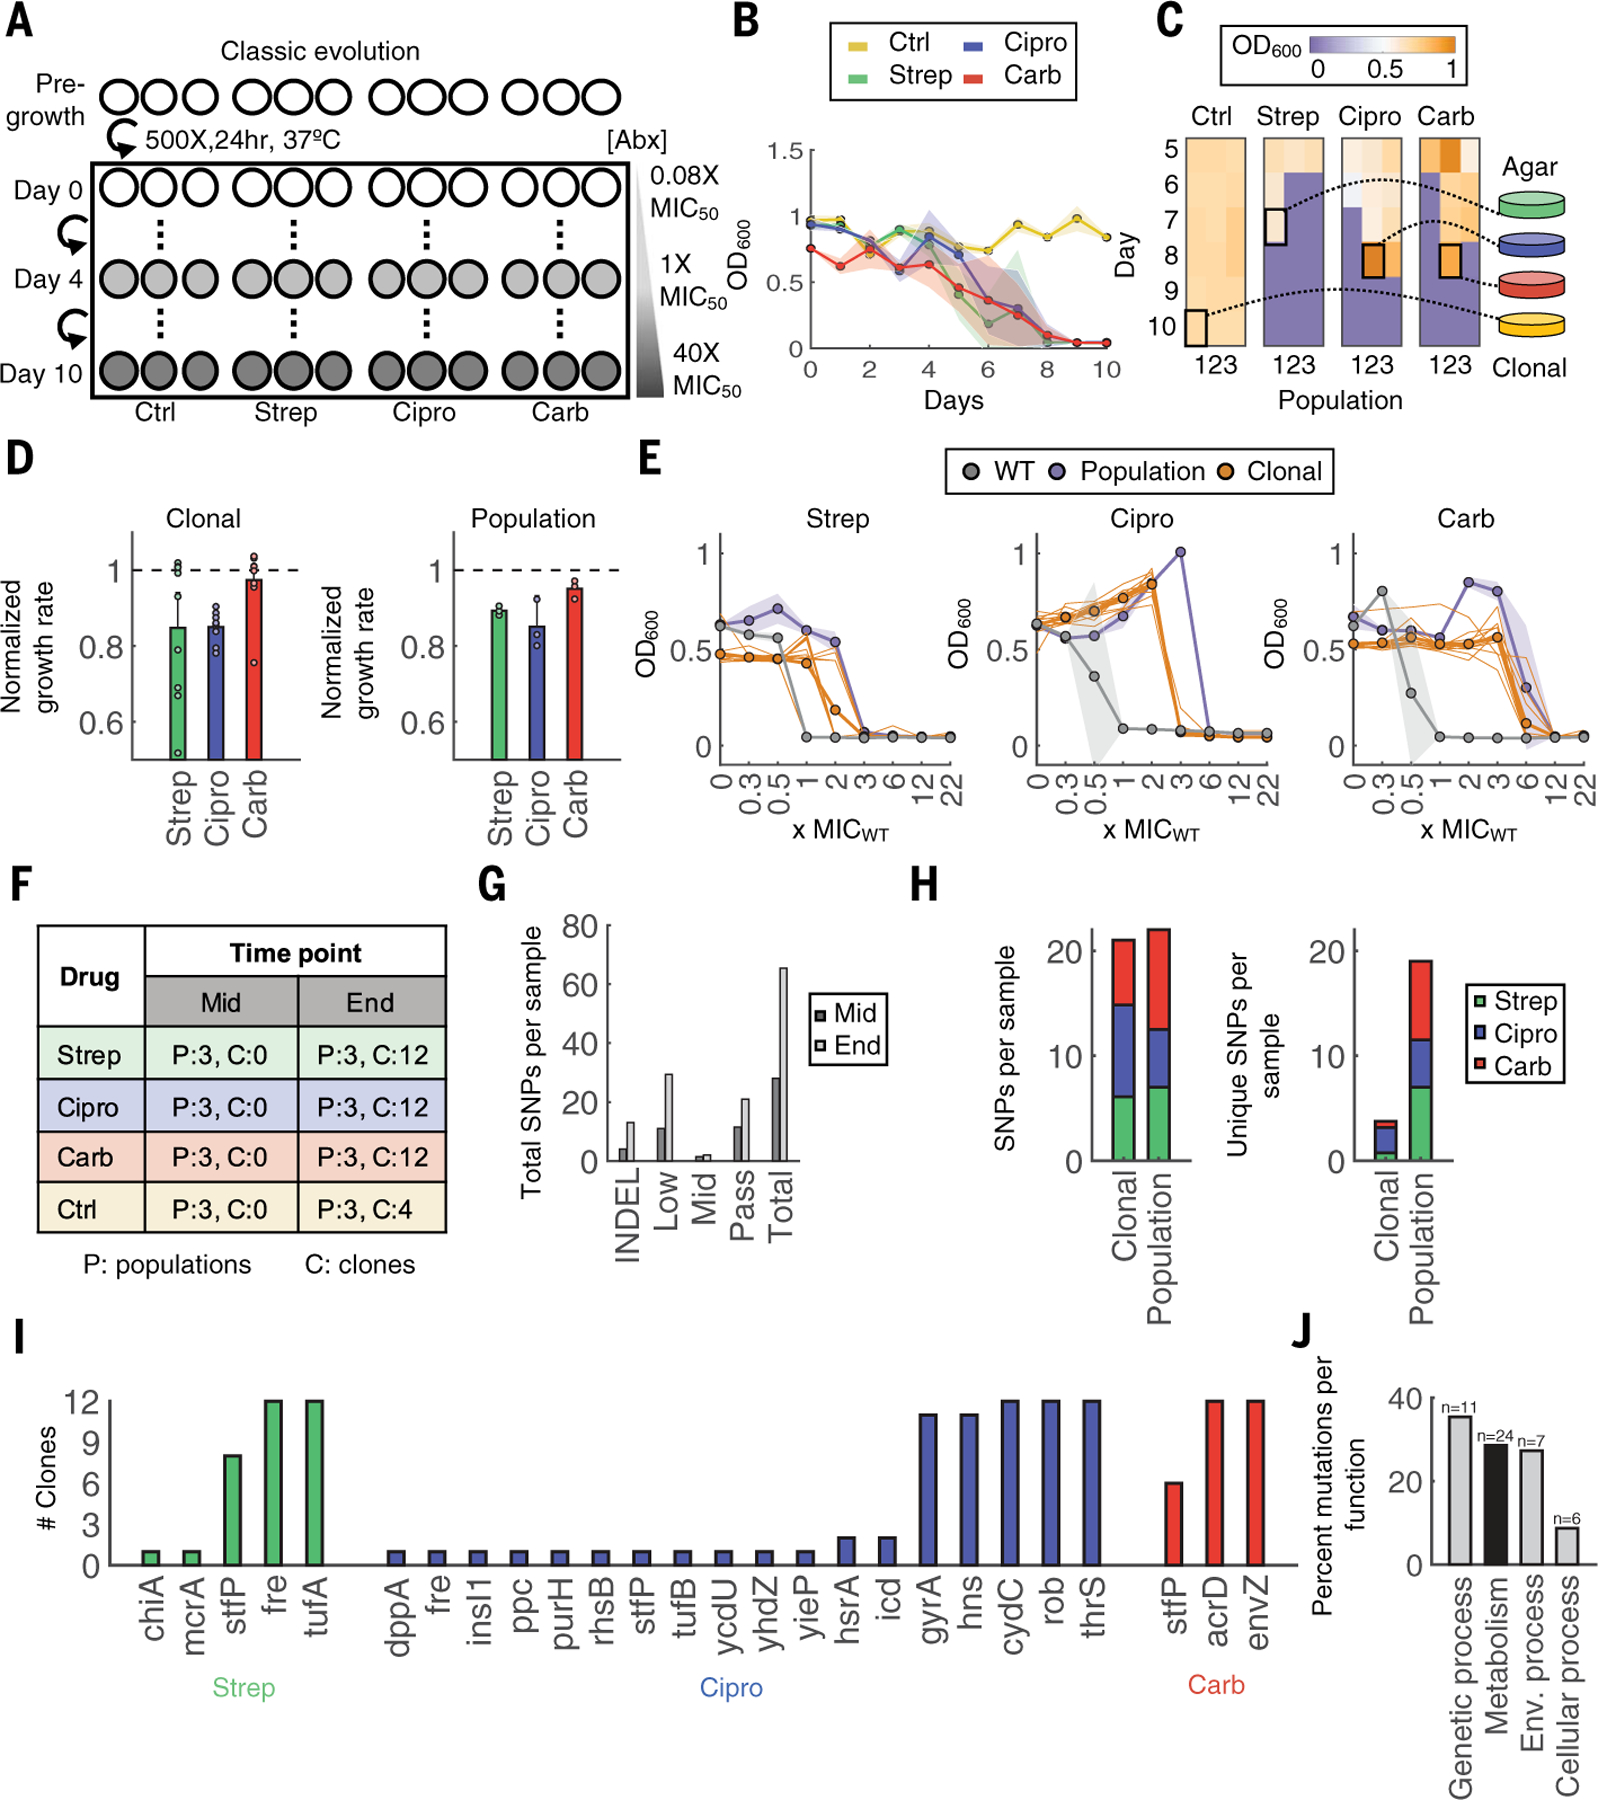
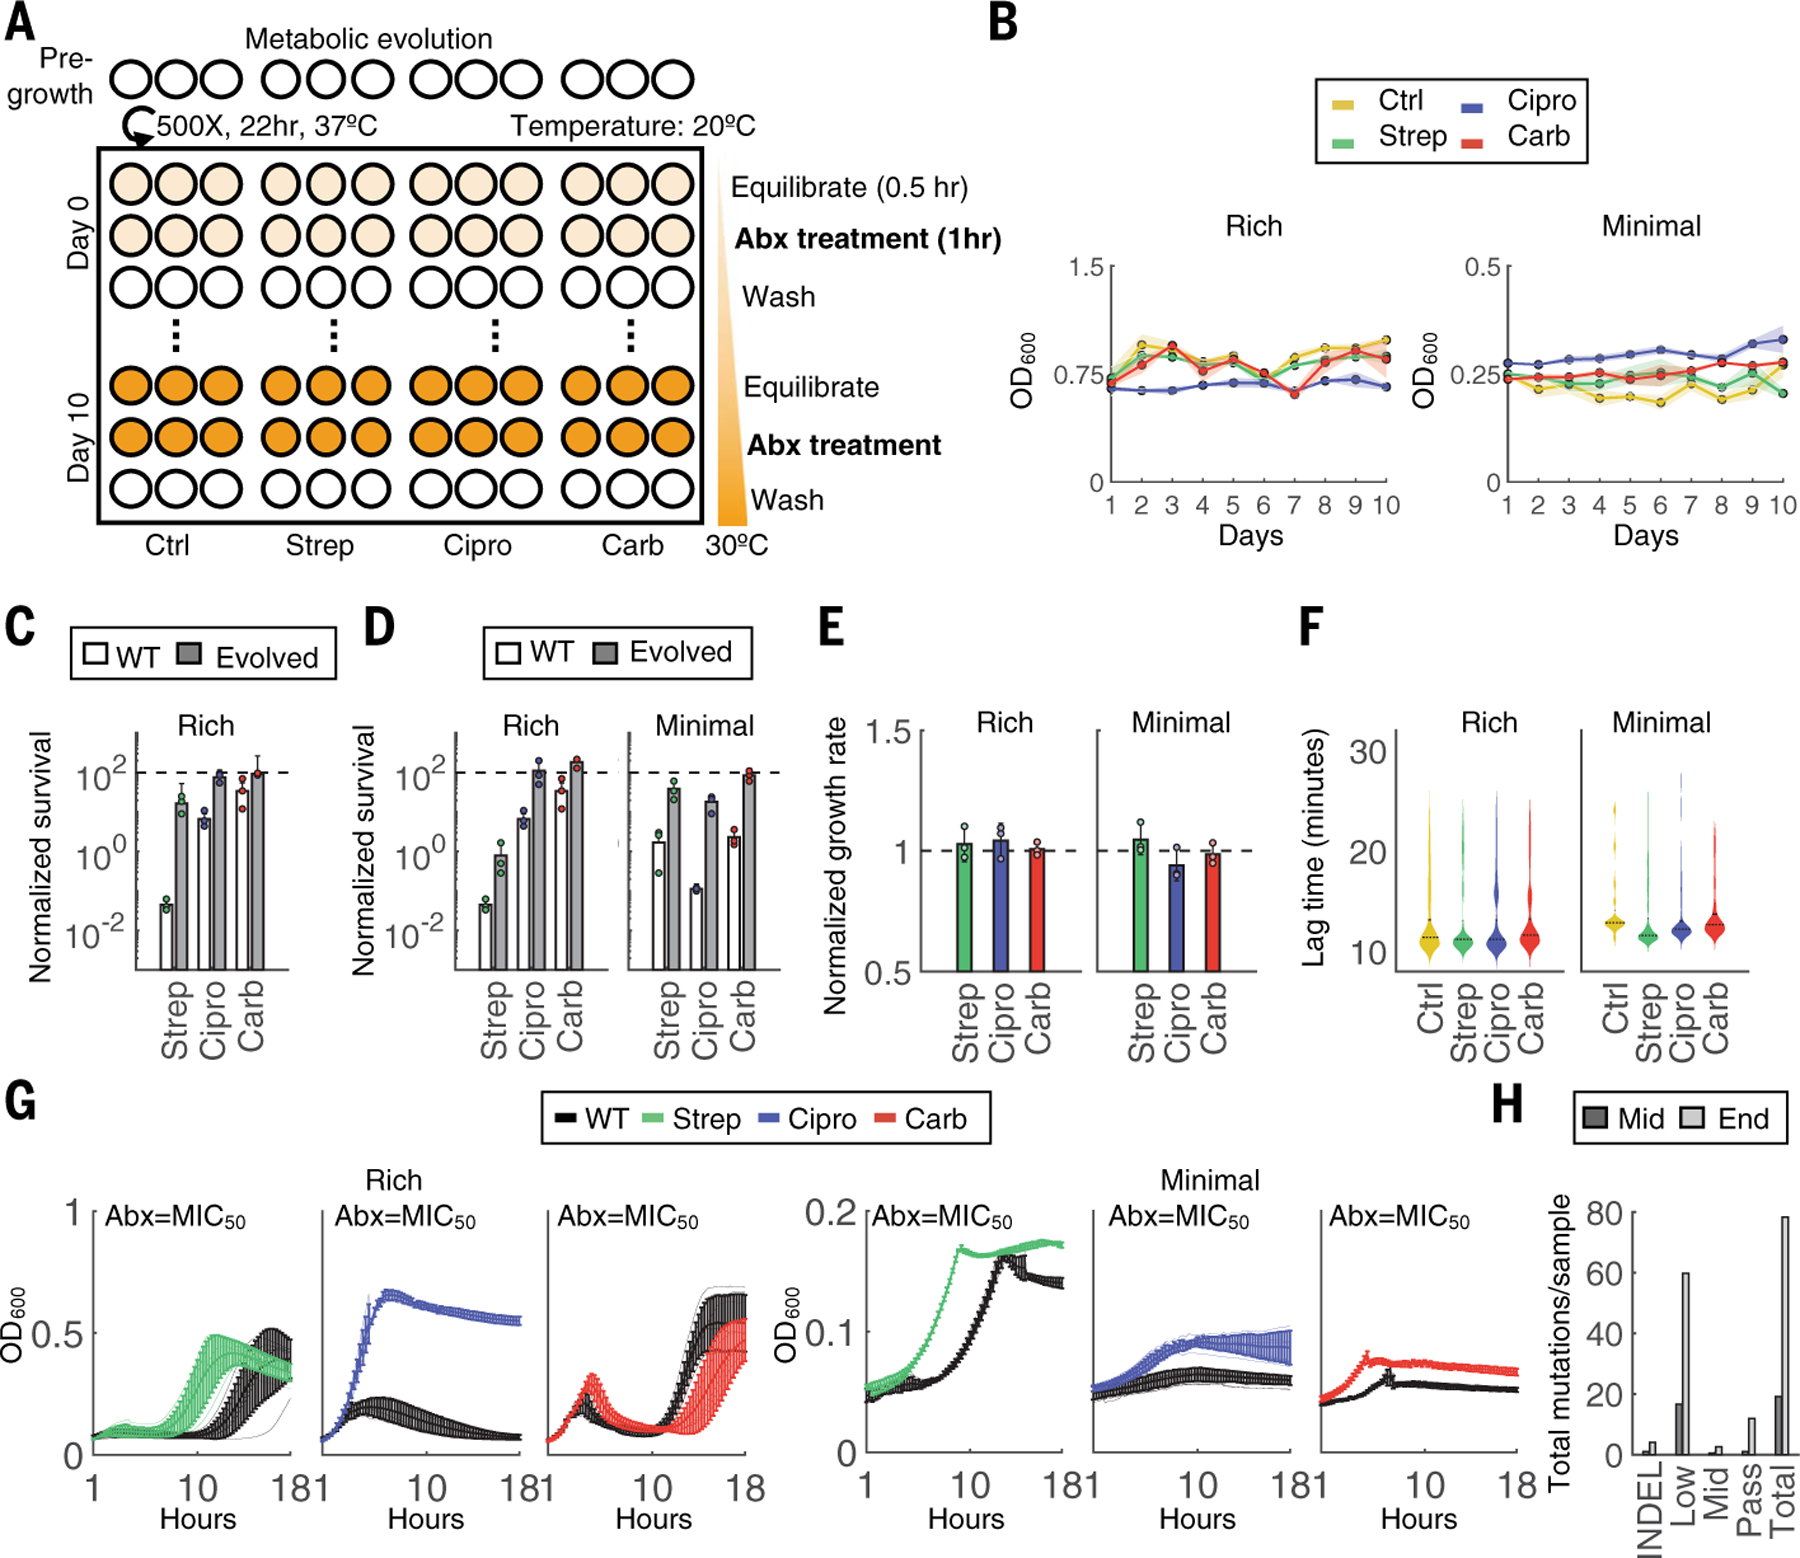
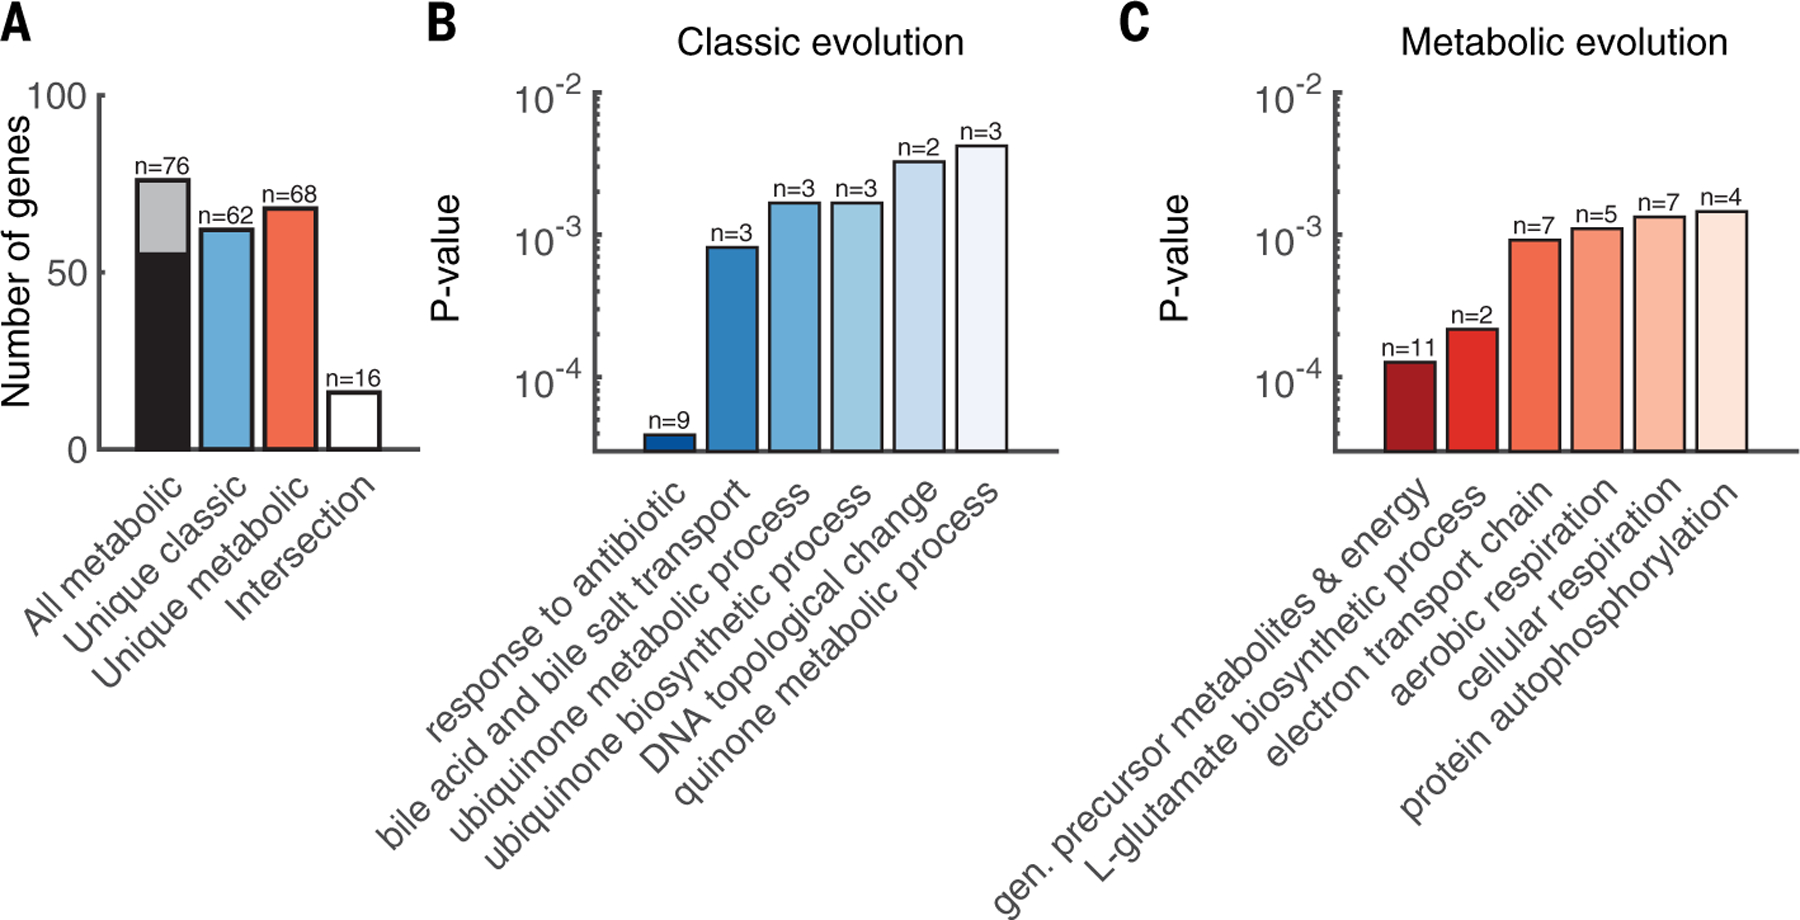
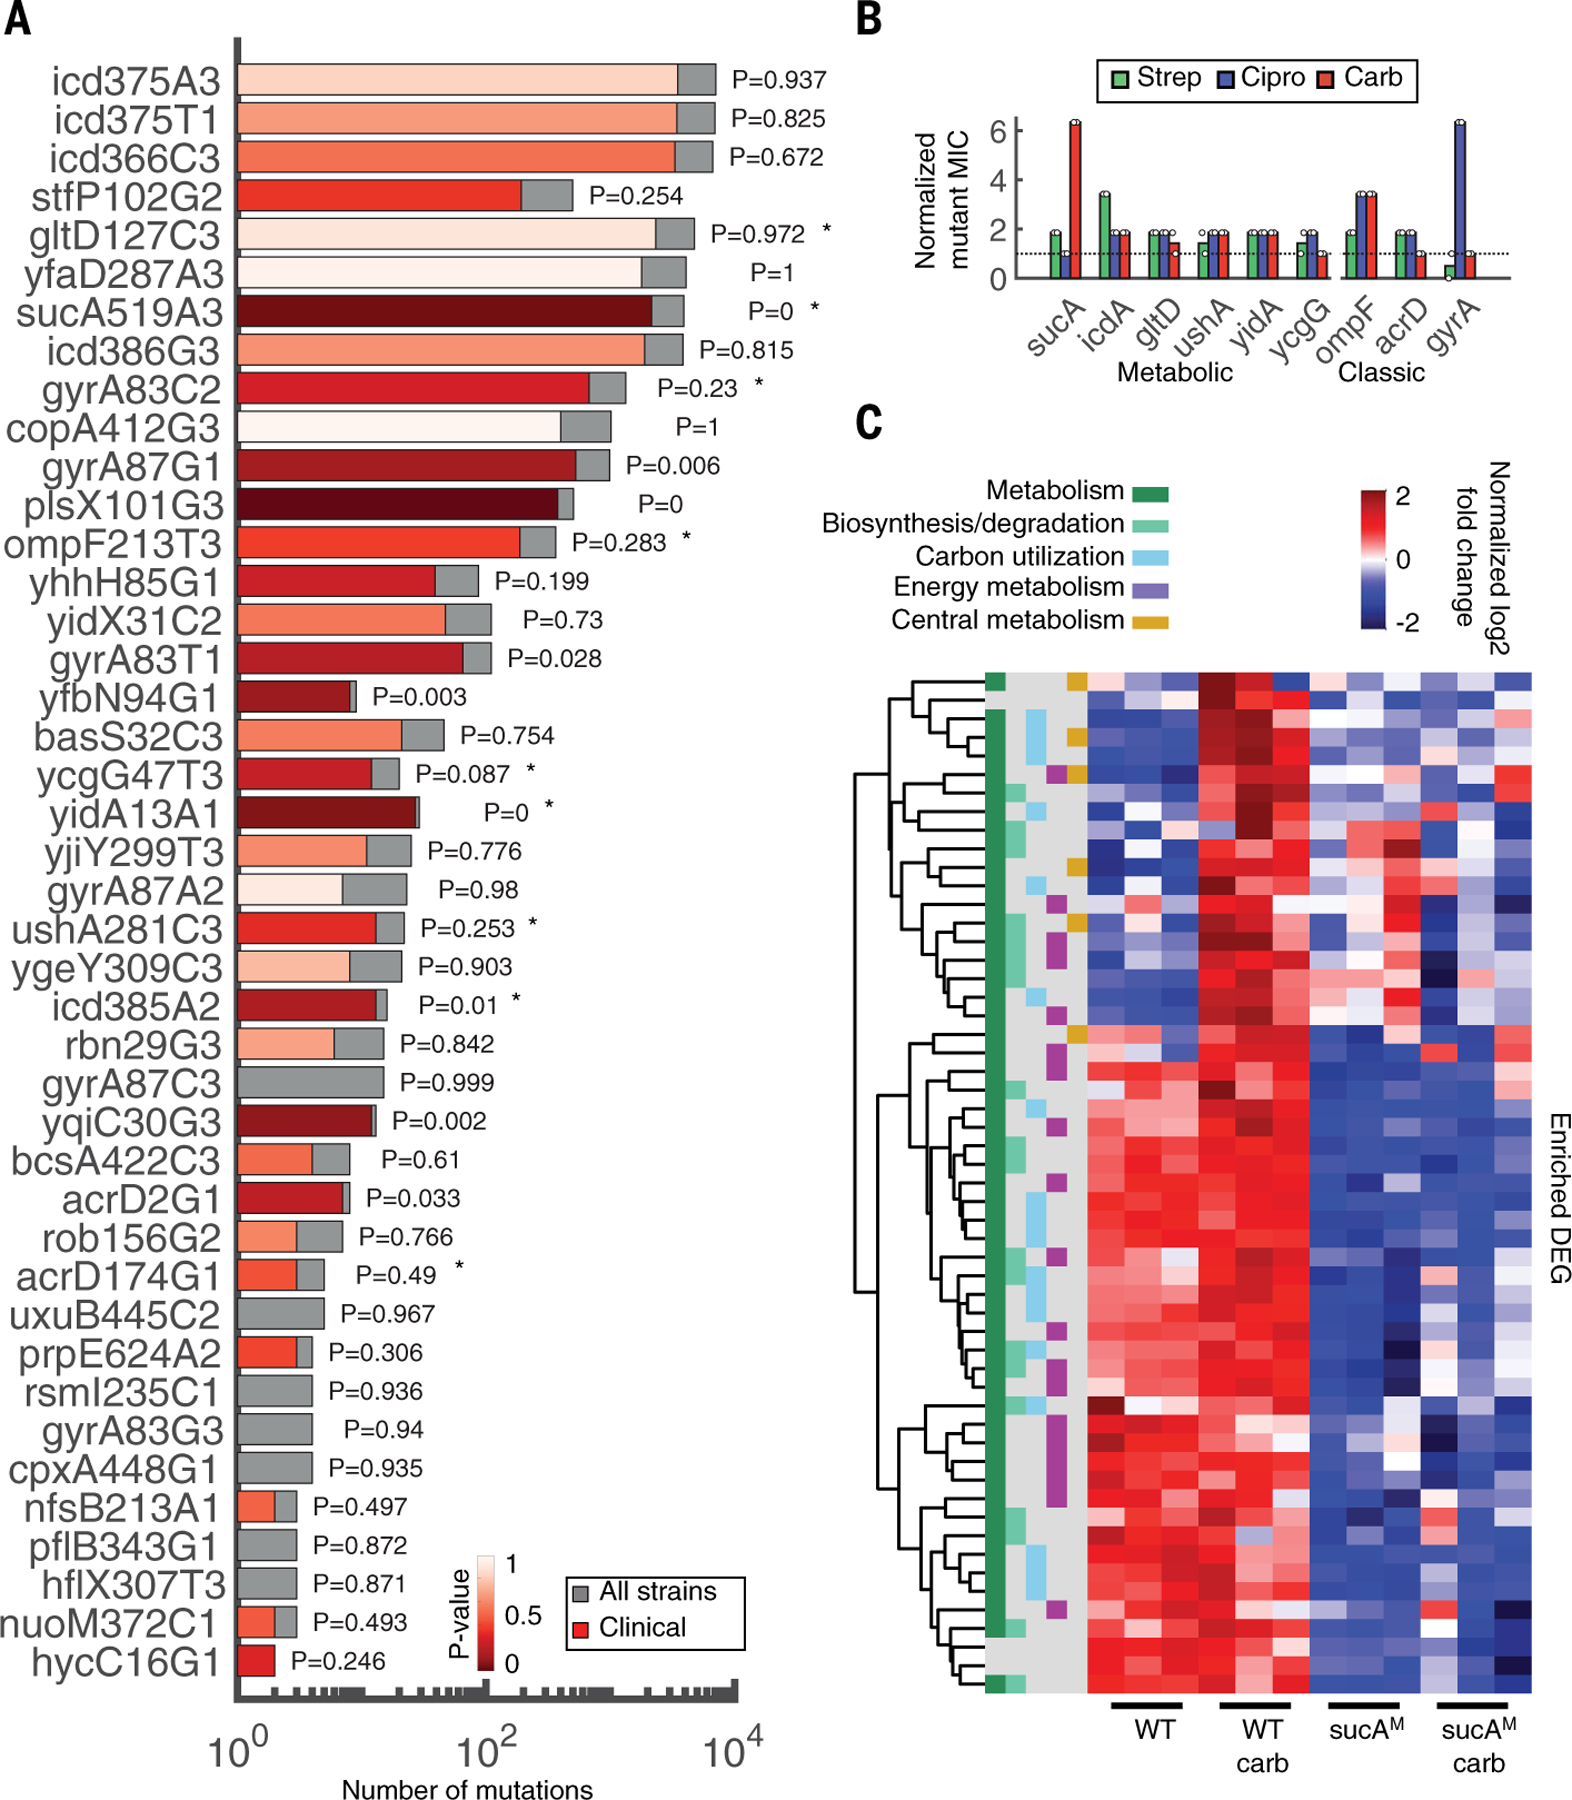
Although metabolism plays an active role in antibiotic lethality, antibiotic resistance is generally associated with drug target modification, enzymatic inactivation, and/or transport rather than metabolic processes. Evolution experiments of Escherichia coli rely on growth-dependent selection, which may provide a limited view of the antibiotic resistance landscape. We sequenced and analyzed E. coli adapted to representative antibiotics at increasingly heightened metabolic states. This revealed various underappreciated noncanonical genes, such as those related to central carbon and energy metabolism, which are implicated in antibiotic resistance. These metabolic alterations lead to lower basal respiration, which prevents antibiotic-mediated induction of tricarboxylic acid cycle activity, thus avoiding metabolic toxicity and minimizing drug lethality. Several of the identified metabolism-specific mutations are overrepresented in the genomes of >3500 clinical E. coli pathogens, indicating clinical relevance.


Conflict of interest statement

Competing interests: J.J.C. is scientific cofounder and scientific advisory board chair of EnBiotix, an antibiotic drug discovery company. The remaining authors declare no conflicting interests.

Figures

Fig. 1.
Fig. 1.. Classic evolution schematic and characterization.
(A) Evolution schematic. Triplicate populations were treated with no antibiotic, strep, carb, or Cipro at increasing concentrations from 0.08× to 40× MIC50 over 11 days (days 0 to 10). (B) Daily OD600 measurements. Shaded color represents SD of three population replicates. The colors yellow, green, blue, and red indicate control, strep, Cipro, and carb, respectively. (C) Frozen samples of all populations starting on day 5 until day 10 were revived in drug-free medium to identify the terminal population per condition (highlighted square). Heatmap shading from purple to orange indicates OD600 levels from low to high, respectively. (D) Growth rates of 12 individual clones (left) or whole populations (right). Growth rates were normalized to the average growth rate of the untreated control (dashed black line for reference). Bars represent average of either 12 clones (left) or three biological replicates (right), and error bars indicate SD. (E) MICs of clones and populations. Bolded gray, orange, and purple lines indicate averages of three WT strain replicates, 12 clones, or three terminal population replicates, respectively. The 12 individual clones are shown in thin orange lines, and shading indicates the SD for WT and population samples. (F) Sequencing sample overview. Each number corresponds to the number of samples sequenced for population (P) or clonal (C) samples. (G) Mutations summary. Mutations include indels and SNPs at frequencies determined by Pilon (passing >~90%; midlevel ~25 to 90%; low ~0.2 to 25%). SNPs per sample are summed across all samples at each time point. (H) Total SNPs per population compared with clonal samples (left). Unique SNPs per population compared with clonal samples (right). (I) Passing SNPs per gene in sequenced clones. (J) KEGG Orthology and BRITE hierarchy classification for broad functional categories; n is the number of genes per category, and the y-axis is the percentage of all genes grouped into the corresponding category.
Fig. 2.
Fig. 2.. Metabolic evolution leads to acquired resistance with no obvious growth defect.
(A) Evolution schematic. Triplicate populations were treated with no antibiotic, strep, carb, or Cipro for a total of 11 days at 40× MIC50 for 1 hour at increasing metabolic states. Thirty minutes before antibiotic treatment, cells were equilibrated to a temperature that increased daily in 1°C increments beginning on day 0 at 20°C and concluding on day 10 at 30°C. After antibiotic treatment, cells were washed 2× in PBS and grown analogously to the classic evolution. (B) OD600 measurements were obtained before daily dilutions and are shown for both rich medium (left) and minimal medium with 0.04% glucose (right) conditions. (C) Survival over the 1-hour treatment for the WT compared with terminal populations evolved through the classic evolution protocol. All experiments were performed at 30°C. Bars represent average of three biological replicates, and error bars indicate SD. (D) Survival over the 1-hour treatment for the WT compared with terminal populations evolved through the metabolic evolution protocol for rich medium (left) and minimal medium (right) conditions. All experiments were performed at 30°C. Bars represent average of three biological replicates, and error bars indicate SD. (E) Growth rates of each terminal population from rich medium (left) and minimal medium (right) conditions. One population per treatment group was tested in three independent biological replicates. Results are normalized to the untreated control (black dashed line). Bars represent the average of three biological replicates, and error bars indicate SD. (F) Lag times of individual clones evolved in either rich medium (left) or minimal medium (right). Lag times were calculated analogously to ScanLag. At least 65 clones were measured for each condition. Violin plots are shown for each distribution; black dotted line indicates the median, and solid line is the mean of the samples. (G) Growth rates for populations evolved in either rich medium (left) or minimal medium (right). OD600 (y-axis) is shown over time in hours (x-axis) obtained at intervals of 15 min for 18 hours. Lines are the average of three biological replicates, and error bars are the SD. Black lines are the WT strain. (H) Mutations summary. Mutations include indels and SNPs at frequencies determined by Pilon (passing >~90%; midlevel ~25 to 90%; low ~0.2 to 25%). SNPs per sample are summed across all samples at each time point.
Fig. 3.
Fig. 3.. Gene Ontology (GO) enrichment analysis differs between evolutions.
(A) Pooling metabolic mutations across medium type yielded an equivalent number of unique mutations from both evolutions. Black and gray color represents genes from rich and minimal (min) medium, respectively. (B) GO enrichment of biological processes for all unique mutations from the classic evolution. (C) GO enrichment of biological processes for all unique mutations from the metabolic evolution. Dark to light shading indicates P values from low to high, respectively.
Fig. 4.
Fig. 4.. Metabolic mutations are highly prevalent in clinical E. coli genomes and confer resistance.
(A) Mutations in coding sequences were searched for in a database of 7243 genomes downloaded from NCBI. Bars indicate the number of strains with the specific mutation from our dataset (gray, total number; red, clinical strains). The significance and P values of the overrepresentation of each mutation within the subset of clinical strains is colored in varying degrees of red, from highly to not significant (dark to light red, respectively). Stars denote mutations tested in (B). The y-axis labels consist of gene name, codon position, reference allele, and nucleotide position, respectively. (B) MIC fold change of mutants compared with WT. Mutant sequences of a representative subset of metabolic (sucA, icd, gltD, ushA, yidA, and ycgG) and classic (ompF, acrD, and gyrA) genes were integrated onto the plasmid pAB downstream of the strong constitutive promoter proD. Each plasmid was introduced into the corresponding knockout strain, except for gyrA, which was introduced into the WT strain BW25113 because this gene is essential, and ycgG, which is compared with the knockout strain only because this mutation disrupted the gene. Control strain is BW25113 carrying pAB191 (black dashed line). Two biological replicates are represented by the circles; bars represent the average of both. MICs for all three drugs (strep, Cipro, and carb; green, blue, and red, respectively) were obtained after 10 hours. (C) Hierarchical clustering of DEGs in the presence and absence of carb treatment. All down-regulated DEGs between carb-treated WT and sucAM were enriched for overrepresented pathways in Ecocyc. Read counts were converted into counts per million (CPM). Heatmap color represents the log-2–transformed, trimmed mean of M values (TMM)–normalized CPM values. Functional categories are defined from MultiFun ontologies from Ecocyc. The y-axis includes all genes that were significantly enriched. The ordered list of genes can be found in table S14.

Comment in

References

    1. Giedraitienė A, Vitkauskienė A, Naginienė R, Pavilonis A, Antibiotic resistance mechanisms of clinically important bacteria. Medicina (Kaunas) 47, 137–146 (2011). - PubMed
    1. Espedido BA, Gosbell IB, Chromosomal mutations involved in antibiotic resistance in Staphylococcus aureus. Front. Biosci. (Schol. Ed.) 4, 900–915 (2012). - PubMed
    1. Yang JH, Bening SC, Collins JJ, Antibiotic efficacy-context matters. Curr. Opin. Microbiol 39, 73–80 (2017). doi: 10.1016/j.mib.2017.09.002 - DOI - PMC - PubMed
    1. Stokes JM, Lopatkin AJ, Lobritz MA, Collins JJ, Bacterial metabolism and antibiotic efficacy. Cell Metab 30, 251–259 (2019). doi: 10.1016/j.cmet.2019.06.009 - DOI - PMC - PubMed
    1. Dwyer DJ et al., Antibiotics induce redox-related physiological alterations as part of their lethality. Proc. Natl. Acad. Sci. U.S.A 111, E2100–E2109 (2014). doi: 10.1073/pnas.1401876111 - DOI - PMC - PubMed

Publication types

MeSH terms