. 2021 Mar 26;371(6536):1374-1378.
doi: 10.1126/science.abf1611. Epub 2021 Feb 18.

SARS-CoV-2 Mpro inhibitors with antiviral activity in a transgenic mouse model

Affiliations

SARS-CoV-2 Mpro inhibitors with antiviral activity in a transgenic mouse model

Jingxin Qiao et al. Science. .

Abstract

The COVID-19 pandemic caused by severe acute respiratory syndrome coronavirus 2 (SARS-CoV-2) continually poses serious threats to global public health. The main protease (Mpro) of SARS-CoV-2 plays a central role in viral replication. We designed and synthesized 32 new bicycloproline-containing Mpro inhibitors derived from either boceprevir or telaprevir, both of which are approved antivirals. All compounds inhibited SARS-CoV-2 Mpro activity in vitro, with 50% inhibitory concentration values ranging from 7.6 to 748.5 nM. The cocrystal structure of Mpro in complex with MI-23, one of the most potent compounds, revealed its interaction mode. Two compounds (MI-09 and MI-30) showed excellent antiviral activity in cell-based assays. In a transgenic mouse model of SARS-CoV-2 infection, oral or intraperitoneal treatment with MI-09 or MI-30 significantly reduced lung viral loads and lung lesions. Both also displayed good pharmacokinetic properties and safety in rats.


Figures

Fig. 1
Fig. 1. Schematic diagram of the design of novel SARS-CoV-2 Mpro inhibitors.
Fig. 2
Fig. 2. Overall structure of SARS-CoV-2 Mpro–MI-23 complex.
(A) Cartoon view of the Mpro dimer (molecule A, cyan; molecule B, purple). Three domains (I, II, and III) of each monomer are marked. The catalytic dyad Cys145-His41 is located in the cleft between domains I and II. MI-23 in both molecules is shown in purple or orange. The N and C termini of each Mpro are labeled. Labels for molecule B are in italics. (B) The chemical structure of MI-23. (C) The MI-23 binding pocket of Mpro. FoFc density map (gray mesh, σ = 2.5) is shown for MI-23 (purple). Cys145 and His41 are shown in yellow and blue, respectively. The covalent bond is formed by Cys145 and the warhead aldehyde. FoFc density map (σ = 2.5) is shown in gray. (D) Interactions between Mpro and MI-23; the hydrogen bonds between them are shown as black dashed lines. Ser1 from molecule B interacts with Glu166 and Phe140 in molecule A (red dashed lines) to support S1 pocket formation. The warhead carbon is marked with a black asterisk in (B), (C), and (D). Images in (A), (C), and (D) were prepared using PyMOL (https://pymol.org).
Fig. 3
Fig. 3. Antiviral activity of six compounds against SARS-CoV-2 in cell-based assays.
(A) Vero E6 cells were infected with SARS-CoV-2 at a multiplicity of infection (MOI) of 0.1 and treated with different concentrations of test compounds (MI-09, MI-12, MI-14, MI-28, MI-30, and MI-31). At 3 dpi, the cytopathic effect caused by SARS-CoV-2 infection was quantitatively analyzed using CCK8 according to the manufacturer’s protocol. Data are means ± SD; n = 3 biological replicates. (B) HPAEpiC cells were infected with SARS-CoV-2 at an MOI of 0.01 and treated with different concentrations of test compounds (MI-09, MI-12, MI-14, MI-28, MI-30, and MI-31). At 2 dpi, viral RNA copies (per ml) were quantified from cell culture supernatants by RT-qPCR. Data are means ± SD; n = 2 biological replicates.
Fig. 4
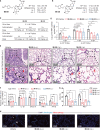
Fig. 4. MI-09 and MI-30 reduce lung viral loads and lung lesions in a SARS-CoV-2 infection transgenic mouse model.
(A and B) Chemical structures and summary of in vitro activity data and bioavailability of MI-09 and MI-30. (C) Overview of in vivo study design. (D) Viral loads in the lungs of SARS-CoV-2–infected hACE2 transgenic mice. Mice infected with the indicated dose of SARS-CoV-2 were treated with MI-09, MI-30, or vehicle solution, and then were killed at 1 or 3 dpi. Five lung lobes of each mouse were collected to determine viral loads. Data (means ± SD) represent the median of five lung lobes of individual mice. The horizontal dotted line shows the viral load limit of detection (LOD) of 1.0 log10 RNA copies. Data below the LOD are shown at the LOD. *P < 0.05, **P < 0.01 (two-tailed unpaired Student’s t test). (E) Representative images of lung histopathological changes from SARS-CoV-2–infected hACE2 mice (5 × 10⁶ TCID50) at 3 dpi. Magnified views of the boxed regions for each image are shown below. Black arrows indicate alveolar septal thickening; red arrows point to inflammatory cell infiltration. See fig. S4 for whole-lung tissue scan images of SARS-CoV-2–infected hACE2 mice at 3 dpi. (F) Representative chemokine and cytokine assessment of the lung tissues (n = 3) of the indicated groups, as detected in lung tissue homogenate at 3 dpi. Data are means ± SD. *P < 0.05, **P < 0.01 versus the vehicle group (one-way analysis of variance). (G and H) Infiltration analysis for neutrophils and macrophages in the lungs of SARS-CoV-2–infected hACE2 mice (5 × 10⁶ TCID50) at 3 dpi. (G) Percentages of macrophages and neutrophils in the lungs. *P < 0.05, **P < 0.01 (unpaired Student’s t test). (H) Representative images of fluorescence staining. White triangle and arrow indicate macrophage and neutrophil, respectively.

Comment in

References

    1. Zhou P., Yang X.-L., Wang X.-G., Hu B., Zhang L., Zhang W., Si H.-R., Zhu Y., Li B., Huang C.-L., Chen H.-D., Chen J., Luo Y., Guo H., Jiang R.-D., Liu M.-Q., Chen Y., Shen X.-R., Wang X., Zheng X.-S., Zhao K., Chen Q.-J., Deng F., Liu L.-L., Yan B., Zhan F.-X., Wang Y.-Y., Xiao G.-F., Shi Z.-L., A pneumonia outbreak associated with a new coronavirus of probable bat origin. Nature 579, 270–273 (2020). 10.1038/s41586-020-2012-7 - DOI - PMC - PubMed
    1. Wu F., Zhao S., Yu B., Chen Y.-M., Wang W., Song Z.-G., Hu Y., Tao Z.-W., Tian J.-H., Pei Y.-Y., Yuan M.-L., Zhang Y.-L., Dai F.-H., Liu Y., Wang Q.-M., Zheng J.-J., Xu L., Holmes E. C., Zhang Y.-Z., A new coronavirus associated with human respiratory disease in China. Nature 579, 265–269 (2020). 10.1038/s41586-020-2008-3 - DOI - PMC - PubMed
    1. Coronaviridae Study Group of the International Committee on Taxonomy of Viruses , The species Severe acute respiratory syndrome-related coronavirus: Classifying 2019-nCoV and naming it SARS-CoV-2. Nat. Microbiol. 5, 536–544 (2020). 10.1038/s41564-020-0695-z - DOI - PMC - PubMed
    1. Smith P., Covid-19 in Australia: Most infected health workers in Victoria’s second wave acquired virus at work. BMJ 370, m3350 (2020). 10.1136/bmj.m3350 - DOI - PubMed
    1. Looi M.-K., Covid-19: Is a second wave hitting Europe? BMJ 371, m4113 (2020). 10.1136/bmj.m4113 - DOI - PubMed

Publication types

MeSH terms

Substances