. 2021 Feb 18;12(1):1117.
doi: 10.1038/s41467-021-21300-6.

Patient-derived xenografts and organoids model therapy response in prostate cancer

Affiliations

Patient-derived xenografts and organoids model therapy response in prostate cancer

Sofia Karkampouna et al. Nat Commun. .

Abstract

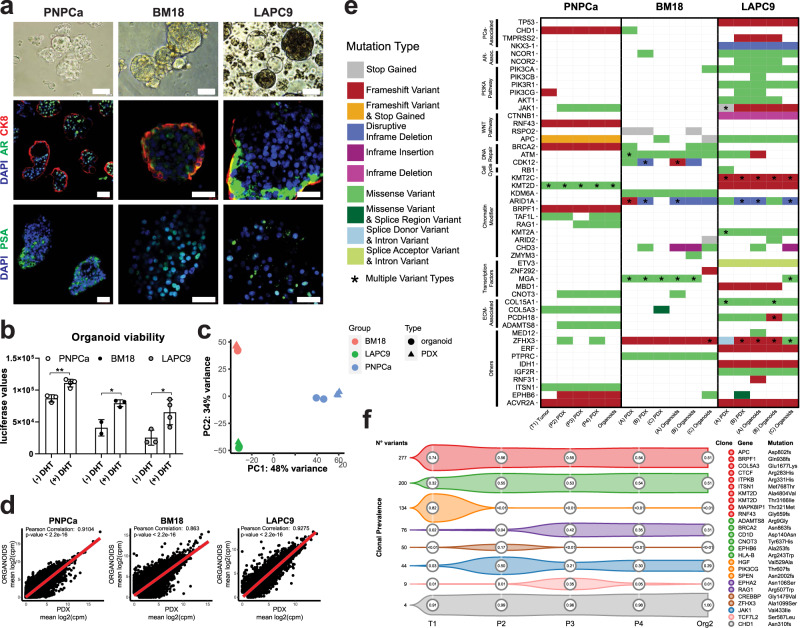
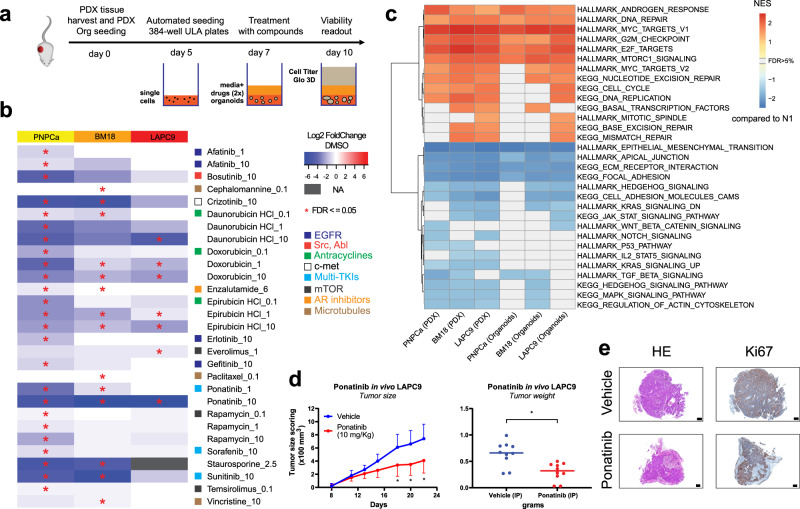
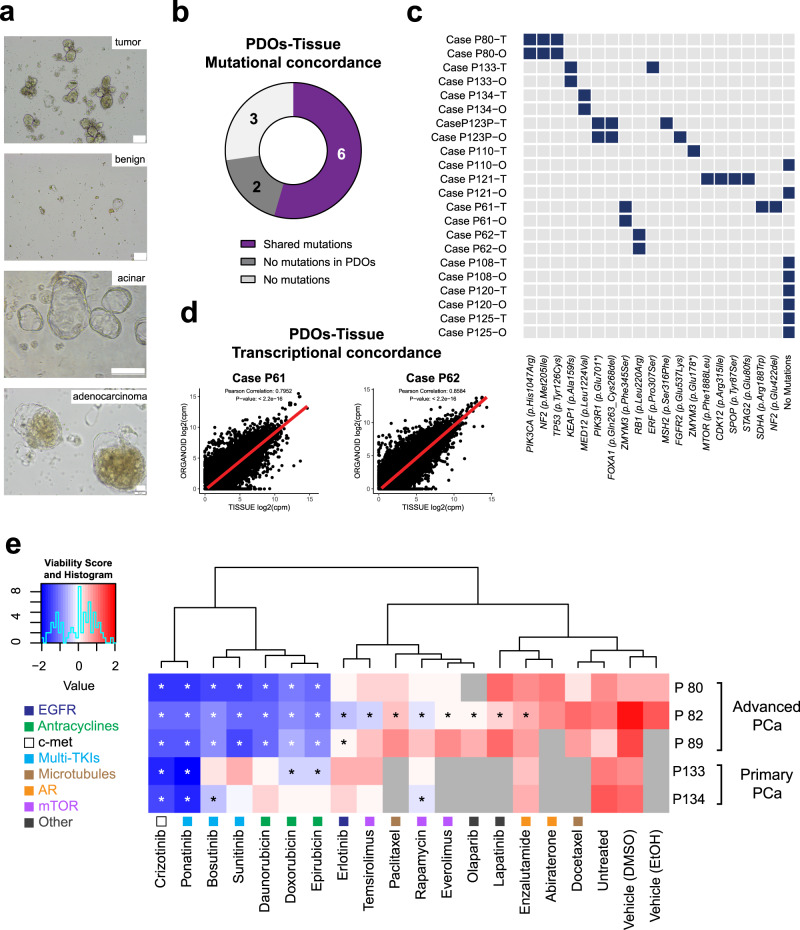
Therapy resistance and metastatic processes in prostate cancer (PCa) remain undefined, due to lack of experimental models that mimic different disease stages. We describe an androgen-dependent PCa patient-derived xenograft (PDX) model from treatment-naïve, soft tissue metastasis (PNPCa). RNA and whole-exome sequencing of the PDX tissue and organoids confirmed transcriptomic and genomic similarity to primary tumor. PNPCa harbors BRCA2 and CHD1 somatic mutations, shows an SPOP/FOXA1-like transcriptomic signature and microsatellite instability, which occurs in 3% of advanced PCa and has never been modeled in vivo. Comparison of the treatment-naïve PNPCa with additional metastatic PDXs (BM18, LAPC9), in a medium-throughput organoid screen of FDA-approved compounds, revealed differential drug sensitivities. Multikinase inhibitors (ponatinib, sunitinib, sorafenib) were broadly effective on all PDX- and patient-derived organoids from advanced cases with acquired resistance to standard-of-care compounds. This proof-of-principle study may provide a preclinical tool to screen drug responses to standard-of-care and newly identified, repurposed compounds.


Conflict of interest statement

The authors declare no competing interests.

Figures

Fig. 1
Fig. 1. Establishment of a novel androgen dependent, patient-derived xenograft from an early, treatment-naïve prostate cancer metastasis.
a Scheme of clinical history and patient-derived samples: primary tumor TUR-P (T1) and penile metastasis needle biopsies used to establish the PDX model (PNPCa) and subsequent passages. Created with BioRender.com. b Histological morphology of primary TURP tumor, penile metastasis (PN met) from PCa and the PDX passages 1 and 6 (PDX1, PDX6) derived from the metastasis needle biopsy implantation (PNPCa), as assessed by Hematoxylin and Eosin staining (H&E). Scale bars 20 μm. Top to bottom panels: PSA protein expression. Scale bars 20 μm. Expression of AR (green), CK5 (red) assessed by immunofluorescence, DAPI (blue) marks the nuclei. Scale bars 50 μm. Expression of NKX3.1 (green), CK8 (red) assessed by immunofluorescence. Scale bars 50 μm. c Flow cytometry analysis of epithelial and prostate-specific marker expression in PNPCa PDX tissue. FcR-blocked PNPCa cells were stained with antibodies against CD44, E-Cadherin, PSMA, CD49f, CD36, and CD146. d PDX tumor growth progression in time. Groups; 1. Intact tumors (collected at max size, N = 2 independent animals), 2. Castrated (N = 5 independent animals), 3. Castrated followed by Testosterone re-administration (Castrated-Testosterone independent animals) starting on day 189 (N = 4, N = 3 from day 203 to 252, N = 2 from day 252 to 273). Tumor scoring was performed weekly by routine palpation; values represent average calculation of the tumors of all animals per group (considering N = 2 tumors, left L and right R of each animal). Error bars represent SEM, calculated considering number of animals for each time point. Ordinary two-way ANOVA with Tukey’s multiple comparison correction was performed. (*) p = 0.0105 day 217, (**) p = 0.0025 day 224, (***) p = 0.0005 day 231, (****) p ≤ 0.0001 from day 238 onwards. e Top to bottom panels: Histological H&E staining of representative tumors from Castrated and Castrated-Testosterone hosts. Immunofluorescence staining for AR and CK5, CK8, NKX3.1 and CK8, CD44, and Ki67. DAPI marks the nuclei. Scale bars 50 μm. f Genomic analysis of PNPCa PDXs from intact and castrated animals, collecting samples at full regression (122 days) and after further testosterone replacement (84 days). g Principal component analysis of the gene expression of the 500 most variable genes. h Gene set enrichment analysis plot of statistically significant (adjusted p-value < 0.05) enrichment of HALLMARK pathways based on the differential expression analysis of the Castrated versus the Intact groups. NES, normalized enrichment score.
Fig. 2
Fig. 2. Mutational landscape of PDX and PDX-derived organoids from PNPCa, and advanced androgen (in) dependent BM18 and LAPC9 models.
a Morphology of PNPCa, BM18, and LAPC9 PDX-derived organoids; brightfield images, whole mount immunofluorescence staining and 3D projection of z-stack of organoids stained for PSA, AR, and CK8. DAPI marks the nuclei. Scale bars 50 μm. b Viability assay of organoids derived from PNPCa, BM18, and LAPC9 tumor tissues and exposed to dihydrotestosterone (±DHT) for 48 h. Luciferase values (ATP release) are proportional to cell viability. Mean ± SD is reported, N = 3,4 technical replicates per condition (PNPCa), N = 2,3 technical replicates per condition (BM18), N = 3,4 technical replicates per condition (LAPC9). Two-tailed t-test, *p = 0.0161, p = 0.0277, **p = 0.0031. c Principal component analysis of the gene expression of the 1000 most variable genes on PNPCa, BM18, and LAPC9 samples (PDX and PDX-derived organoids). d Correlation plots of gene expression between PNPCa PDX tissue (N = 3 biologically independent tumor samples) and organoids (N = 2 biologically independent organoid samples), BM18 PDX tissue (N = 2) and organoids (N = 2), LAPC9 PDX tissue (N = 2) and organoids (N = 2), p-values < 2.2e10−16. e Somatic mutation analysis of WES of tissue and organoids of PNPCa, BM18, and LAPC9 PDX. Columns represent different samples, while rows represent selected genes categorized by pathway. Types of genetic aberrations are indicated in different colors. Multiple types of mutations per gene are indicated with an asterisk. A–C indicate biological replicates. f Clonality analysis of the PNPCa samples shown in e, inferred by PyClone. Only the largest clones (consisting of most variants) or those containing cancer genes are shown. Numbers in circles indicate mean clonal prevalence, estimated for each sample. Mutations in cancer genes corresponding to each clone are reported on the left and color-coded. Overall, most mutations (including those in cancer genes) occur at high prevalence in all samples (top two clones). WES, whole-exome sequencing.
Fig. 3
Fig. 3. Correlation of genomic features and specific drug responses in organoid models.
ac Time course of ATP-mediated luminescence viability assay following a single dose of 10 Gy irradiation on organoids derived from PNPCa (a), LAPC9 (b), and BM18 (c) PDX tumors. Mean ± SD is reported, N = 4 technical replicates (t = 0), N = 5 (for each of the t = 24, 48, 72, 96 h time points). Ordinary two-way ANOVA with Tukey multiple comparison test was performed. ****p < 0.0001. d Graph representing the percentage of contribution of specific mutagenic processes based on mutational signatures from PNPCa T1 (primary tumor), PDX (passages P2-P4) and organoids (from P4 PDX). e MSI status based on MSIsensor algorithm (https://github.com/ding-lab/msisensor), score ≥ 3.5 indicates MSI-high. f PD-L1 IHC staining on positive control (placenta tissue), primary T1 tumor, PNmet needle biopsy, PDX1 and PDX2 of the PNmet, and cytosmear of PDX-organoids. Images of representative areas per tumor sample are shown, relative to the positive control staining. g. Gene expression levels of immune markers based on RT-qPCR results on PNPCa organoids RNA at baseline (black bars) and after 48 h exposure to IFN-γ (red bars). Mean ± SD is reported, for VSIR N = 3, for PD-L1 N = 6, for PD-1, HLA-A, HLA-B N = 5 technical replicates, across two independent experiments. Two-tailed nested t-test. ****p < 0.0001. hj MLR assay showing lymphocyte reactivity, Treg fraction and expression levels of surface PD-1, following coculture of PDX-derived PNPCa organoids with T cells and allogeneic, monocyte-derived dendritic cells (DCs). Mean ± SD is reported, h N ≥ 3 biologically independent samples per condition, N = 2 mDC+ IFN-γ from four independent experiments; Mixed effects analysis (REML) with Geisser–Greenhouse’s correction and Dunnett’s post-hoc test was performed. i N = 3 biologically independent experiments; one-way ANOVA with Dunnett’s correction for multiple comparisons was performed, j N = 2 per condition from two biologically independent experiments. IHC, immunohistochemistry; MLR, mixed lymphocyte reaction.
Fig. 4
Fig. 4. Drug sensitivity of organoids representing different PCa stages and identification of novel compounds for repurposing use, based on medium-throughput organoid screens.
a Scheme of experimental protocol for organoid drug screens. Created with BioRender.com. b Organoid drug screen heatmap of log2 fold change viability values (over vehicle, for each PDX model) for PNPCa (N = 4 replicates), BM18 (N = 3), and LAPC9 (N = 3). Negative log2 values (plotted in blue) indicate potential drug candidates with impact on cell viability. Staurosporine was used as positive control. Statistically significant hits (FDR ≤ 0.05) are indicated with an asterisk. Hits with a significant effect on at least one model are reported, listed in alphabetical order and with effective dose indication on the right, in μM. Medium-throughput automated drug screens, using selected FDA-approved compounds, were performed at Nexus Theragnostics platform. c Gene set enrichment analysis (GSEA) of PDXs tissue (PNPCa N = 3, BM18 N = 2, LAPC9 N = 2) and organoids (PNPCa N = 2, BM18 N = 2, LAPC9 N = 2). Enrichment scores of selected Hallmark and KEGG (C2) pathways with FDR < 0.05 derived from differential expression analysis of each group of samples vs. the non-carcinoma control tissue from PNPCa clinical sample (N1). NES normalized enrichment score. d In vivo efficacy by ponatinib treatment in subcutaneous LAPC9 PDX model. Tumor-bearing mice received intraperitoneally (IP) daily injections of vehicle or ponatinib (10 mg/kg) and mean tumor size scoring (×100 mm3) was plotted. Data are presented as mean ± SD, N = 10 independent tumor samples per treatment group); Two-way ANOVA with Sidak correction. *p = 0.029 (day 18), p = 0.012 (day 20), p = 0.016 (day 22). Tumor weight was assessed at endpoint and plotted as mean ± SD, N = 10 independent tumor samples per group; Two-tailed nested t-test. *p = 0.015. e Representative histology of LAPC9 PDX tumors from the vehicle and ponatinib groups, collected at endpoint. HE, hematoxylin and eosin, Ki67 proliferation marker. Scale bars, 0.5 mm.
Fig. 5
Fig. 5. Patient-derived organoids (PDO) of multiple PCa cases preserve molecular signatures of the matched tissue and can be used to determine drug sensitivity in vitro.
a Representative brightfield images of PDOs from PCa (“tumor”) and from cancer unaffected control area (“benign”) from the same patient (scale bar 100 μm). Representative images of PDOs with an acinar or cystic morphology and with an adenocarcinoma-like morphology (“acinar” (scale bar 500 μm) and “adenocarcinoma” (scale bar 50 μm), respectively). b. Overview of the genetic profiles of N = 11 PCa tissue samples and matching PDOs, determined by targeted sequencing of PCa-specific mutation panels. c Binary heatmap plot of the data presented in b. Rows represent samples (tissue (T) and organoids (O) for each case), columns represent genomic mutations. d Correlation plots of gene expression between tissue and matched organoids for PCa case 61 (left) and case 62 (right). Pearson correlation coefficient, r: 0.795 and 0.858, respectively. For both correlations, p value < 2.2e10−16. e Results of PDO drug screen assay on three advanced PCa cases (P80, P82, P89) and two primary PCa cases (P133 and P134). Normalized viability z scores are shown in the heatmap, with unsupervised hierarchical cluster analysis of the drugs. Asterisks indicate a significant reduction of viability compared to vehicle (*p < 0.05). Statistical significance was determined by two-tailed t-test for abiraterone (vehicle EtOH) and by one-way ANOVA with Dunnett correction for all remaining drugs (vehicle DMSO). Non-determined values are indicated in gray squares. Drug targets are indicated in the legend and reported by a colored-coded square below each drug.

References

    1. Ferlay J, et al. Cancer incidence and mortality patterns in Europe: estimates for 40 countries and 25 major cancers in 2018. Eur. J. Cancer. 2018;103:356–387. - PubMed
    1. Beer TM, et al. Enzalutamide in metastatic prostate cancer before chemotherapy. N. Engl. J. Med. 2014;371:424–433. doi: 10.1056/NEJMoa1405095. - DOI - PMC - PubMed
    1. de Bono JS, et al. Abiraterone and increased survival in metastatic prostate cancer. N. Engl. J. Med. 2011;364:1995–2005. doi: 10.1056/NEJMoa1014618. - DOI - PMC - PubMed
    1. Byrne AT, et al. Interrogating open issues in cancer precision medicine with patient-derived xenografts. Nat. Rev. Cancer. 2017;17:254–268. doi: 10.1038/nrc.2016.140. - DOI - PubMed
    1. Wang Y, et al. Development and characterization of efficient xenograft models for benign and malignant human prostate tissue. Prostate. 2005;64:149–159. doi: 10.1002/pros.20225. - DOI - PubMed

Publication types

LinkOut - more resources