Observational Study
. 2021 Feb 18;12(1):1112.
doi: 10.1038/s41467-021-21310-4.

Interleukin-3 is a predictive marker for severity and outcome during SARS-CoV-2 infections

Affiliations
Observational Study

Interleukin-3 is a predictive marker for severity and outcome during SARS-CoV-2 infections

Alan Bénard et al. Nat Commun. .

Abstract

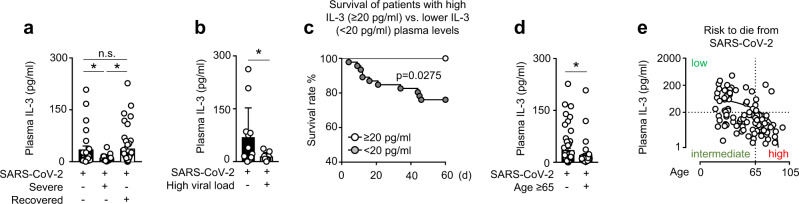
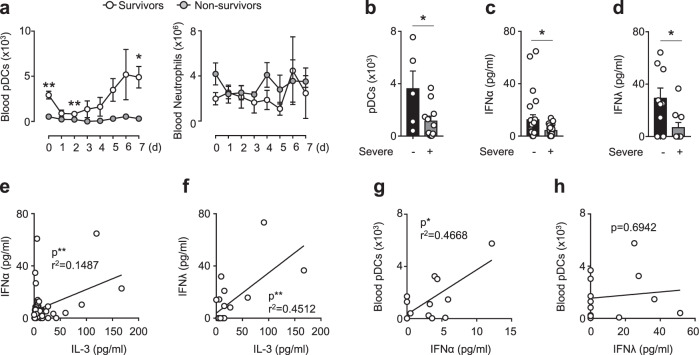
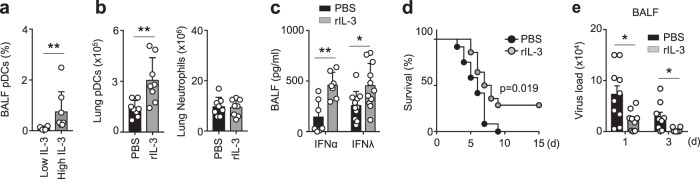
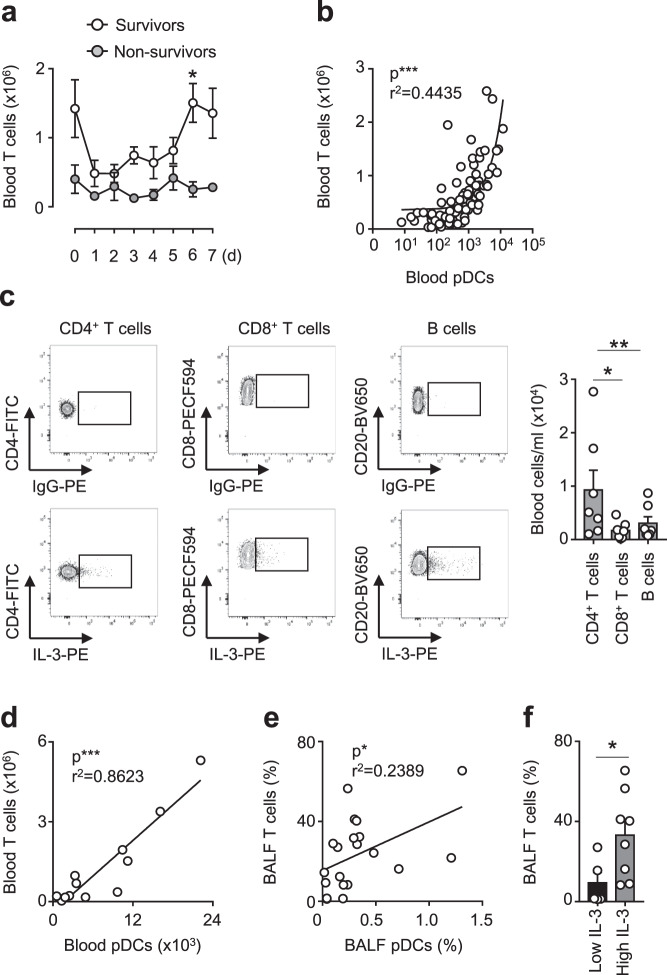
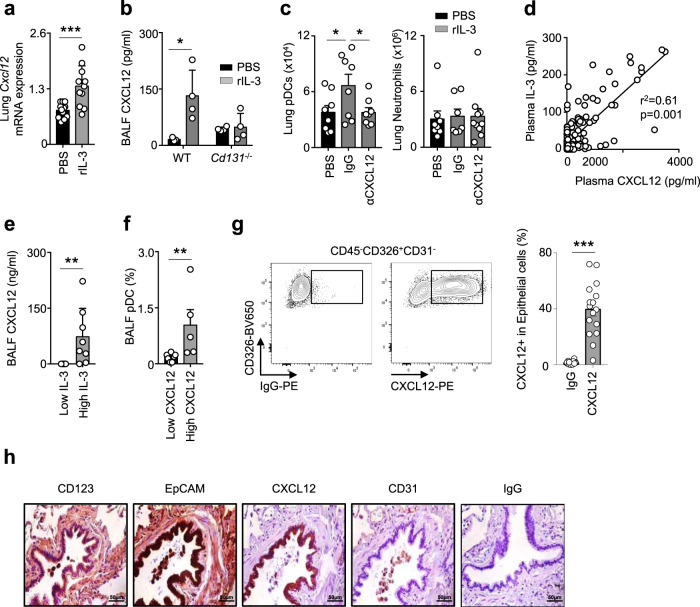
Severe acute respiratory syndrome coronavirus 2 (SARS-CoV-2) is a worldwide health threat. In a prospective multicentric study, we identify IL-3 as an independent prognostic marker for the outcome during SARS-CoV-2 infections. Specifically, low plasma IL-3 levels is associated with increased severity, viral load, and mortality during SARS-CoV-2 infections. Patients with severe COVID-19 exhibit also reduced circulating plasmacytoid dendritic cells (pDCs) and low plasma IFNα and IFNλ levels when compared to non-severe COVID-19 patients. In a mouse model of pulmonary HSV-1 infection, treatment with recombinant IL-3 reduces viral load and mortality. Mechanistically, IL-3 increases innate antiviral immunity by promoting the recruitment of circulating pDCs into the airways by stimulating CXCL12 secretion from pulmonary CD123+ epithelial cells, both, in mice and in COVID-19 negative patients exhibiting pulmonary diseases. This study identifies IL-3 as a predictive disease marker for SARS-CoV-2 infections and as a potential therapeutic target for pulmunory viral infections.


Conflict of interest statement

The authors declare no competing interests.

Figures

Fig. 1
Fig. 1. Low plasma interleukin-3 levels are associated with severity and outcome in COVID-19.
a Plasma IL-3 levels of SARS-CoV-2+ patients with or without severe disease and in patients that had recovered from infection. p = 0.0468 for non-severe vs severe; p = 0.0016 for severe vs recovered; and p = 0.8441 for non-severe vs recovered. n = 92. b Plasma IL-3 levels of SARS-CoV-2+ patients with or without high viral load. n = 21. c Kaplan–Meier analysis showing the survival of SARS-CoV-2+ patients with high (≥20 pg/ml) or low (<20 pg/ml) plasma IL-3 levels (measured within 24 h after admission). n = 64. d Plasma IL-3 levels of SARS-CoV-2+ patients older or younger than 65 years. n = 92. e Analysis of plasma IL-3 levels (20 pg/ml identified by minimal p-value approach) and age defining risk groups to die (low and intermediate vs high; OR: 14.091; 95% CI: 1.680–118.218). n = 110. Data are mean ± S.E.M., *P < 0.05, **P < 0.01, ***P < 0.001, unpaired, two-tailed Student’s t test using Welch’s correction for unequal variances or Mann–Whitney test were used. Source data are provided as a Source Data file.
Fig. 2
Fig. 2. Plasma type I interferon levels are associated with plasma interleukin-3 levels and circulating pDCs in COVID-19.
a Absolute numbers of circulating pDCs and neutrophils in SARS-CoV-2+ patients from their admission to ICU and 1 to 7 days later. p = 0.0018 (pDCs d0), p = 0,0061 (pDCs d2), and p = 0.0227 (pDCs d7). n = 9. bd Absolute numbers of circulating pDCs (n = 16; p = 0.0331) (b) and plasma IFNα (n = 48, p = 0.0459) (c), and IFNλ (n = 19, p = 0.0167) (d) levels of patients with severe or non-severe COVID-19 infections. n = 16–48. ef Correlation between plasma IL-3 levels and plasma IFNα (e) and IFNλ (f) levels in SARS-CoV-2+ patients. n = 20–47. gh Correlation between absolute numbers of circulating pDCs and plasma IFNα (g) and IFNλ (h) levels in SARS-CoV-2+ patients. n = 12–13. Data are mean ± S.E.M., *P < 0.05, **P < 0.01, ***P < 0.001, unpaired, two-tailed Student’s t test using Welch’s correction for unequal variances was used. Source data are provided as a Source Data file.
Fig. 3
Fig. 3. Interleukin-3 protects against viral infection by increasing pDC numbers in the lungs.
a Percentage of pDCs in BALF of patients with pulmonary diseases with high or low BALF IL-3 levels. p = 0.004. Mann–Whitney test. n = 12. b Absolute numbers of pDCs and neutrophils in the lungs of naive mice 24 h after the i.n. injection of PBS or rIL-3, followed by an i.n. injection of CpG 8 h later. p = 0.0091. n = 8. c Levels of IFNα and IFNλ in the BALF of naive mice that received an i.n. injection of PBS or rIL-3, followed by an i.n. injection of CpG 8 h later, and were sacrificed 16 h later. n = 14 for IFNα (p = 0.0205) and n = 22 for IFNλ (p = 0.018). d, e Survival (d) and viral load in the lungs (e) of naive WT mice after i.n. infection with 6 × 106 PFU of HSV-1. Mice received an i.n. injection of PBS or rIL-3 just before HSV-1 infection. n = 26 (d) and n = 19 for d1 (p = 0.0151) and n = 15 for d3 (p = 0.0439) (e). Data are mean ± S.E.M., *P < 0.05, **P < 0.01, ***P < 0.001, unpaired, two-tailed Student’s t test using Welch’s correction for unequal variances was used. Source data are provided as a Source Data file.
Fig. 4
Fig. 4. Interleukin-3 is produced by T cells in COVID-19.
a Absolute numbers of circulating T cells in SARS-CoV-2+ patients from their admission to ICU and 1 to 7 days later. p = 0.0154 (d6). n = 9. b Correlation between the absolute numbers of circulating T cells and circulating pDCs in SARS-CoV-2+ patients. Pearson r test (p < 0.0001). n = 87. c Absolute numbers of circulating CD4+ T cells, CD8+ T cells, and B cells expressing IL-3 in SARS-CoV-2+ patients. p = 0.024 for CD4 T cells vs CD8 T cells; p = 0.0036 for CD4 T cells vs B cells. n = 7. d Correlation between the number of circulating T cells and the number of circulating pDCs of patients with pulmonary diseases. Pearson r test (p < 0.0001). n = 12. e Correlation between the percentage of BALF T cells and the percentage of BALF pDCs of patients with pulmonary diseases. Pearson r test (p = 0.0288). n = 20. f Percentage of T cells in the BALF of patients with pulmonary diseases with high or low IL-3 BALF levels. p = 0.0452. n = 13. Data are mean ± S.E.M., *P < 0.05, **P < 0.01, ***P < 0.001, unpaired, two-tailed Student’s t test using Welch’s correction for unequal variances and paired, two-tailed Student’s t test were used. Source data are provided as a Source Data file.
Fig. 5
Fig. 5. Interleukin-3 promotes the recruitment of pDCs into the lung in a CXCL12-dependent manner.
a Relative mRNA expression of Cxcl12 in the lungs of naive mice 24 h after the i.n. injection of PBS or rIL-3. p = 0.0009. n = 11–12. b Level of CXCL12 in the BALF of WT or Cd131−/− mice 24 h after the i.n. injection of PBS or rIL-3. n = 7 for WT (p = 0.0416) and n = 8 for Cd131−/− (p = 0.8046). c Absolute number of pDCs and neutrophils in the lungs of naive mice 24 h after the i.n.injection of PBS, IgG or anti-CXCL12 followed by i.n. injection of PBS (black) or IL-3 (grey). p = 0.0371 for IgG vs αCXCL12 and p = 0.437 for PBS vs IgG. n = 8–9. d Correlation between plasma IL-3 and CXCL12 levels of SARS-CoV-2+ patients. n = 181. e Level of CXCL12 in the BALF of patients with pulmonary diseases with high or low IL-3 BALF levels. p = 0.0078. n = 13. f Percentage of pDCs in the BALF of patients with pulmonary diseases with high or low CXCL12 BALF levels. p = 0.0051. n = 12. g Percentage of CXCL12+ epithelial cells in the lungs of patients with pulmonary inflammation. p < 0.0001. n = 16. h Immunohistochemistry of CD123, EpCAM, CXCL12, CD31, and IgG in the lungs of patients with pulmonary inflammation. n = 3 different lungs. Data are mean ± S.E.M., *P < 0.05, **P < 0.01, ***P < 0.001, two-tailed unpaired or Mann–Whitney test were used. Source data are provided as a Source Data file.

References

    1. Zhu N, et al. A novel coronavirus from patients with pneumonia in China, 2019. N. Engl. J. Med. 2020;382:727–733. doi: 10.1056/NEJMoa2001017. - DOI - PMC - PubMed
    1. Chen N, et al. Epidemiological and clinical characteristics of 99 cases of 2019 novel coronavirus pneumonia in Wuhan, China: a descriptive study. Lancet. 2020;395:507–513. doi: 10.1016/S0140-6736(20)30211-7. - DOI - PMC - PubMed
    1. Huang C, et al. Clinical features of patients infected with 2019 novel coronavirus in Wuhan, China. Lancet. 2020;395:497–506. doi: 10.1016/S0140-6736(20)30183-5. - DOI - PMC - PubMed
    1. Hoffmann M, et al. SARS-CoV-2 Cell Entry Depends on ACE2 and TMPRSS2 and is blocked by a clinically proven protease inhibitor. Cell. 2020;181:271–280 e278. doi: 10.1016/j.cell.2020.02.052. - DOI - PMC - PubMed
    1. Yap, J. K. Y., Moriyama, M. & Iwasaki, A. Inflammasomes and pyroptosis as therapeutic targets for COVID-19. J. Immunol.10.4049/jimmunol.2000513 (2020). - PMC - PubMed

Publication types

MeSH terms