Randomized Controlled Trial
. 2021 Feb 18;12(1):1139.
doi: 10.1038/s41467-021-21472-1.

Fecal microbiota transplantation in HIV: A pilot placebo-controlled study

Affiliations
Randomized Controlled Trial

Fecal microbiota transplantation in HIV: A pilot placebo-controlled study

Sergio Serrano-Villar et al. Nat Commun. .

Abstract

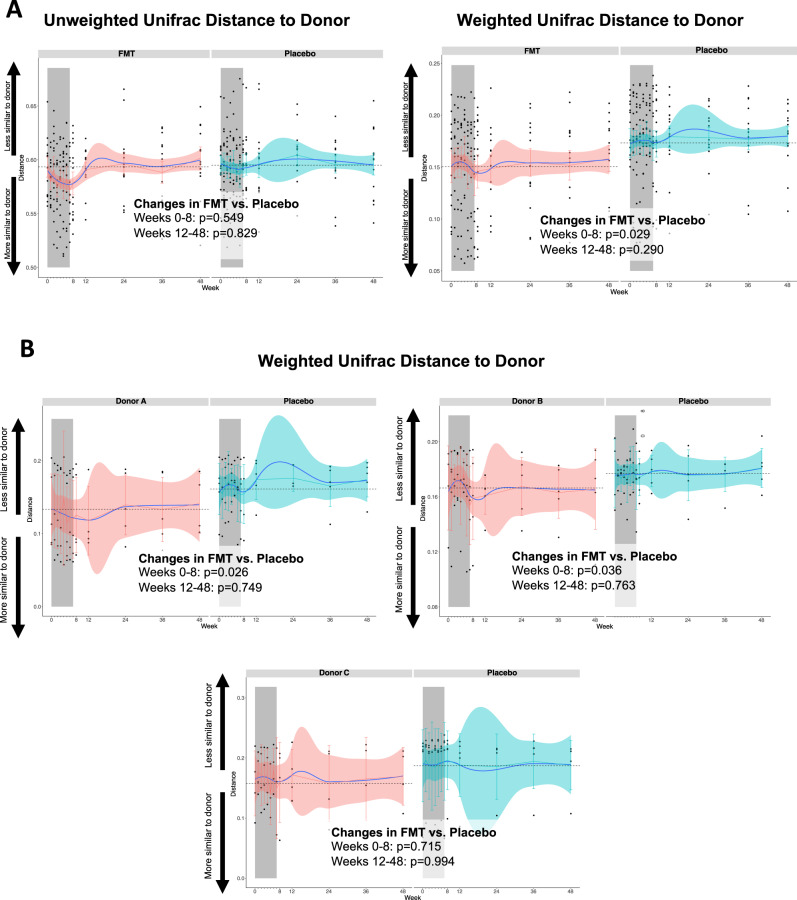
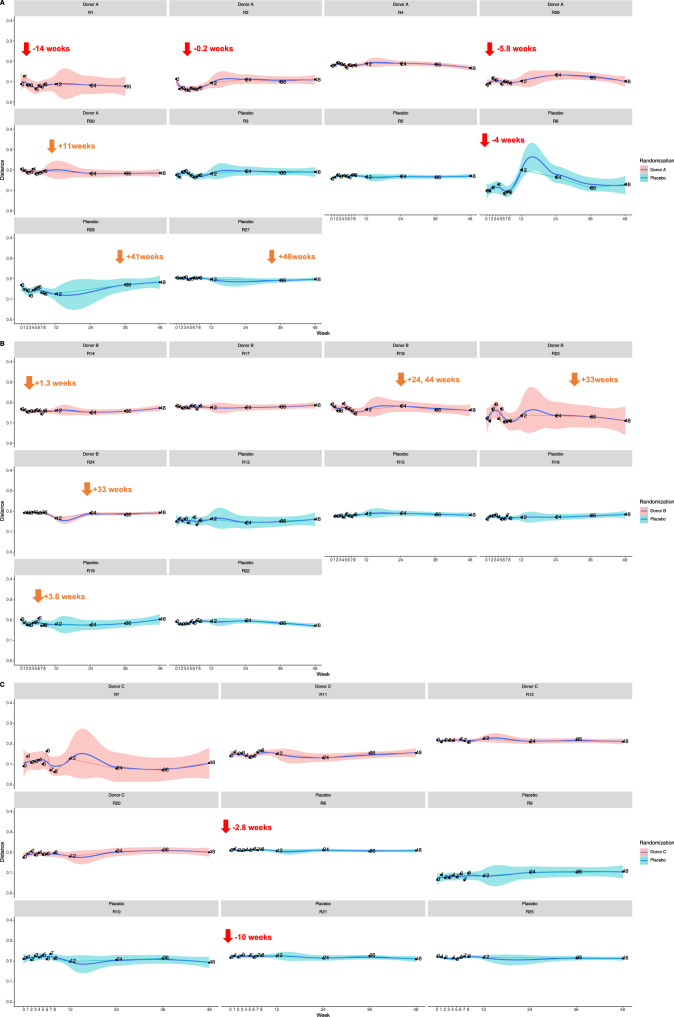
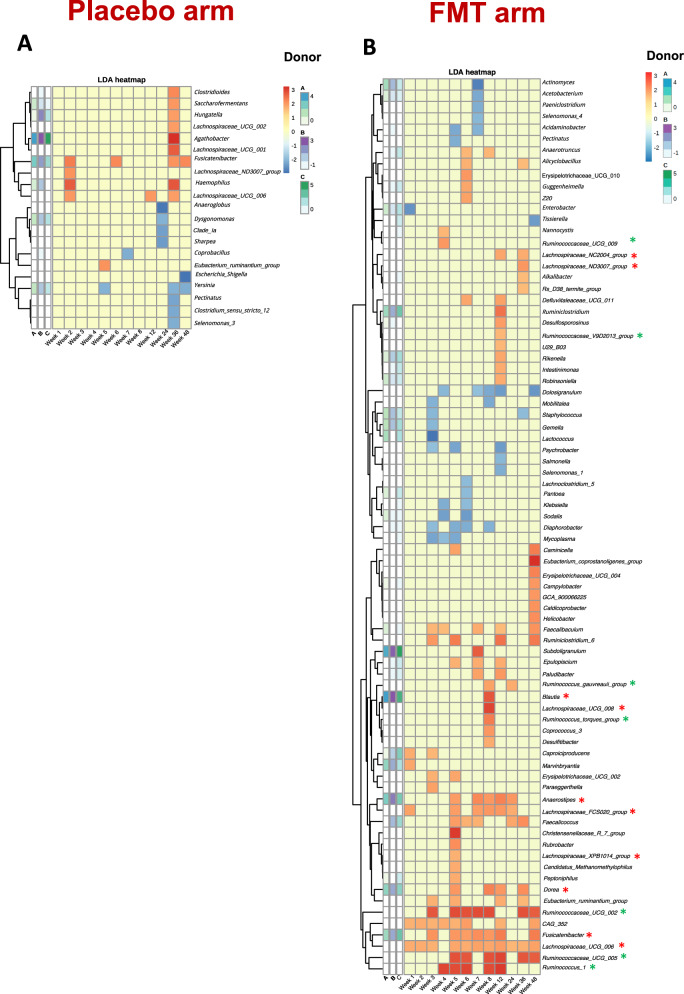
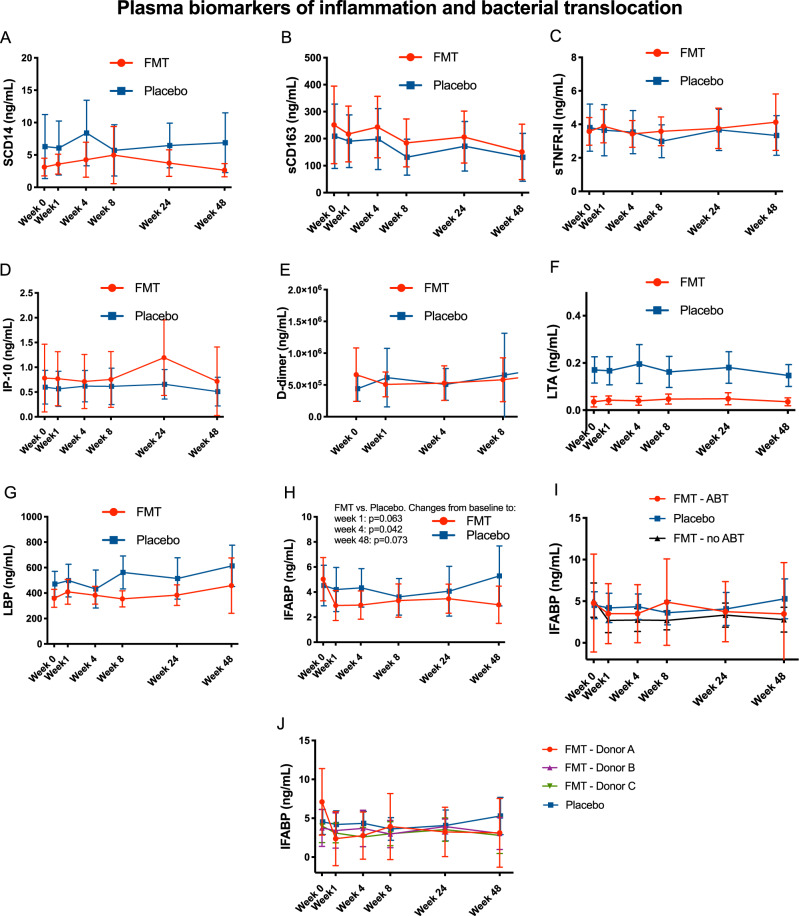
Changes in the microbiota have been linked to persistent inflammation during treated HIV infection. In this pilot double-blind study, we study 30 HIV-infected subjects on antiretroviral therapy (ART) with a CD4/CD8 ratio < 1 randomized to either weekly fecal microbiota capsules or placebo for 8 weeks. Stool donors were rationally selected based on their microbiota signatures. We report that fecal microbiota transplantation (FMT) is safe, not related to severe adverse events, and attenuates HIV-associated dysbiosis. FMT elicits changes in gut microbiota structure, including significant increases in alpha diversity, and a mild and transient engraftment of donor's microbiota during the treatment period. The greater engraftment seems to be achieved by recent antibiotic use before FMT. The Lachnospiraceae and Ruminococcaceae families, which are typically depleted in people with HIV, are the taxa more robustly engrafted across time-points. In exploratory analyses, we describe a significant amelioration in the FMT group in intestinal fatty acid-binding protein (IFABP), a biomarker of intestinal damage that independently predicts mortality. Gut microbiota manipulation using a non-invasive and safe strategy of FMT delivery is feasible and deserves further investigation. Trial number: NCT03008941.


Conflict of interest statement

Outside the submitted work, S.S.-V. reports personal fees from ViiV Healthcare, Janssen Cilag, Gilead Sciences, and MSD as well as non-financial support from ViiV Healthcare and Gilead Sciences and research grants from MSD and Gilead Sciences. J.M.-S. reports non-financial support from ViiV Healthcare, Gilead Sciences, and Jannsen Cilag. J.P. reports grants, personal fees and non-financial support from ViiV Healthcare; grants, personal fees, and non-financial support from Gilead Sciences; grants, personal fees, and non-financial support from Janssen Cilag; personal fees from MSD; and personal fees from Abbvie. F.D. reports personal fees from Gilead. J.M.S. reports personal fees from ViiV Healthcare, Janssen Cilag, and Gilead Sciences. MJ.V. reports personal fees from Gilead Sciences, non-financial support from ViiV Healthcare, and Gilead Sciences, and grants from ViiV Healthcare. S.M. reports personal fees and non-financial from ViiV Healthcare, Janssen, Gilead Sciences, and MSD, as well as grants from MSD, ViiV Healthcare, and Gilead Sciences. S.B. and M.O. work for OpenBiome. R.E. was an employee at OpenBiome during the conduct of this study. A.T.-R., M.J.G., N.M., B.N., V.L., A.V., J.Z., C.G., M.M., R.R., S.H., U.A., and A.M. report no conflicts of interest.

Figures

Fig. 1
Fig. 1. Changes in three metrics of alpha diversity at the OTUs level in each the FMT (red) and placebo (blue) groups.
Bacterial richness (number of OTU), Chao1 and Shannon indexes increased incrementally in the FMT arm. Black dots represent individual measurements. Blue lines represent the smoothed mean value. Horizontal dashed lines represent the baseline levels. Vertical bars represent the 95% confidence intervals. The gray area indicates the induction period in which study participants received FMT or placebo. Two-sided P values estimated using mixed models not adjusted for multiple comparisons remained unchanged after adjustment for nadir CD4 and time since HIV diagnosis. Abbreviatures: FMT, fecal microbiota transplant. n = 361 biologically independent samples from 14 individuals in the FMT group and 15 individuals in the placebo group.
Fig. 2
Fig. 2. Engraftment of donor’s microbiota on study participants. Unifrac distances from recipients in the FMT (red) and placebo (blue) groups to donors.
Panel A represents the unweighted and weighted Unifrac trajectories in the FMT and the placebo group. The peak effect occurred at week 3 for unweighted Unifrac, which considers the presence or absence of taxa, and at week 8 for weighted Unifrac, which considers their abundance. To explore donor-effects, in panel B we segregated the subjects in the FMT group per donor. The effect on weighted Unifrac distances were more pronounced for donor A. The Unifrac distances in the placebo group were calculated from each sample to the assigned donor, in order to understand the similarities with donors explained by randomness. Black dots represent individual measurements. Blue lines represent the smoothed mean value. Horizontal dashed lines represent the baseline levels. Vertical bars represent the 95% confidence intervals. The gray area indicates the induction period in which study participants received FMT or placebo. Two-sided P values estimated using mixed models not adjusted for multiple comparisons remained unchanged after adjustment for nadir CD4 and time since HIV diagnosis. Abbreviatures: FMT, fecal microbiota transplant. n = 361 biologically independent samples from 14 individuals in the FMT group and 15 individuals in the placebo group.
Fig. 3
Fig. 3. Engraftment of donor’s microbiota on study participants. Individual weighted Unifrac distances from recipients to donor.
Individual weighted Unifrac distances from recipients to donors A, B and C (in red) have been represented together in panels A, B, and C, respectively. Black dots represent individual measurements. Blue lines represent the smoothed mean value. Shadow areas represent the 95% confidence intervals estimated by the smooth function. Red arrows indicate the use of antibiotics before the baseline, orange arrows indicate the use of antibiotics after the baseline. The Unifrac distances among patients in the placebo arm (in blue) were calculated using the mean values to a donor randomly assigned. Detailed information regarding the type of antibiotic, dosage, duration and indication is provided in Supplementary Table 2.
Fig. 4
Fig. 4. Taxonomic composition of the top 15 most abundant genus.
Each plot represents one study subject. Within each plot, bars represent independent measurements over time. Individuals grouped by donor A, B or C, or placebo are represented in the respective panels, in which the columns A, B and C denote the microbiota composition of donors A, B and C, respectively. The panel “basal mean” represents the mean abundance at baseline in the FMT and placebo groups. n = 369 biologically independent samples from 14 individuals in the FMT group, 15 individuals in the placebo group, and 3 donors.
Fig. 5
Fig. 5. Heatmap of LDA distances at the genus level from study participants to donors at each time point in the placebo (panel A) and FMT (panel B) groups.
For the LDA distances calculations in the participants allocated to receive a placebo, the values represented were calculated as the distances from each timepoint to the assigned donor. Each column represents one timepoint. The three columns represented on the left of the pale-yellow cells represent the distance from the assigned donor to the baseline visit, and inform on the relative abundance of the represented genus on study participants with respect to donors at baseline. Green asterisks identify the genus belonging to the Ruminococcaceae family. Red asterisks identify the genus belonging to the Lachnospiraceae family. Abbreviatures: FMT, fecal microbiota transplant. n = 369 biologically independent samples from 14 individuals in the FMT group, 15 individuals in the placebo group, and 3 donors.
Fig. 6
Fig. 6. Changes in plasma biomarkers of inflammation (A: sCD14, B: sCD164, C: sTNFR-II, D: IP-10, E: D-dimer) and bacterial translocation (F: LTA, G: LBP, H, I and J: IFABP).
Lines represent mean values in the FMT (red) and placebo (blue) group. Vertical bars represent the 95% confidence intervals. Two-sided P values estimated using mixed models not adjusted for multiple comparisons showed no significant differences between treatment arms, unless otherwise indicated, and remained unchanged after adjustment for nadir CD4 and time since HIV diagnosis. Abbreviatures: FMT, fecal microbiota transplant. n = 172 biologically independent samples from 14 individuals in the FMT group and 15 individuals in the placebo group. Experiments were run in triplicate.

Similar articles

Cited by

References

    1. Vujkovic-Cvijin I, et al. Dysbiosis of the gut microbiota is associated with HIV disease progression and tryptophan catabolism. Sci. Transl. Med. 2013;5:193ra91. doi: 10.1126/scitranslmed.3006438. - DOI - PMC - PubMed
    1. Dillon SM, et al. An altered intestinal mucosal microbiome in HIV-1 infection is associated with mucosal and systemic immune activation and endotoxemia. Mucosal Immunol. 2014;7:983–994. doi: 10.1038/mi.2013.116. - DOI - PMC - PubMed
    1. Serrano-Villar S, et al. Gut Bacteria Metabolism Impacts Immune Recovery in HIV-infected Individuals. EBioMedicine. 2016;8:203–216. doi: 10.1016/j.ebiom.2016.04.033. - DOI - PMC - PubMed
    1. Li, S. X. et al. Gut microbiota from high-risk men who have sex with men drive immune activation in gnotobiotic mice and in vitro HIV infection. PLoS Pathog. 15, e1007611 (2019). - PMC - PubMed
    1. Sandler NG, Douek DC. Microbial translocation in HIV infection: causes, consequences and treatment opportunities. Nat. Rev. Microbiol. 2012;10:655–666. doi: 10.1038/nrmicro2848. - DOI - PubMed

Publication types

Associated data