

Simple low dose radiography allows precise lung volume assessment in mice
- PMID: 33602964
- PMCID: PMC7893164
- DOI: 10.1038/s41598-021-83319-5
Simple low dose radiography allows precise lung volume assessment in mice
Abstract
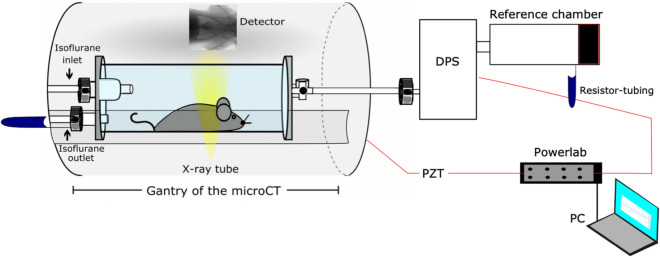
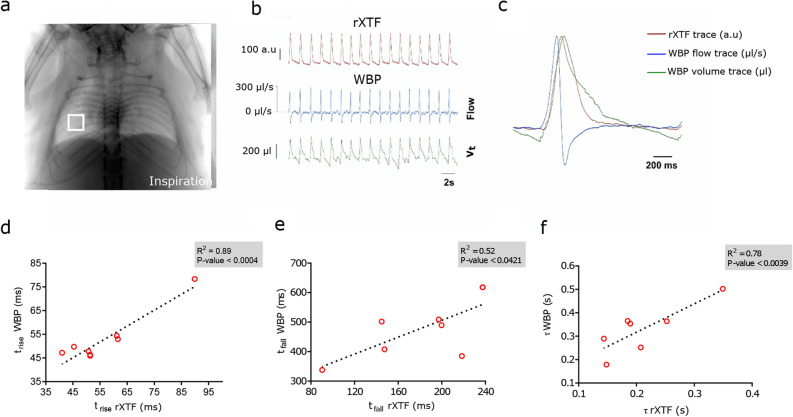
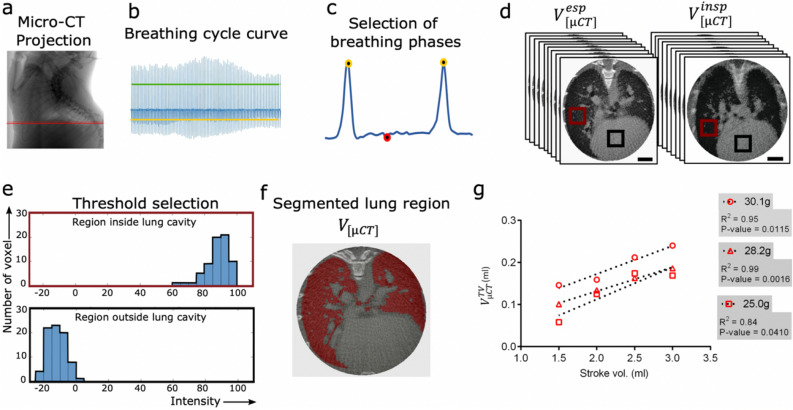
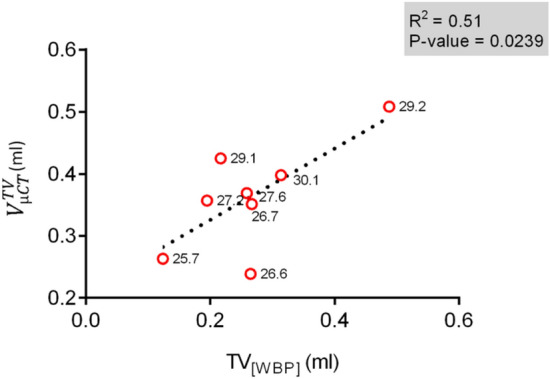
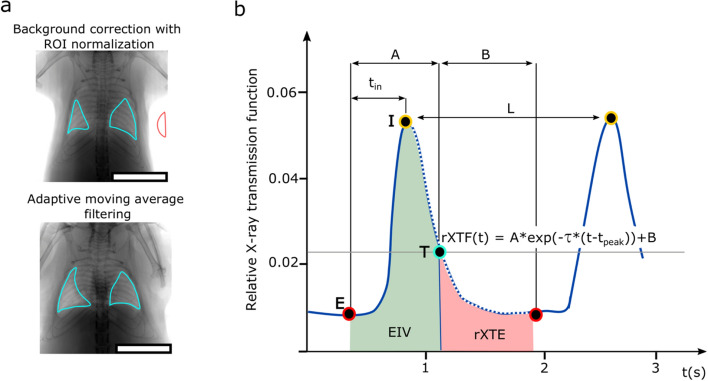
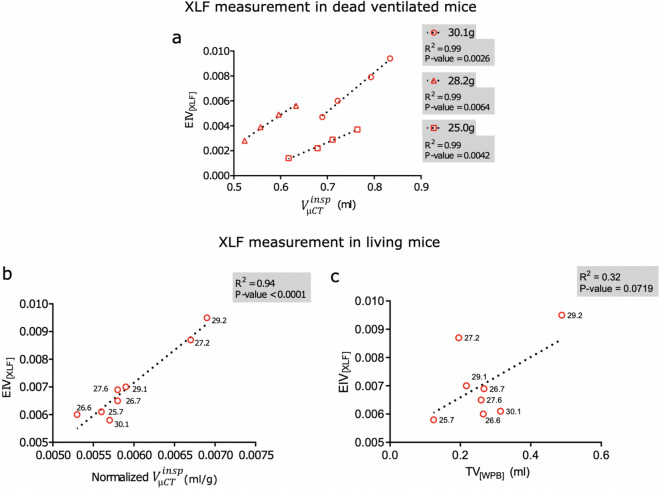
X-ray based lung function (XLF) as a planar method uses dramatically less X-ray dose than computed tomography (CT) but so far lacked the ability to relate its parameters to pulmonary air volume. The purpose of this study was to calibrate the functional constituents of XLF that are biomedically decipherable and directly comparable to that of micro-CT and whole-body plethysmography (WBP). Here, we developed a unique set-up for simultaneous assessment of lung function and volume using XLF, micro-CT and WBP on healthy mice. Our results reveal a strong correlation of lung volumes obtained from radiographic XLF and micro-CT and demonstrate that XLF is superior to WBP in sensitivity and precision to assess lung volumes. Importantly, XLF measurement uses only a fraction of the radiation dose and acquisition time required for CT. Therefore, the redefined XLF approach is a promising tool for preclinical longitudinal studies with a substantial potential of clinical translation.
Conflict of interest statement
The authors declare no competing interests.
Figures
Similar articles
-
Longitudinal x-ray based lung function measurement for monitoring Nintedanib treatment response in a mouse model of lung fibrosis.Sci Rep. 2023 Oct 30;13(1):18637. doi: 10.1038/s41598-023-45305-x. Sci Rep. 2023. PMID: 37903864 Free PMC article.
-
X-Ray based Lung Function measurement-a sensitive technique to quantify lung function in allergic airway inflammation mouse models.Sci Rep. 2016 Nov 2;6:36297. doi: 10.1038/srep36297. Sci Rep. 2016. PMID: 27805632 Free PMC article.
-
X-ray dose delivered during a longitudinal micro-CT study has no adverse effect on cardiac and pulmonary tissue in C57BL/6 mice.Acta Radiol. 2013 May;54(4):435-41. doi: 10.1177/0284185113475608. Epub 2013 Apr 30. Acta Radiol. 2013. PMID: 23436828
-
Lung function testing in infancy.Arch Dis Child. 1990 May;65(5):548-52. doi: 10.1136/adc.65.5.548. Arch Dis Child. 1990. PMID: 2192689 Free PMC article. Review. No abstract available.
-
Comparison of methods of measuring static lung volumes.Monaldi Arch Chest Dis. 1996 Oct;51(5):431-9. Monaldi Arch Chest Dis. 1996. PMID: 9009635 Review.
Cited by
-
Simultaneous assessment of lung morphology and respiratory motion in retrospectively gated in-vivo microCT of free breathing anesthetized mice.Sci Rep. 2022 Aug 2;12(1):13299. doi: 10.1038/s41598-022-17335-4. Sci Rep. 2022. PMID: 35918439 Free PMC article.
-
Imaging drug delivery to the lungs: Methods and applications in oncology.Adv Drug Deliv Rev. 2023 Jan;192:114641. doi: 10.1016/j.addr.2022.114641. Epub 2022 Dec 9. Adv Drug Deliv Rev. 2023. PMID: 36509173 Free PMC article. Review.
-
Evaluation of a mechanical lung model to test small animal whole body plethysmography.Sci Rep. 2021 Aug 24;11(1):17099. doi: 10.1038/s41598-021-96355-y. Sci Rep. 2021. PMID: 34429449 Free PMC article.
-
Lung function measurements in preclinical research: What has been done and where is it headed?Front Physiol. 2023 Mar 22;14:1130096. doi: 10.3389/fphys.2023.1130096. eCollection 2023. Front Physiol. 2023. PMID: 37035677 Free PMC article. Review.
-
Longitudinal x-ray based lung function measurement for monitoring Nintedanib treatment response in a mouse model of lung fibrosis.Sci Rep. 2023 Oct 30;13(1):18637. doi: 10.1038/s41598-023-45305-x. Sci Rep. 2023. PMID: 37903864 Free PMC article.
References
-
- World Health Organization, World Health Statistics 2008. WHO, Geneva, Switzerland; https://www.who.int/whosis/whostat/2008/en/ (2008).
Publication types
MeSH terms
LinkOut - more resources
Full Text Sources
Other Literature Sources
