. 2021 Feb 18;11(1):4084.
doi: 10.1038/s41598-021-83302-0.

Beta cell function, insulin resistance and vitamin D status among type 2 diabetes patients in Western Kenya

Affiliations

Beta cell function, insulin resistance and vitamin D status among type 2 diabetes patients in Western Kenya

Jamil Said et al. Sci Rep. .

Abstract

Serum vitamin D status exerts effects on glucose-insulin-homeostatic states underlying Diabetes-Mellitus, Type 2 (T2DM). This has been described in white and Asian population where low Vitamin D levels predicted future impairments in beta cell function and worsening of insulin resistance. This study aimed to examine the relationship between serum vitamin D, insulin resistance and beta cell function in a sub population of black Kenyan T2DM patients. The primary objective was to determine the levels of serum 25 hydroxy (25-OH) vitamin D, and estimate the insulin resistance, and beta cell function among T2DM patients at Moi Teaching and Referral Hospital (MTRH). This was a cross sectional study. 124 T2DM patients attending the MTRH Diabetes clinic between February and May 2016 were enrolled. Patients on insulin therapy and/or thiazolidinediones were excluded. Anthropometric, clinical and demographic data was obtained. Samples were drawn for estimation of serum 25-OH vitamin D, fasting insulin levels and fasting blood glucose levels. HOMA (Homeostatic model of assessment) model was used to estimate Beta cell secretion (HOMA-B) and insulin resistance (HOMA-IR); while the Disposition index {(DI) hyperbola product of insulin sensitivity (1/HOMA-IR) and beta cell secretion} was used to estimate the beta cell function. The relationships between serum vitamin D, insulin resistance and beta cell function were explored using a linear regression model. The study participants had a mean age of 56.2 (± 9.2) years, and a mean BMI of 26.9 kg/m2 (4.3). Forty nine percent (n = 61) were males. Vitamin D deficiency was present in 71.1% (n = 88) of the respondents. Relatively low levels of insulin resistance and higher levels of beta cell dysfunction were observed {median HOMA-IR of 2.3 (0.7, 6.5) and Disposition Index (DI) of 25.5 (14.3, 47.2)}. Vitamin D levels exhibited a low positive correlation with DI [r = 0.22 (95% CI: 0.03, 0.37)], but was not significantly correlated with HOMA-IR [r = 0.07(95% CI: - 0.11, 0.25)]. These results indicate that beta cell dysfunction rather than insulin resistance as the predominant defect among black T2DM patients seeking care at the MTRH diabetes clinic. Vitamin D deficiency is also prevalent among them and exhibits a low positive correlation with beta cell dysfunction. There was no correlation observed between Vitamin D deficiency and insulin resistance.


Figures

Figure 1
Figure 1
Patient recruitment schema flow chart.
Figure 2
Figure 2
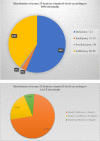
Comparison of distribution of serum 25-hydroxyvitamin D levels according to IOM (Institute Of Medicine) and AACE (American Academy of Clinical Endocrinology) thresholds.
Figure 3
Figure 3
Relationship between vitamin D and log insulin resistance.
Figure 4
Figure 4
Relationship between vitamin D and log disposition index.
Figure 5
Figure 5
Adjusted and un-adjusted relationship between vitamin D and log of disposition index, with comparison between IOM and AACE Vitamin D thresholds. (A) Box plots showing un-adjusted linear regression correlation between Vitamin D levels (categorised according to IOM thresholds) and log of disposition index. (B) Forest plot showing un-adjusted linear regression correlation between Vitamin D levels (categorised according to IOM thresholds) and log of disposition index. (C) Box plots showing linear regression correlation between Vitamin D levels (categorised according to IOM thresholds) and log of disposition index, adjusted for BMI and sulfonylurea use. (D) Forest plot showing linear regression correlation between Vitamin D levels (categorised according to IOM thresholds) and log of disposition index, adjusted for BMI and sulfonylurea use. (E) Box plots showing un-adjusted linear regression correlation between Vitamin D levels (categorised according to AACE thresholds) and log of disposition index. (F) Forest plot showing un-adjusted linear regression correlation between Vitamin D levels (categorised according to AACE thresholds) and log of disposition index. (G) Box plots showing linear regression correlation between Vitamin D levels (categorised according to AACE thresholds) and log of disposition index, adjusted for BMI and sulfonylurea use. (H) Forest plot showing linear regression correlation between Vitamin D levels (categorised according to AACE thresholds) and log of disposition index, adjusted for BMI and sulfonylurea use. (I) Forest plot comparing linear regression correlation between Vitamin D levels (categorised according to both IOM and AACE thresholds) and log of disposition index, after adjustment for BMI and sulfonylurea use.
Figure 5
Figure 5
Adjusted and un-adjusted relationship between vitamin D and log of disposition index, with comparison between IOM and AACE Vitamin D thresholds. (A) Box plots showing un-adjusted linear regression correlation between Vitamin D levels (categorised according to IOM thresholds) and log of disposition index. (B) Forest plot showing un-adjusted linear regression correlation between Vitamin D levels (categorised according to IOM thresholds) and log of disposition index. (C) Box plots showing linear regression correlation between Vitamin D levels (categorised according to IOM thresholds) and log of disposition index, adjusted for BMI and sulfonylurea use. (D) Forest plot showing linear regression correlation between Vitamin D levels (categorised according to IOM thresholds) and log of disposition index, adjusted for BMI and sulfonylurea use. (E) Box plots showing un-adjusted linear regression correlation between Vitamin D levels (categorised according to AACE thresholds) and log of disposition index. (F) Forest plot showing un-adjusted linear regression correlation between Vitamin D levels (categorised according to AACE thresholds) and log of disposition index. (G) Box plots showing linear regression correlation between Vitamin D levels (categorised according to AACE thresholds) and log of disposition index, adjusted for BMI and sulfonylurea use. (H) Forest plot showing linear regression correlation between Vitamin D levels (categorised according to AACE thresholds) and log of disposition index, adjusted for BMI and sulfonylurea use. (I) Forest plot comparing linear regression correlation between Vitamin D levels (categorised according to both IOM and AACE thresholds) and log of disposition index, after adjustment for BMI and sulfonylurea use.

References

    1. Holick MF. Vitamin D deficiency. N. Engl. J. Med. 2007;357:266–281. doi: 10.1056/NEJMra070553. - DOI - PubMed
    1. Davies JH, Shaw NJ. Preventable but no strategy: vitamin D deficiency in the UK. Arch. Dis. Child. 2011;96:614–615. doi: 10.1136/adc.2010.191627. - DOI - PubMed
    1. Lee JI, et al. Serum 25-hydroxyvitamin D concentration and arterial stiffness among type 2 diabetes. Diabetes Res. Clin. Pract. 2012;95:42–47. doi: 10.1016/j.diabres.2011.09.006. - DOI - PubMed
    1. Yu JR, et al. Serum vitamin d status and its relationship to metabolic parameters in patients with type 2 diabetes mellitus. Chonnam Med. J. 2012;48:108–115. doi: 10.4068/cmj.2012.48.2.108. - DOI - PMC - PubMed
    1. Al-Shoumer KA, Al-Asoosi AA, Ali AH, Nair VS. Does insulin resistance in type 2 diabetes alter vitamin D status? Prim Care Diabetes. 2013;7:283–287. doi: 10.1016/j.pcd.2013.04.008. - DOI - PubMed