. 2021 Feb 18;11(1):4164.
doi: 10.1038/s41598-021-83374-y.

Effect of palmitoylation on the dimer formation of the human dopamine transporter

Affiliations

Effect of palmitoylation on the dimer formation of the human dopamine transporter

Talia Zeppelin et al. Sci Rep. .

Abstract

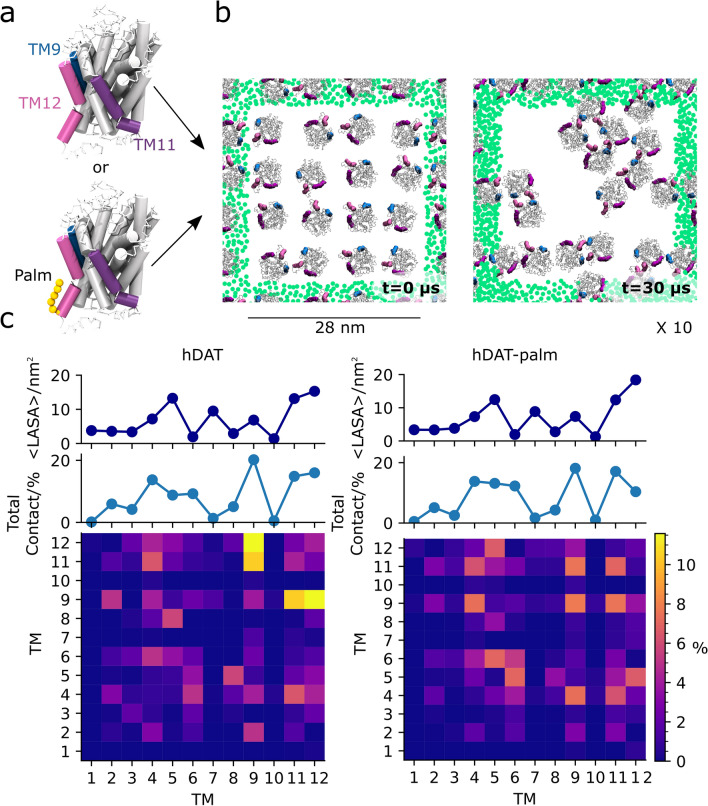
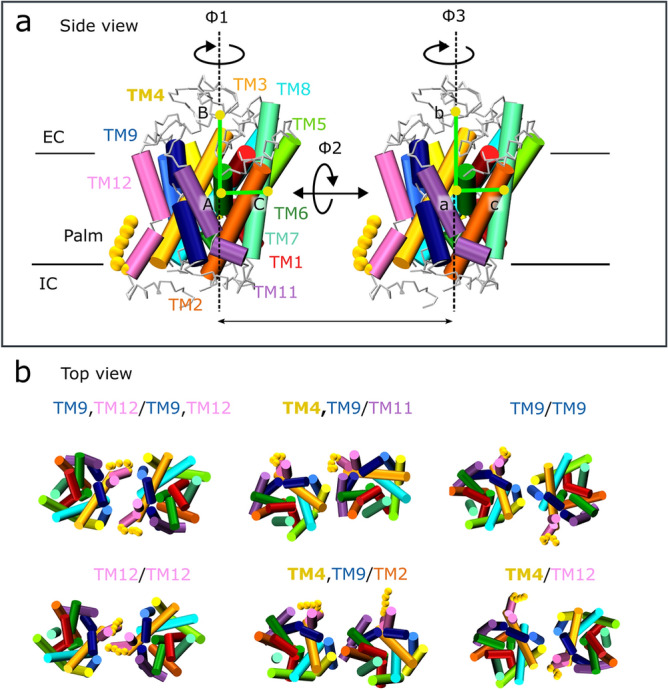
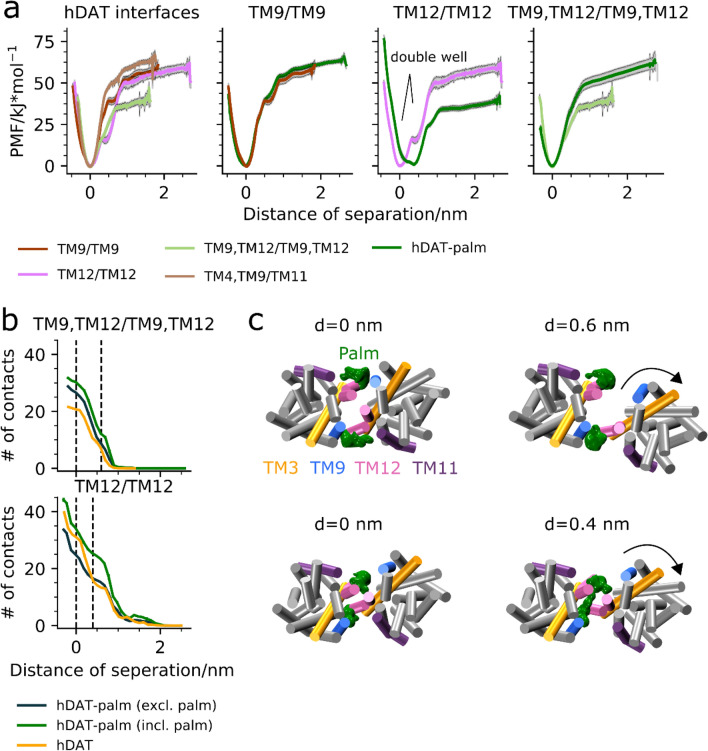
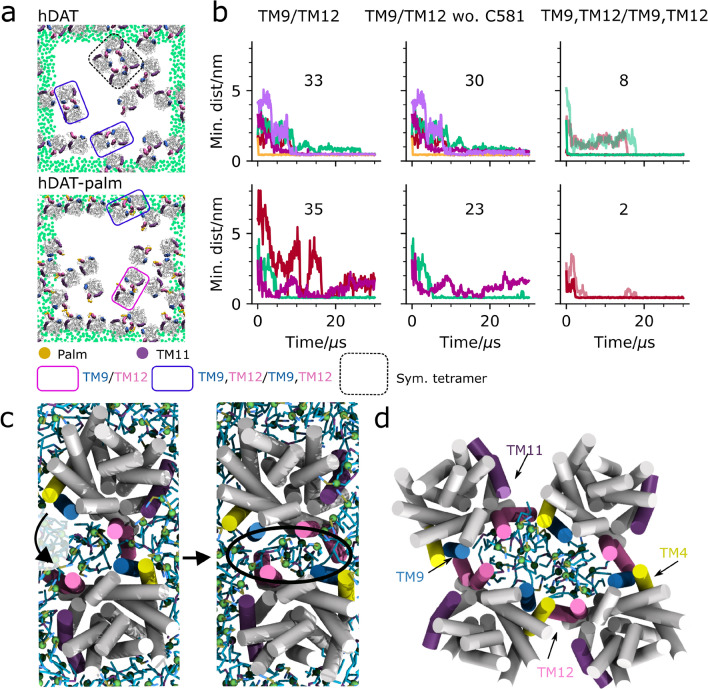
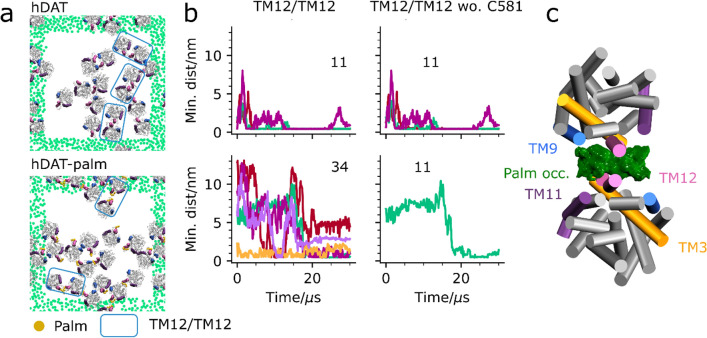
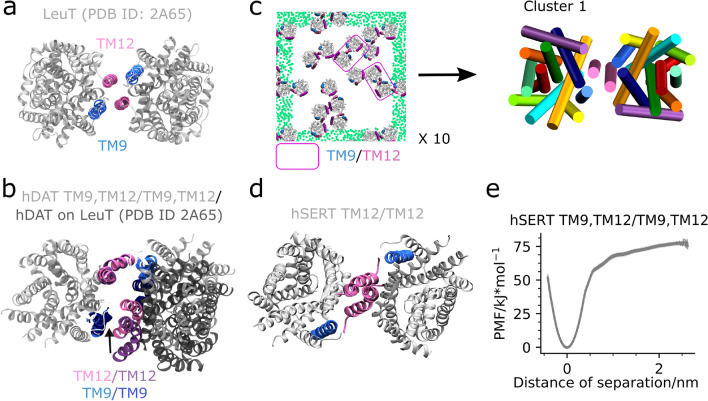
The human dopamine transporter (hDAT) is one in three members of the monoamine transporter family (MAT). hDAT is essential for regulating the dopamine concentration in the synaptic cleft through dopamine reuptake into the presynaptic neuron; thereby controlling hDAT dopamine signaling. Dysfunction of the transporter is linked to several psychiatric disorders. hDAT and the other MATs have been shown to form oligomers in the plasma membrane, but only limited data exists on which dimeric and higher order oligomeric states are accessible and energetically favorable. In this work, we present several probable dimer conformations using computational coarse-grained self-assembly simulations and assess the relative stability of the different dimer conformations using umbrella sampling replica exchange molecular dynamics. Overall, the dimer conformations primarily involve TM9 and/or TM11 and/or TM12 at the interface. Furthermore, we show that a palmitoyl group (palm) attached to hDAT on TM12 modifies the free energy of separation for interfaces involving TM12, suggesting that S-palmitoylation may change the relative abundance of dimers involving TM12 in a biological context. Finally, a comparison of the identified interfaces of hDAT and palmitoylated hDAT to the human serotonin transporter interfaces and the leucine transporter interface, suggests similar dimer conformations across these protein family.


Conflict of interest statement

The authors declare no competing interests.

Figures

Figure 1
Figure 1
System setup and interhelical contact maps of hDAT and hDAT-palm excluding the palmitoyl group. (a) The hDAT CG structures with and without a palm group (orange spheres) attached to TM12. Shown in (b) is a top view of one of a system a(top view with respect to the membrane) at 0 µs (left) and after a 30 µs simulation (right). In the two systems 16 hDAT and hDAT-palm molecules were initially equally spaced and randomly orientated with respect to each other in a pure POPC membrane. hDAT and hDAT-palm were simulated for 30 µs and repeated 10 times. Palm, TM9, TM11, and TM12 are highlighted in orange, blue, purple, and magenta, respectively. The green dots represent the GL1 bead of POPC in the nearest periodic images for the system. Illustrated in (c), hDAT (left) and hDAT-palm (right), are the per helix contact maps calculated for all possible dimer pairs. An interhelical contact was considered when any residue in one protomer’s helix was within 7 Å of any residue in the other protomer’s helix (not considering the palm group). The contacts have been normalized by the total number of contacts calculated for the hDAT system. The 1D plot immediately above the contact map illustrates the sum of all TM contacts calculated for each helix given in %. The top 1D plot illustrates the average lipid accessible surface area in nm2 of the different helices in the two systems using a probe of size 0.26 nm. The standard deviations are not visible in the plots due to their small sizes (they vary between 0.23 and 0.71).
Figure 2
Figure 2
Dimer cluster comparison between the two systems, hDAT and hDAT-palm. Depicted in (a) is a transmembrane (TM) overview of hDAT shown from the side with respect to the membrane normal. The helices are individually color-coded using the same coloring scheme as applied throughout the article. Highlighted in bold spheres is the palmitoyl group (palm) covalently bound to TM12. The two angles, ϕ1 and ϕ3, are used for describing the individual protomer’s relative orientation. Depicted in (b) are the common top clusters observed in both the hDAT and hDAT-palm simulations, with the exception of the TM12/TM12 dimer, which is only detected 0.1% of the time in the hDAT-palm simulations. For a full view of the representative dimers of all top clusters of the hDAT and hDAT-palm system see Supplementary Fig. S5-6.
Figure 3
Figure 3
Potential of mean force energy profiles and contact analysis of hDAT and hDAT-palm interfaces. Illustrated in the first panel in (a) are all the PMFs of the different hDAT interfaces: TM9/TM9 (brown), TM9,TM12/TM9,TM12 (light green), TM12,TM12 (pink), and TM4, TM9/TM11 (light brown). Shown in the subsequent plots are PMF comparisons of the interfaces TM9/TM9, TM9,TM12/TM9,TM12, and TM12/TM12 between hDAT and hDAT-palm (green). Shown in (b) are the average number of residue contacts calculated within 1 Å distance bins along hDAT dimer separation relative to the distance at energy minimum as detected from the PMF energy profiles. The number of residue contacts for the two systems, hDAT and hDAT-palm, at the two interfaces, TM12/TM12 and TM9, TM12/TM9, TM12, were monitored. For both interfaces the Cys581 residue where palm is attached is either included (incl.) or excluded (excl.) from the contacts analysis. A contact was counted when the distance between two residue pairs was below 7 Å. Each contact was unbiased. Error bars have been included by performing bootstrapping on the data using 10 iterations, although they are barely visible. Shown in (c) are representative dimer conformations of hDAT-palm at different separation distances for the TM9, TM12/TM9, TM12 interface (top) and the TM12/TM12 interface (bottom). Highlighted are helices TM3, TM9, TM11 and TM12. The green mesh corresponds to the palm occupancies calculated using the Volmap plugin in VMD for the dimer conformations found around the given separation distance. For the Volmap calculations the size of the system beads were set to 2.6 Å and the “occupancy” setting was selected. The arrows indicate the movement of the proteins with respect to each other.
Figure 4
Figure 4
Dynamics of the TM9/TM12 interface. In (a) the last frame of a single representative repeat simulation is shown for hDAT (MD1, top) and hDAT-palm (MD4, bottom). The last frames for all repeat simulations are supplied in Supplementary Fig S1. Within the pink boxes are TM9/TM12 interfaces and illustrated in the purple box is a symmetrical interface involving both TM9 and TM12 helices, dubbed TM9, TM12/TM9, TM12. Highlighted in the black dotted box is a symmetrical tetramer. The green dots correspond to the GL1 bead in POPC and are depicted for the nearest periodic images to the system. For the single simulation box the dots have been omitted. The helices TM9, TM11, and TM12 are highlighted in blue, purple, and mauve, respectively. Illustrated in (b) is the formation of single TM9/TM12 contacts both considering and not considering Cys581 (wo. Cys581) on which palm is attached in the analysis (the first and second column, respectively). Double TM9,TM12/TM9,TM12 contacts are also monitored for the same representative repeat simulations as depicted in (a) for hDAT (top) and hDAT-palm (bottom)(third column). Each color in the same plot represents a different dimer pair and the total number of dimers across all repeat simulations that form the given interface are noted in the plots. The TM9, TM12/TM9, TM12 interface is further subdivided into two similar color shades representing the minimum distance for each TM9/TM12 helix pair located in the same dimer. The contact plots for the different interfaces across all repeat simulations are supplied in Supplementary Fig. S10-14. In (c) the formation of the symmetrical TM9, TM12/TM9, TM12 interface is shown. It is observed that POPC lipids are associated with the interface. Illustrated in (d) is a close-up of the symmetrical tetramer.
Figure 5
Figure 5
Dynamics of the TM12/TM12 interface. In (a) the last frame of a single representative repeat simulation is shown for hDAT (MD2, top) and hDAT-palm (MD3, bottom). The last frames for all repeat simulations are supplied in Supplementary Fig. S1. Similar interfaces are observed across the two systems involving TM12 on which palm (orange) is attached. Within the blue box a TM12/TM12 interface is observed. The green dots correspond to the GL1 bead in POPC and are shown for the nearest periodic images to the system. For the single simulation box the dots have been omitted. The helices TM9, TM11, and TM12 are highlighted in blue, purple and mauve, respectively. In (b) the formation of single TM12/TM12 contacts both considering and not considering Cys581 (wo. Cys581) on which palm is attached in the analysis. The TM12/TM12 pairs that were monitored were evaluated as being in contact continuously for 500 ns during the course of the simulation. A contact was defined when the minimum distance between TM12 helices was below 7 Å. The contact plots for the different interfaces across all repeat simulations are supplied in Supplementary Fig. S15-17. Shown in (c) is the palm 3D occupancy computed using the Volmap plugin in VMD for all dimers captured in the TM12/TM12 hDAT-palm cluster (cluster 53 in Table 1).
Figure 6
Figure 6
LeuT and MATs have a similar TM12/TM12 and TM12,TM9/TM12,TM9 interface. Shown in (a) is a top view of the LeuT crystal structure dimer (PDB ID: 2A65) with helices TM9 and TM12 highlighted. In (b) the central hDAT dimer structure from cluster 1 (see Fig. 2b) is superimposed on hDAT monomers aligned to the LeuT dimer. Depicted in (c) is a representative last frame of the 10 LeuT self-assembly repeat simulations (MD1). See Supplementary Fig. S18 for a full overview. Each system contains 16 LeuT (PDB ID: 2A65) proteins equally spaced but randomly orientated in a pure POPE membrane and has been simulated for 30 µs. The helices TM9, TM11, and TM12 are highlighted in blue, purple, and mauve, respectively. Emphasized by pink boxes are dimers containing TM12/TM12 and to some extent TM9 contacts. The green dots correspond to the GL1 bead in POPE and are shown for the nearest periodic image to the system. For the central simulation box the dots have been omitted. To the right in (c) is a top view with respect to the membrane normal of the central dimer conformation observed in cluster 1. Notice that the dimer achieved from our simulations has an interface consisting of TM12/TM12, TM9 contacts, due to a slight change in the two proteins relative orientation. This change in orientation relative to the LeuT crystal structure dimer results in a loss of contacts to one of the TM9 helices. Represented in (d) is the stable hSERT TM12/TM12 dimer previously detected. Finally, in (e) is the PMF of the hSERT TM9,TM12/TM9,TM12 interface.

References

    1. Kristensen AS, et al. SLC6 neurotransmitter transporters: structure, function, and regulation. Pharmacol. Rev. 2011;63:585–640. doi: 10.1124/pr.108.000869. - DOI - PubMed
    1. Norregaard L, Gether U. The monoamine neurotransmitter transporters: structure, conformational changes and molecular gating. Curr. Opin. Drug. Disc. Dev. 2001;4:591–601. - PubMed
    1. Pramod AB, Foster J, Carvelli L, Henry LK. SLC6 transporters: Structure, function, regulation, disease association and therapeutics. ABCs membr. Transp. Health Dis. (SLC Ser.) 2013;34:197–219. - PMC - PubMed
    1. Torres GE, Gainetdinov RR, Caron MG. Plasma membrane monoamine transporters: structure, regulation and function. Nat. Rev. Neurosci. 2003;4:13–25. doi: 10.1038/nrn1008. - DOI - PubMed
    1. Coleman JA, Green EM, Gouaux E. X-ray structures and mechanism of the human serotonin transporter. Nature. 2016;532:334–339. doi: 10.1038/nature17629. - DOI - PMC - PubMed

Publication types

MeSH terms

Substances

LinkOut - more resources