. 2021 Feb 18;11(1):4168.
doi: 10.1038/s41598-021-83585-3.

Disease progression modelling from preclinical Alzheimer's disease (AD) to AD dementia

Affiliations

Disease progression modelling from preclinical Alzheimer's disease (AD) to AD dementia

Soo Hyun Cho et al. Sci Rep. .

Abstract

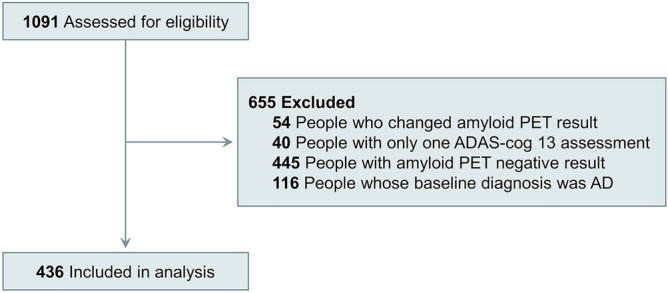
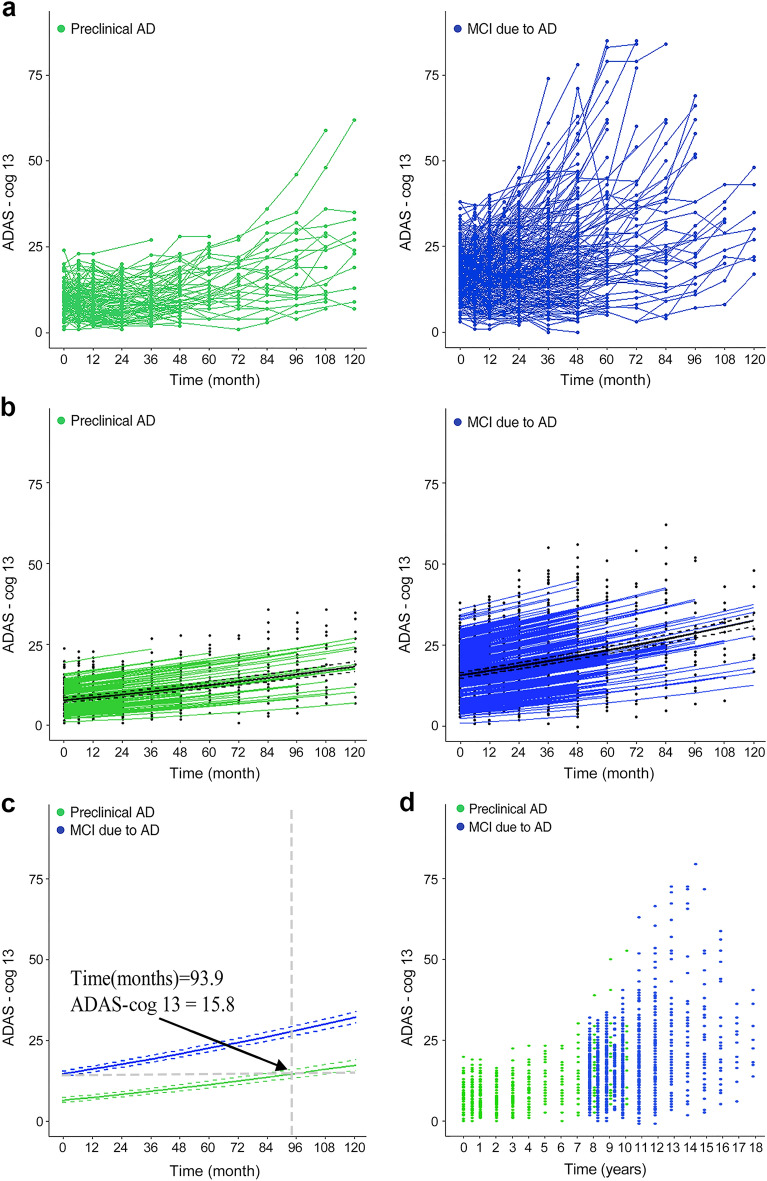
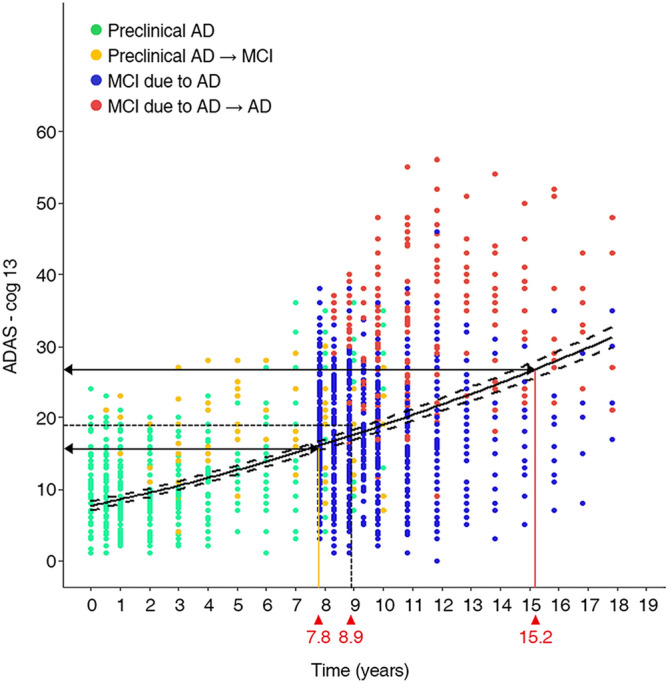
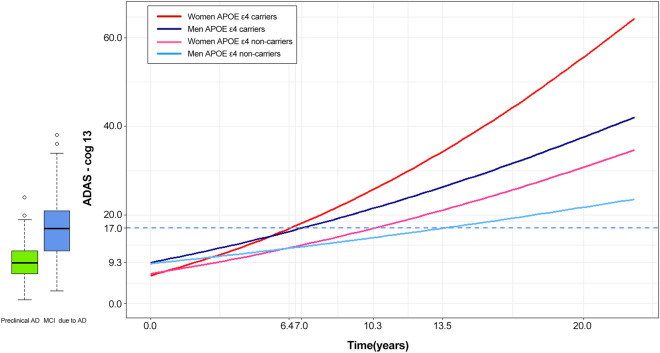
To characterize the course of Alzheimer's disease (AD) over a longer time interval, we aimed to construct a disease course model for the entire span of the disease using two separate cohorts ranging from preclinical AD to AD dementia. We modelled the progression course of 436 patients with AD continuum and investigated the effects of apolipoprotein E ε4 (APOE ε4) and sex on disease progression. To develop a model of progression from preclinical AD to AD dementia, we estimated Alzheimer's Disease Assessment Scale-Cognitive Subscale 13 (ADAS-cog 13) scores. When calculated as the median of ADAS-cog 13 scores for each cohort, the estimated time from preclinical AD to MCI due to AD was 7.8 years and preclinical AD to AD dementia was 15.2 years. ADAS-cog 13 scores deteriorated most rapidly in women APOE ε4 carriers and most slowly in men APOE ε4 non-carriers (p < 0.001). Our results suggest that disease progression modelling from preclinical AD to AD dementia may help clinicians to estimate where patients are in the disease course and provide information on variation in the disease course by sex and APOE ε4 status.


Conflict of interest statement

The authors declare no competing interests.

Figures

Figure 1
Figure 1
Flow diagram for selection of the study participants. We excluded the following participants: (1) 54 participants whose amyloid PET result changed from positive to negative; (2) 40 participants in whom ADAS-cog13 scores were obtained only once; (3) 445 participants with amyloid-negative PET results, because if amyloid-negative CN could become amyloid-positive, it would be difficult to create a disease progression model with amyloid-negative MCI; and (4) 116 participants with dementia at baseline, because their follow-up was short and the ADAS-cog 13 scores of AD dementia participants were in the range of the ADAS-cog 13 scores of participants who progressed from MCI due to AD to AD dementia. ADAS-cog: Alzheimer's Disease Assessment Scale-cognitive subscale, CN: cognitive normal; MCI: mild cognitive impairment; AD: Alzheimer's Disease.
Figure 2
Figure 2
Modelling the course of Alzheimer’s disease using ADAS-cog 13 scores. (a) The pattern of individual ADAS-cog 13 scores in individuals with preclinical AD and MCI due to AD. (b) The estimated ADAS-cog 13 scores over time for each subject and for each cohort, obtained from a linear mixed effects model with time as a fixed effect and subjects as a random effect (excluding outliers). Green and blue lines mean the estimated ADAS-cog 13 score for each subject at the time for preclinical AD and MCI due to AD, respectively. Black solid and dotted lines mean the estimate and 95% confidence interval (CI) for mean ADAS-cog 13 score at the time. (c) The estimated mean ADAS-cog 13 score and the corresponding time for two cohorts to start to overlap. Solid line means the estimated mean ADAS-cog 13 score and dotted lines mean 95% CI of the estimated mean ADAS-cog 13 score. (d) Scatter plot of the combined preclinical AD and MCI due to AD cohorts shifted by the time of 93.9 months, corresponding to an ADAS-cog 13 score of 15.8 points. ADAS-cog: Alzheimer's Disease Assessment Scale-cognitive subscale, MCI: mild cognitive impairment; AD: Alzheimer's Disease.
Figure 3
Figure 3
Disease progression model from preclinical AD to AD dementia. The curves present the estimated model—ADAS-cog 13 = (2.8492 + 0.0130 × month)2 – 0.5 and its 95% CI and the plots show preclinical AD (green dots), progression to MCI due to AD (yellow dots), MCI due to AD (blue dots), and progression to AD dementia (red dots). Using the median ADAS-cog 13 scores at the time of progression for individuals who progressed from preclinical AD to MCI due to AD (16.0 points) and from MCI due to AD to AD dementia (26.8 points), we estimated the time for preclinical AD to progress to MCI due to AD (7.8 years) and to AD dementia (15.2 years). When using the median ADAS-cog 13 scores for late MCI (19.0 points) to estimate time to progression, it took 8.9 years for preclinical AD to progress to late MCI. ADAS-cog: Alzheimer's Disease Assessment Scale-cognitive subscale; MCI: mild cognitive impairment; AD: Alzheimer's Disease; CI: Confidence interval.
Figure 4
Figure 4
Sex and APOE ε4 effects on disease progression. We analysed differences in cognitive decline by sex and APOE ε4 status. Different-coloured lines indicate women APOE ε4 carriers (red), women APOE ε4 non-carriers (pink), men APOE ε4 carriers (dark blue) or men APOE ε4 non-carriers (light blue). The box plot shows the median value of ADAS-cog 13 was 9.3 for preclinical AD and 17.0 for MCI due to AD. The time differences between APOE ε4 carriers and non-carriers at baseline median ADAS-cog 13 in the MCI due to AD cohort (17.0 points) were 3.9 years for women (10.3 years (APOE ε4 non-carriers)—6.4 years (APOE ε4 carriers)) and 6.5 years for men (13.5 years (APOE ε4 non-carriers)—7.0 years (APOE ε4 carriers)). The estimated equation for each sex and APOE ε4 combination is as follows: ADAS Cog-13 = (2.6131 + 0.0203 × month)2 – 0.5 for women APOE ε4 carriers, = (2.6842 + 0.0121 × month)2 – 0.5 for women APOE ε4 non-carriers, = (3.1198 + 0.0127 × month)2 – 0.5 for men APOE ε4 carriers, = (3.0806 + 0.0068 × month)2 – 0.5 for men APOE ε4 non-carriers. ADAS-cog: Alzheimer's Disease Assessment Scale-cognitive subscale; APOE: Apolipoprotein E.

References

    1. Donohue MC, et al. Association between elevated brain amyloid and subsequent cognitive decline among cognitively normal persons. JAMA. 2017;317:2305–2316. doi: 10.1001/jama.2017.6669. - DOI - PMC - PubMed
    1. Ward A, Tardiff S, Dye C, Arrighi HM. Rate of conversion from prodromal Alzheimer's disease to Alzheimer's dementia: A systematic review of the literature. Dement. Geriatr. Cogn. Dis. Extra. 2013;3:320–332. doi: 10.1159/000354370. - DOI - PMC - PubMed
    1. Cho H, et al. Longitudinal changes of cortical thickness in early-versus late-onset Alzheimer's disease. Neurobiol. Aging. 2013;34:1921.e9. doi: 10.1016/j.neurobiolaging.2013.01.004. - DOI - PubMed
    1. Snowdon DA, Nun S. Healthy aging and dementia: Findings from the Nun Study. Ann. Intern. Med. 2003;139:450–454. doi: 10.7326/0003-4819-139-5_Part_2-200309021-00014. - DOI - PubMed
    1. Wolf PA. Contributions of the Framingham Heart Study to stroke and dementia epidemiologic research at 60 years. Arch. Neurol. 2012;69:567–571. doi: 10.1001/archneurol.2011.977. - DOI - PMC - PubMed

Publication types

Substances