

Head-to-head comparison of clustering methods for heterogeneous data: a simulation-driven benchmark
- PMID: 33603019
- PMCID: PMC7892576
- DOI: 10.1038/s41598-021-83340-8
Head-to-head comparison of clustering methods for heterogeneous data: a simulation-driven benchmark
Abstract
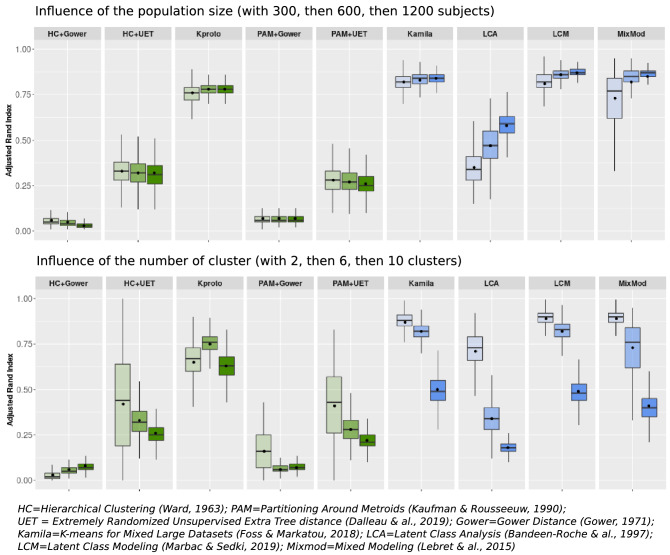
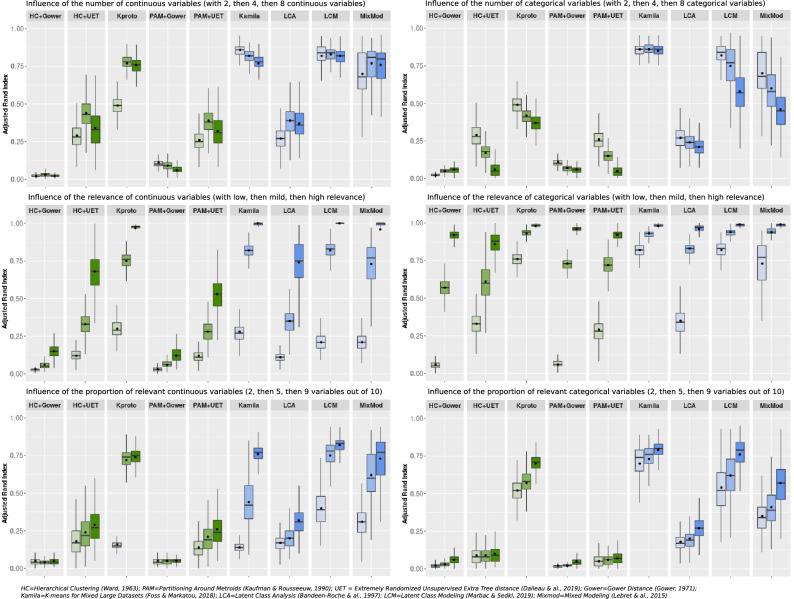
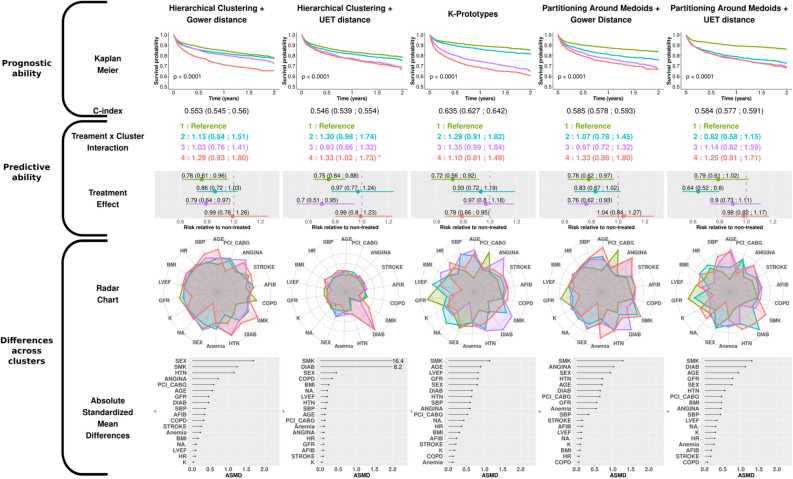
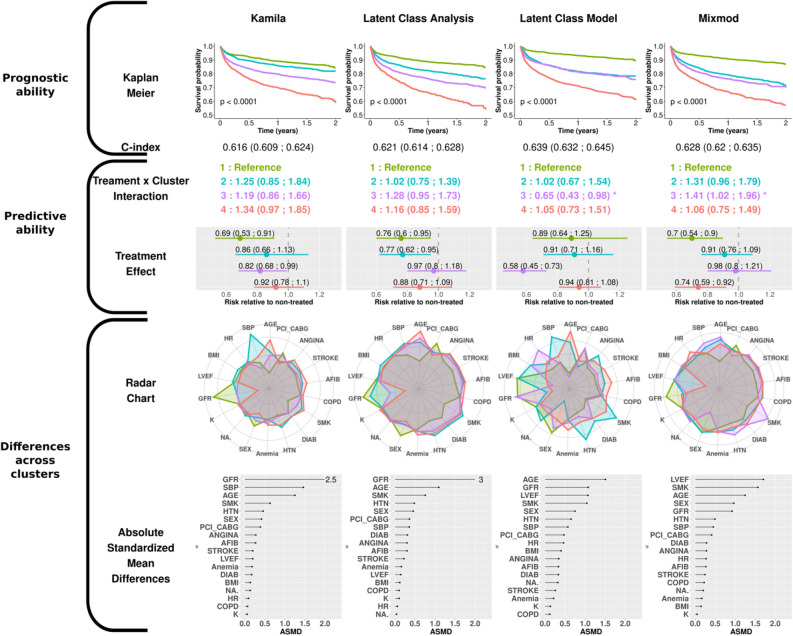
The choice of the most appropriate unsupervised machine-learning method for "heterogeneous" or "mixed" data, i.e. with both continuous and categorical variables, can be challenging. Our aim was to examine the performance of various clustering strategies for mixed data using both simulated and real-life data. We conducted a benchmark analysis of "ready-to-use" tools in R comparing 4 model-based (Kamila algorithm, Latent Class Analysis, Latent Class Model [LCM] and Clustering by Mixture Modeling) and 5 distance/dissimilarity-based (Gower distance or Unsupervised Extra Trees dissimilarity followed by hierarchical clustering or Partitioning Around Medoids, K-prototypes) clustering methods. Clustering performances were assessed by Adjusted Rand Index (ARI) on 1000 generated virtual populations consisting of mixed variables using 7 scenarios with varying population sizes, number of clusters, number of continuous and categorical variables, proportions of relevant (non-noisy) variables and degree of variable relevance (low, mild, high). Clustering methods were then applied on the EPHESUS randomized clinical trial data (a heart failure trial evaluating the effect of eplerenone) allowing to illustrate the differences between different clustering techniques. The simulations revealed the dominance of K-prototypes, Kamila and LCM models over all other methods. Overall, methods using dissimilarity matrices in classical algorithms such as Partitioning Around Medoids and Hierarchical Clustering had a lower ARI compared to model-based methods in all scenarios. When applying clustering methods to a real-life clinical dataset, LCM showed promising results with regard to differences in (1) clinical profiles across clusters, (2) prognostic performance (highest C-index) and (3) identification of patient subgroups with substantial treatment benefit. The present findings suggest key differences in clustering performance between the tested algorithms (limited to tools readily available in R). In most of the tested scenarios, model-based methods (in particular the Kamila and LCM packages) and K-prototypes typically performed best in the setting of heterogeneous data.
Conflict of interest statement
Pr. Rossignol reports grants and personal fees from AstraZeneca, Bayer, CVRx, Fresenius, and Novartis, personal fees from Grunenthal, Servier, Stealth Peptides, Vifor Fresenius Medical Care Renal Pharma, Idorsia, NovoNordisk, Ablative Solutions, G3P, Corvidia, Relypsa. Pr Rossignol and Pr Zannad are the cofounder of CardioRenal. Pr Zannad has received fees for serving on the board of Boston Scientific; consulting fees from Novartis, Takeda, AstraZeneca, Boehringer-Ingelheim, GE Healthcare, Relypsa, Servier, Boston Scientific, Bayer, Johnson & Johnson, and Resmed; and speakers' fees from Pfizer and AstraZeneca. Pr Girerd reports personal fees from Novartis, Astra Zeneca and Boehringer. All other authors declare no competing interest related to this paper.
Figures
References
-
- Ahmad A, Khan SS. Survey of state-of-the-art mixed data clustering algorithms. IEEE Access. 2019;7:31883–31902. doi: 10.1109/ACCESS.2019.2903568. - DOI
-
- Foss AH, Markatou MK. Clustering mixed-type data in R and hadoop. J. Stat. Softw. 2018;83(13):44. doi: 10.18637/jss.v083.i13. - DOI
-
- Foss, A., Markatou, M., & Ray, A. H. A semiparametric method for clustering mixed data. Mach. Learn. 105(3), 419–458 (2016).
-
- Gower JC. A general coefficient of similarity and some of its properties. Biometrics. 1971;27(4):857–871. doi: 10.2307/2528823. - DOI
Publication types
LinkOut - more resources
Full Text Sources
Other Literature Sources
