. 2021 Feb 18;4(1):240.
doi: 10.1038/s42003-021-01796-w.

Temporal association between human upper respiratory and gut bacterial microbiomes during the course of COVID-19 in adults

Affiliations

Temporal association between human upper respiratory and gut bacterial microbiomes during the course of COVID-19 in adults

Rong Xu et al. Commun Biol. .

Abstract

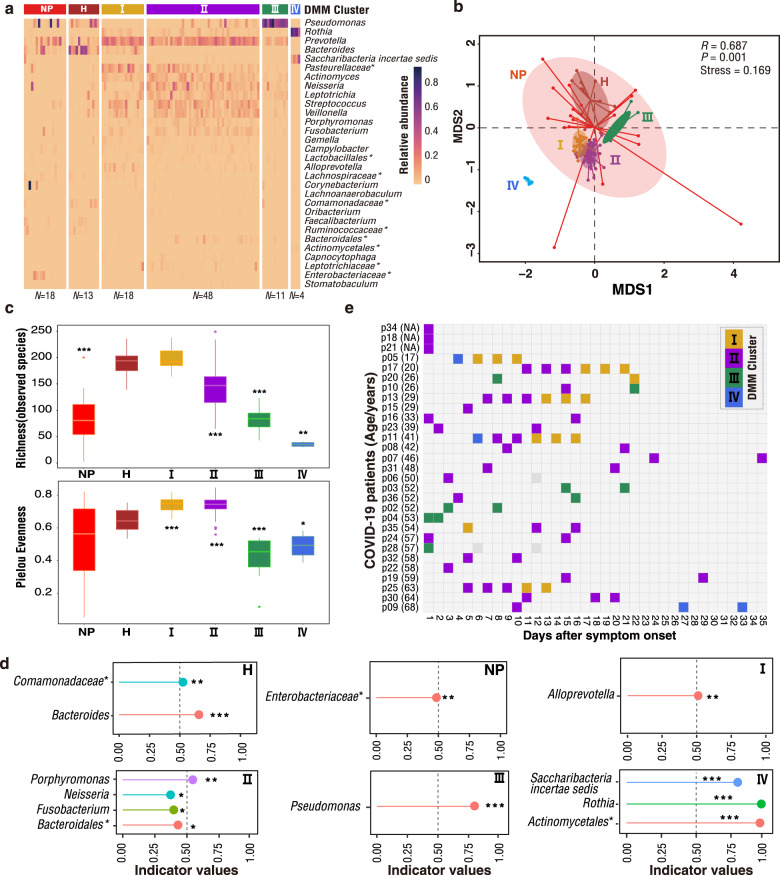
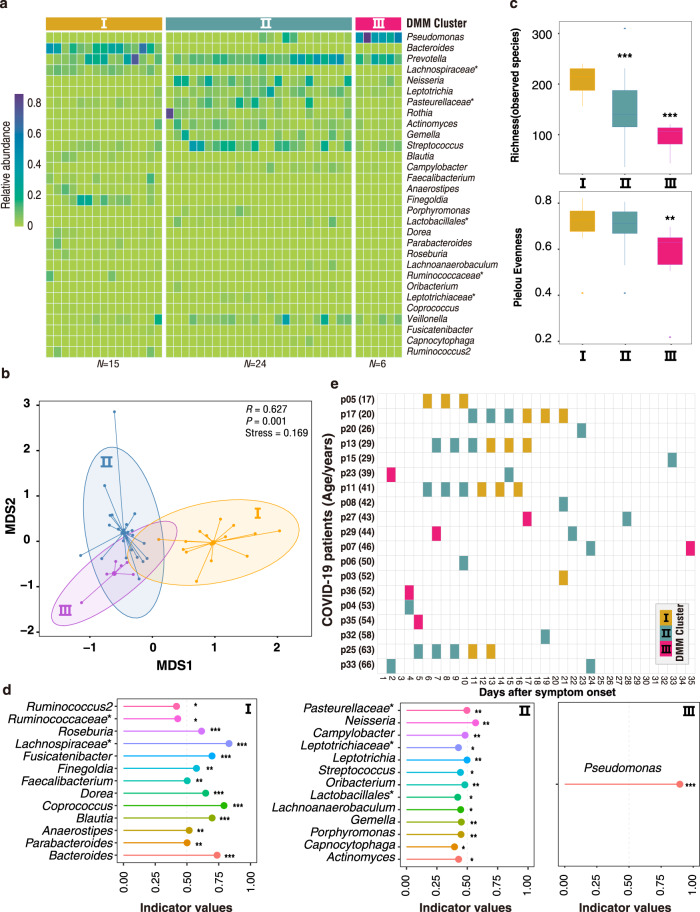
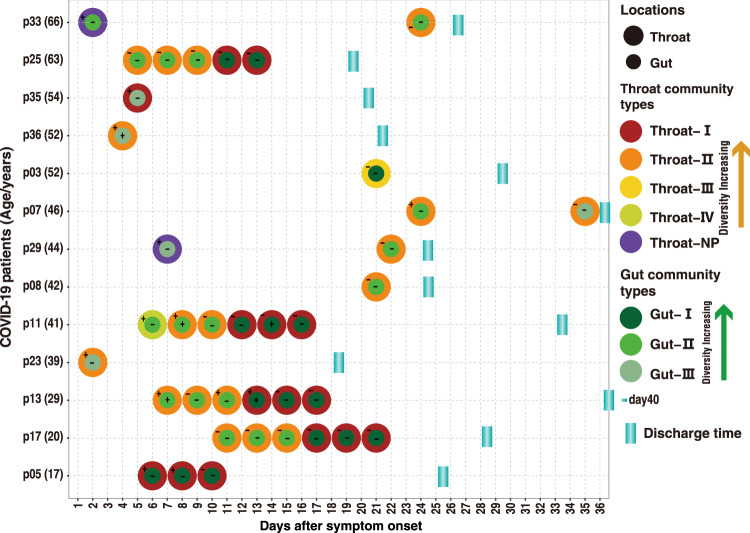
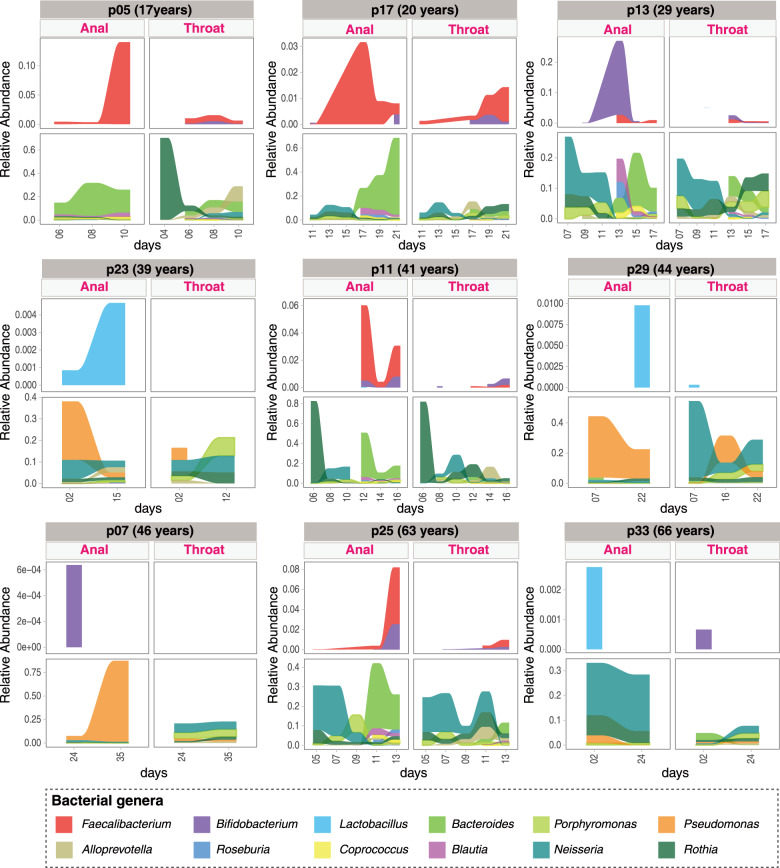
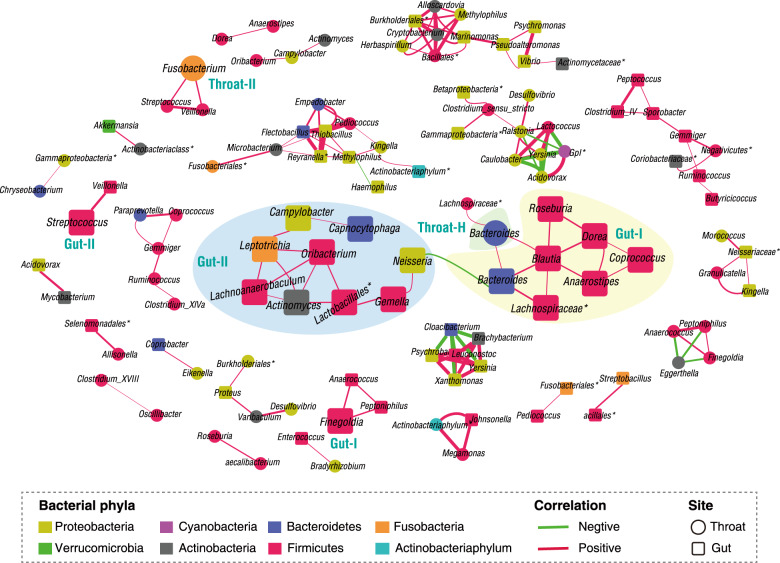
SARS-CoV-2 is the cause of COVID-19. It infects multiple organs including the respiratory tract and gut. Dynamic changes of regional microbiomes in infected adults are largely unknown. Here, we performed longitudinal analyses of throat and anal swabs from 35 COVID-19 and 19 healthy adult controls, as well as 10 non-COVID-19 patients with other diseases, by 16 S rRNA gene sequencing. The results showed a partitioning of the patients into 3-4 categories based on microbial community types (I-IV) in both sites. The bacterial diversity was lower in COVID-19 patients than healthy controls and decreased gradually from community type I to III/IV. Although the dynamic change of microbiome was complex during COVID-19, a synchronous restoration of both the upper respiratory and gut microbiomes from early dysbiosis towards late more diverse status was observed in 6/8 mild COVID-19 adult patients. These findings reveal previously unknown interactions between upper respiratory and gut microbiomes during COVID-19.


Conflict of interest statement

The authors declare no competing interests.

Figures

Fig. 1
Fig. 1. DMM clustering of 16 S rRNA gene-sequencing data of throat microbiota (N = 112).
Dirichlet multinomial mixtures (DMM) modelling was applied to 16 S rRNA gene sequencing. The entire dataset formed six distinct clusters based on lowest Laplace approximation. Bacterial taxa marked by the stars represent unclassified bacteria genera. a Heatmap showing the relative abundance of the 30 most dominant bacterial genera per DMM cluster. The stars represent unclassified genera. NP, enriched in Non-COVID-19 patients. H, enriched in Healthy individuals. I–IV enriched in COVID-19 patients. b Nonmetric multidimensional scaling (NMDS) visualization of DMM clusters using Bray–Curtis distance of throat bacterial genera. The ANOSIM statistic R closer to 1 with <0.05 P-value suggest significant separation of microbial community structures. The stress value that was lower than 0.2 provides a good representation in reduced dimensions. c Boxplots showing the alpha-diversity (richness and evenness) per each DMM cluster. d Indicators of airway microbial community types (DMM clusters) identified from top 30 genus contributing to throat microbial community typing (DMM clustering) in a. The length of lines represents the indicator value. *P < 0.05, **P < 0.01, and ***P < 0.001. e Dynamic shift of four throat microbial community types (DMM clusters) in different COVID-19 stages. Empty boxes indicate samples were unavailable in COVID-19 patients. Ages (years) were shown in parenthesis. NA unavailable.
Fig. 2
Fig. 2. DMM clustering of 16 S rRNA gene-sequencing data of gut microbiota (N = 45).
Dirichlet multinomial mixtures (DMM) modelling was applied to 16 S rRNA gene sequencing. The entire dataset formed three distinct clusters based on lowest Laplace approximation. All samples were collected from COVID-19 patients. Bacterial taxa marked by the stars represent unclassified bacteria genera. a Heatmap showing the relative abundance of the 30 most dominant bacterial genera per DMM cluster. b Nonmetric multidimensional scaling (NMDS) visualization of DMM clusters using Bray–Curtis distance of gut bacterial genera. The ANOSIM statistic R closer to 1 with <0.05 P-value suggest significant separation of microbial community structures. The stress value that was lower than 0.2 provides a good representation in reduced dimensions. c Boxplots showing the alpha-diversity (richness and evenness) per each DMM cluster. d Indicators of gut microbial community types (DMM clusters) identified from top 30 genus contributing to gut microbial community typing (DMM clustering) in a. *P < 0.05, **P < 0.01, and ***P < 0.001. e Dynamic shift of gut microbial community types (DMM clusters) in different COVID-19 stages. Empty boxes indicate samples were unavailable in COVID-19 patients. Ages (years) were shown in parenthesis.
Fig. 3
Fig. 3. Dynamic change of bacterial community types (DMM clusters) in respiratory tract and gut of patients with mild COVID-19.
Covariation dynamics of throat and gut microbial communities of 13 COVID-19 patients. Filled circles indicate the presence of microbial community types. Positive or Negative detections of SARS–CoV-2 in gut or throat are implicated by + or − symbols, respectively. Age (years) of each COVID-19 adult was shown in brackets.
Fig. 4
Fig. 4. Dynamic change of 12 key taxa in respiratory tract and gut of patients with mild COVID-19.
Key taxa of DMM clusters and several core functional gut bacteria were shown in nine mild COVID-19 adults with at least two timepoints of sampling. Linked to Fig. 1a, Fig.2a, and Supplementary Figs. S4 and S7.
Fig. 5
Fig. 5. Co-occurrence networks of gut and throat microbiota within 13 COVID-19 patients.
Pearson correlation was employed to calculate correlation coefficient (r) between bacterial genus pairs based on their relative abundances. Co-occurred pairs with r > 0.7 under FDR-adjusted P < 0.05 were shown and visualized by Cytoscape version 3.8.0. Edges were sized based on r values. The bigger squares or circles were indicators in Figs. 1d and 2d.

References

    1. Zhu N, et al. A novel coronavirus from patients with pneumonia in China, 2019. N. Engl. J. Med. 2020;382:727–733. doi: 10.1056/NEJMoa2001017. - DOI - PMC - PubMed
    1. Zhou P, et al. A pneumonia outbreak associated with a new coronavirus of probable bat origin. Nature. 2020;579:270–273. doi: 10.1038/s41586-020-2012-7. - DOI - PMC - PubMed
    1. Wu ZY, McGoogan JM. Characteristics of and important lessons from the Coronavirus Disease 2019 (COVID-19) outbreak in China smmary of a report of 72 314 cases from the Chinese Center for Disease Control and Prevention. JAMA. 2020;323:1239–1242. doi: 10.1001/jama.2020.2648. - DOI - PubMed
    1. Guan W, et al. Clinical characteristics of Coronavirus Disease 2019 in China. N. Engl. J. Med. 2020;382:1708–1720. doi: 10.1056/NEJMoa2002032. - DOI - PMC - PubMed
    1. Honda K, Littman DR. The microbiota in adaptive immune homeostasis and disease. Nature. 2016;535:75–84. doi: 10.1038/nature18848. - DOI - PubMed

Publication types

Substances