. 2021 Feb 18;11(1):4169.
doi: 10.1038/s41598-021-83847-0.

Potential of spectroscopic analyses for non-destructive estimation of tea quality-related metabolites in fresh new leaves

Affiliations

Potential of spectroscopic analyses for non-destructive estimation of tea quality-related metabolites in fresh new leaves

Hiroto Yamashita et al. Sci Rep. .

Abstract

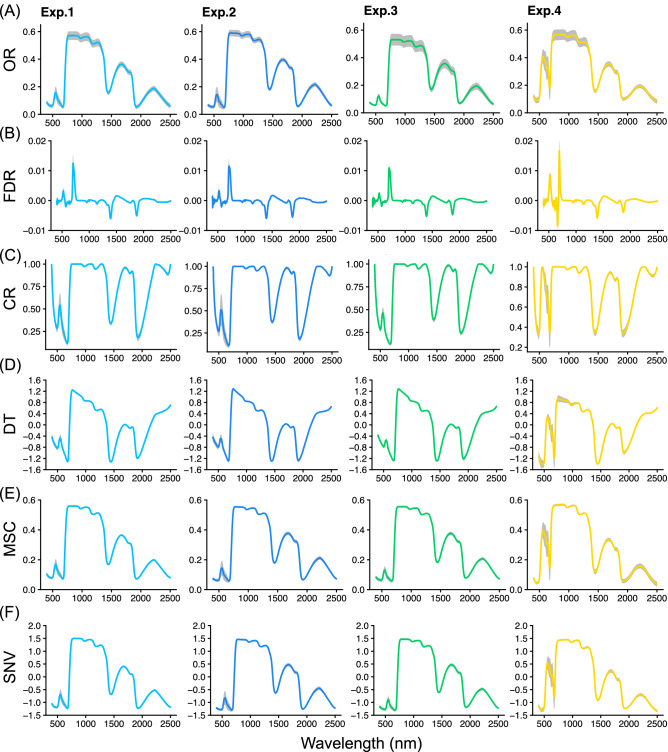
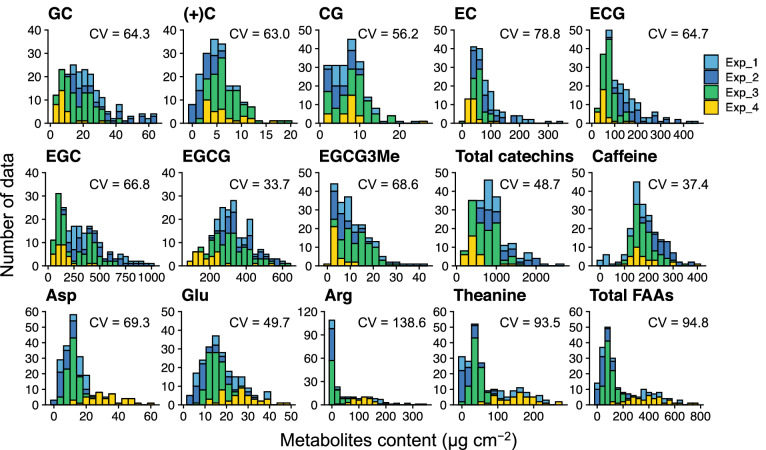
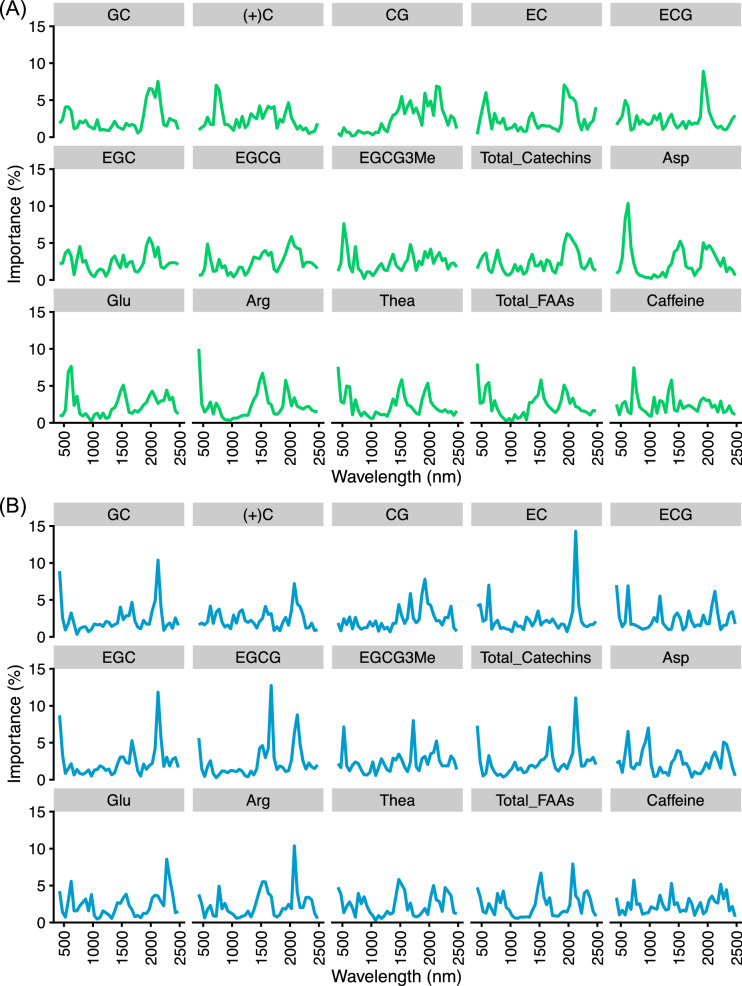
Spectroscopic sensing provides physical and chemical information in a non-destructive and rapid manner. To develop non-destructive estimation methods of tea quality-related metabolites in fresh leaves, we estimated the contents of free amino acids, catechins, and caffeine in fresh tea leaves using visible to short-wave infrared hyperspectral reflectance data and machine learning algorithms. We acquired these data from approximately 200 new leaves with various status and then constructed the regression model in the combination of six spectral patterns with pre-processing and five algorithms. In most phenotypes, the combination of de-trending pre-processing and Cubist algorithms was robustly selected as the best combination in each round over 100 repetitions that were evaluated based on the ratio of performance to deviation (RPD) values. The mean RPD values were ranged from 1.1 to 2.7 and most of them were above the acceptable or accurate threshold (RPD = 1.4 or 2.0, respectively). Data-based sensitivity analysis identified the important hyperspectral regions around 1500 and 2000 nm. Present spectroscopic approaches indicate that most tea quality-related metabolites can be estimated non-destructively, and pre-processing techniques help to improve its accuracy.


Conflict of interest statement

The authors declare no competing interests.

Figures

Figure 1
Figure 1
Pre-processing spectral patterns of original reflectance (OR) in tea leaves. Five pre-processing techniques were applied to the OR (A) base: first derivative reflectance (FDR, B), continuum-removed (CR, C), de-trending (DT, D), multiplicative scatter correction (MSC, E), and standard normal variate transformation (SNV, F). Colors in spectra (Exp. 1, light blue; Exp. 2, blue; Exp. 3, green; Exp. 4, yellow) and gray indicate mean and standard deviation, respectively. Figures were visualized by the R package “ggplot2” ver. 3.3.2.
Figure 2
Figure 2
Data distribution of 15 phenotypes for tea quality-related metabolites. Number of samples: 201, 201, and 215 for catechins, caffeine and free amino acids (FAA), respectively. Coefficient of variation (CV) value for each metabolite is included on the Figure. Figures were visualized by the R package “ggplot2” ver. 3.3.2.
Figure 3
Figure 3
Model performance and robustness based on OR-Cubist and DT-Cubist for tea quality-related metabolites. The ratio of performance to deviation (RPD, A) and coefficient of determination (R2, B) were applied to evaluate the accuracy of each model. A stratified sampling approach for modelling was repeated 100 times to obtain robust results. Figure are plots of the RPD and R2 values in each repeat. Orange and blue lines indicate RPD values of 1.4 and 2.0, respectively, as accuracy thresholds. Statistical tests for significant differences by two-way ANOVA are shown on the right side of the Figure. Figures were visualized by the R package “ggplot2” ver. 3.3.2.
Figure 4
Figure 4
Detection of important hyperspectral regions by data-based sensitive analysis (DSA). Importance values, which were averaged over 100 replicates and accumulated at 50-nm intervals, were visualized as DSA results based on OR-Cubist (A) and DT-Cubist (B) treatment. Figures were visualized by the R package “ggplot2” ver. 3.3.2.

References

    1. Dixon RA, Strack D. Phytochemistry meets genome analysis, and beyond. Phytochemistry. 2003;62:815–816. doi: 10.1016/S0031-9422(02)00712-4. - DOI - PubMed
    1. Afendi FM, et al. Data mining methods for omics and knowledge of crude medicinal plants toward big data biology. Comput. Struct. Biotechnol. J. 2013;4:e201301010. doi: 10.5936/csbj.201301010. - DOI - PMC - PubMed
    1. Weng J-K. The evolutionary paths towards complexity: A metabolic perspective. New Phytol. 2014;201:1141–1149. doi: 10.1111/nph.12416. - DOI - PubMed
    1. Rai A, Saito K, Yamazaki M. Integrated omics analysis of specialized metabolism in medicinal plants. Plant J. 2017;90:764–787. doi: 10.1111/tpj.13485. - DOI - PubMed
    1. Fang C, Fernie AR, Luo J. Exploring the diversity of plant metabolism. Trends Plant Sci. 2019;24:83–98. doi: 10.1016/j.tplants.2018.09.006. - DOI - PubMed

Publication types

LinkOut - more resources