. 2021 Feb 18;4(1):29.
doi: 10.1038/s41746-021-00399-3.

CovidCTNet: an open-source deep learning approach to diagnose covid-19 using small cohort of CT images

Affiliations

CovidCTNet: an open-source deep learning approach to diagnose covid-19 using small cohort of CT images

Tahereh Javaheri et al. NPJ Digit Med. .

Abstract

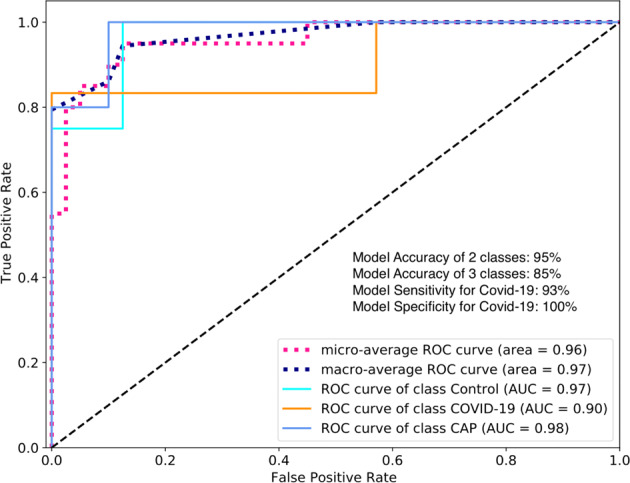
Coronavirus disease 2019 (Covid-19) is highly contagious with limited treatment options. Early and accurate diagnosis of Covid-19 is crucial in reducing the spread of the disease and its accompanied mortality. Currently, detection by reverse transcriptase-polymerase chain reaction (RT-PCR) is the gold standard of outpatient and inpatient detection of Covid-19. RT-PCR is a rapid method; however, its accuracy in detection is only ~70-75%. Another approved strategy is computed tomography (CT) imaging. CT imaging has a much higher sensitivity of ~80-98%, but similar accuracy of 70%. To enhance the accuracy of CT imaging detection, we developed an open-source framework, CovidCTNet, composed of a set of deep learning algorithms that accurately differentiates Covid-19 from community-acquired pneumonia (CAP) and other lung diseases. CovidCTNet increases the accuracy of CT imaging detection to 95% compared to radiologists (70%). CovidCTNet is designed to work with heterogeneous and small sample sizes independent of the CT imaging hardware. To facilitate the detection of Covid-19 globally and assist radiologists and physicians in the screening process, we are releasing all algorithms and model parameter details as open-source. Open-source sharing of CovidCTNet enables developers to rapidly improve and optimize services while preserving user privacy and data ownership.


Conflict of interest statement

The authors declare no competing interests.

Figures

Fig. 1
Fig. 1. BCDU-Net increases the robustness of the CNN model.
a To show the effect of BCDU-Net on the preprocessing, the procedure was done with and without applying BCDU-Net/Perlin noise. The outcome of the model is presented with respect to loss and accuracy. b The confusion matrix and other classification related metrics in detail. The results shown in this figure are based on just 50 randomly selected cases for each class of Covid versus non-Covid.
Fig. 2
Fig. 2. Covid-19 and CAP infection extraction by BCDU-Net.
The filtered images (left) will be used for classification by CNN. An unprocessed 3D image of the whole lung infected with Covid-19 is shown in Fig. 3a. The same image was processed with BCDU-Net to remove non lung-related parts and to extract and highlight the Covid-19 infection (Fig. 3b).
Fig. 3
Fig. 3. Schematic representation of BCDU-Net module to detect the infection in CT images.
a The original CT images visualized in point cloud. b Reconstructed lung image acquired by feeding the CT slices (Fig. 8 middle part h) into BCDU-Net. The Covid-19 infection area is highlighted in b.
Fig. 4
Fig. 4. Performance of CovidCTNet in detecting Control, Covid-19, and CAP.
The model’s AUC for Covid-19 detection is 0.94 (n = 15 cases). The accuracy, sensitivity, and specificity of the model are shown. The model operation in three classes demonstrates the detection of all three classes including Covid-19 versus CAP and versus Control and in two classes indicates the detection of Covid-19 as one class versus non-Covid-19 (CAP and Control) as second class.
Fig. 5
Fig. 5. Comparison of the outcome of CovidCTNet versus reader study.
Performance of model and radiologists (reader) in a pool of chest CT dataset mixed of control, Covid-19 and CAP. AUC of Covid-19 is 0.90 (n = 20 cases). The accuracy, sensitivity, and specificity of readers versus model are shown. The model operation in three classes demonstrates the detection of all three classes including Covid-19, CAP, and control separately and in two classes indicates the detection of Covid-19 as one class versus CAP and control as second class. While macroaverage takes the metric of each class independently and computes their average, the microaverage computes the average metric after aggregating the contributions of all classes.
Fig. 6
Fig. 6. Representative examples of CT images used to test the performance of CovidCTNet versus radiologists.
a A CT image of CAP. This image is misidentified as Covid-19 or control by two out of four radiologists and correctly diagnosed by CovidCTNet. b A CT image of control, that was misdiagnosed by three out of four radiologists as Covid-19 or CAP and correctly diagnosed by CovidCTNet as control. c A sample of Covid-19 that was detected as Control by CovidCTNet and as Control or CAP by three out of the entire panel of radiologists (four members). d Image of control that was misdiagnosed by the CovidCTNet as CAP and by two radiologists as Covid-19 or control. Note that, in this figure one single slide of the entire scan is shown as a representative of all CT images of a patient.
Fig. 7
Fig. 7. Schematic representation of the pre-processing phases.
a Each patient’s CT image (3D) was resampled to isomorphic resolution, while x and y are the image coordinates and z represents the number of slices. b All CT slices (2D) with different sizes were resized to have 128 × 128 pixels on the x and y axis, but the z axis that depicts the number of slices remained intact. Here, a 512 × 512 pixels CT slice is resized into a 128 × 128 pixels CT slice.
Fig. 8
Fig. 8. Multistep pipeline of deep learning algorithms to detect Covid-19 from CT images.
Upper part, Training step of the model for learning the structure of Control CT slices. Middle part, Images subtracting and lung reconstructing from CT slices with highlighted Covid-19 or CAP infection (violet color). The results of step “i” are a 2D image. The slices at z axis concatenate to generate 3D CT image, the input of CNN model. Lower part, CNN model classifies the images that were constructed in the previous stage. To integrate this pipeline into an application the user needs to start from stage (middle part) and then the CNN algorithm recognizes whether the given CT images of a given patient presents Covid-19, CAP, or control. The number outside the parentheses in CNN model, present the number of channels in the CNN model.

References

    1. Fraser C, et al. Pandemic potential of a strain of influenza A (H1N1): early findings. Science. 2009;324:1557–1561. doi: 10.1126/science.1176062. - DOI - PMC - PubMed
    1. WHO Coronavirus disease (COVID-19) pandemic https://www.who.int/emergencies/diseases/novel-coronavirus-2019 Accessed 15 Aug 2020.
    1. Kobayashi T, et al. Communicating the risk of death from novel coronavirus disease (COVID-19) J. Clin. Med. 2020;9:580. doi: 10.3390/jcm9020580. - DOI - PMC - PubMed
    1. Riou J, Althaus CL. Pattern of early human-to-human transmission of Wuhan 2019 novel coronavirus (2019-nCoV), December 2019 to January 2020. Eurosurveillance. 2020;25:2000058. doi: 10.2807/1560-7917.ES.2020.25.4.2000058. - DOI - PMC - PubMed
    1. Park, M., Thwaites, R. S. & Openshaw, P. J. M. COVID-19: lessons from SARS and MERS. Eur. J. Immunol.10.1002/eji.202070035 (2020).

LinkOut - more resources