. 2022 Apr;40(4):517-526.
doi: 10.1038/s41587-021-00830-w. Epub 2021 Feb 18.

Robust decomposition of cell type mixtures in spatial transcriptomics

Affiliations

Robust decomposition of cell type mixtures in spatial transcriptomics

Dylan M Cable et al. Nat Biotechnol. 2022 Apr.

Abstract

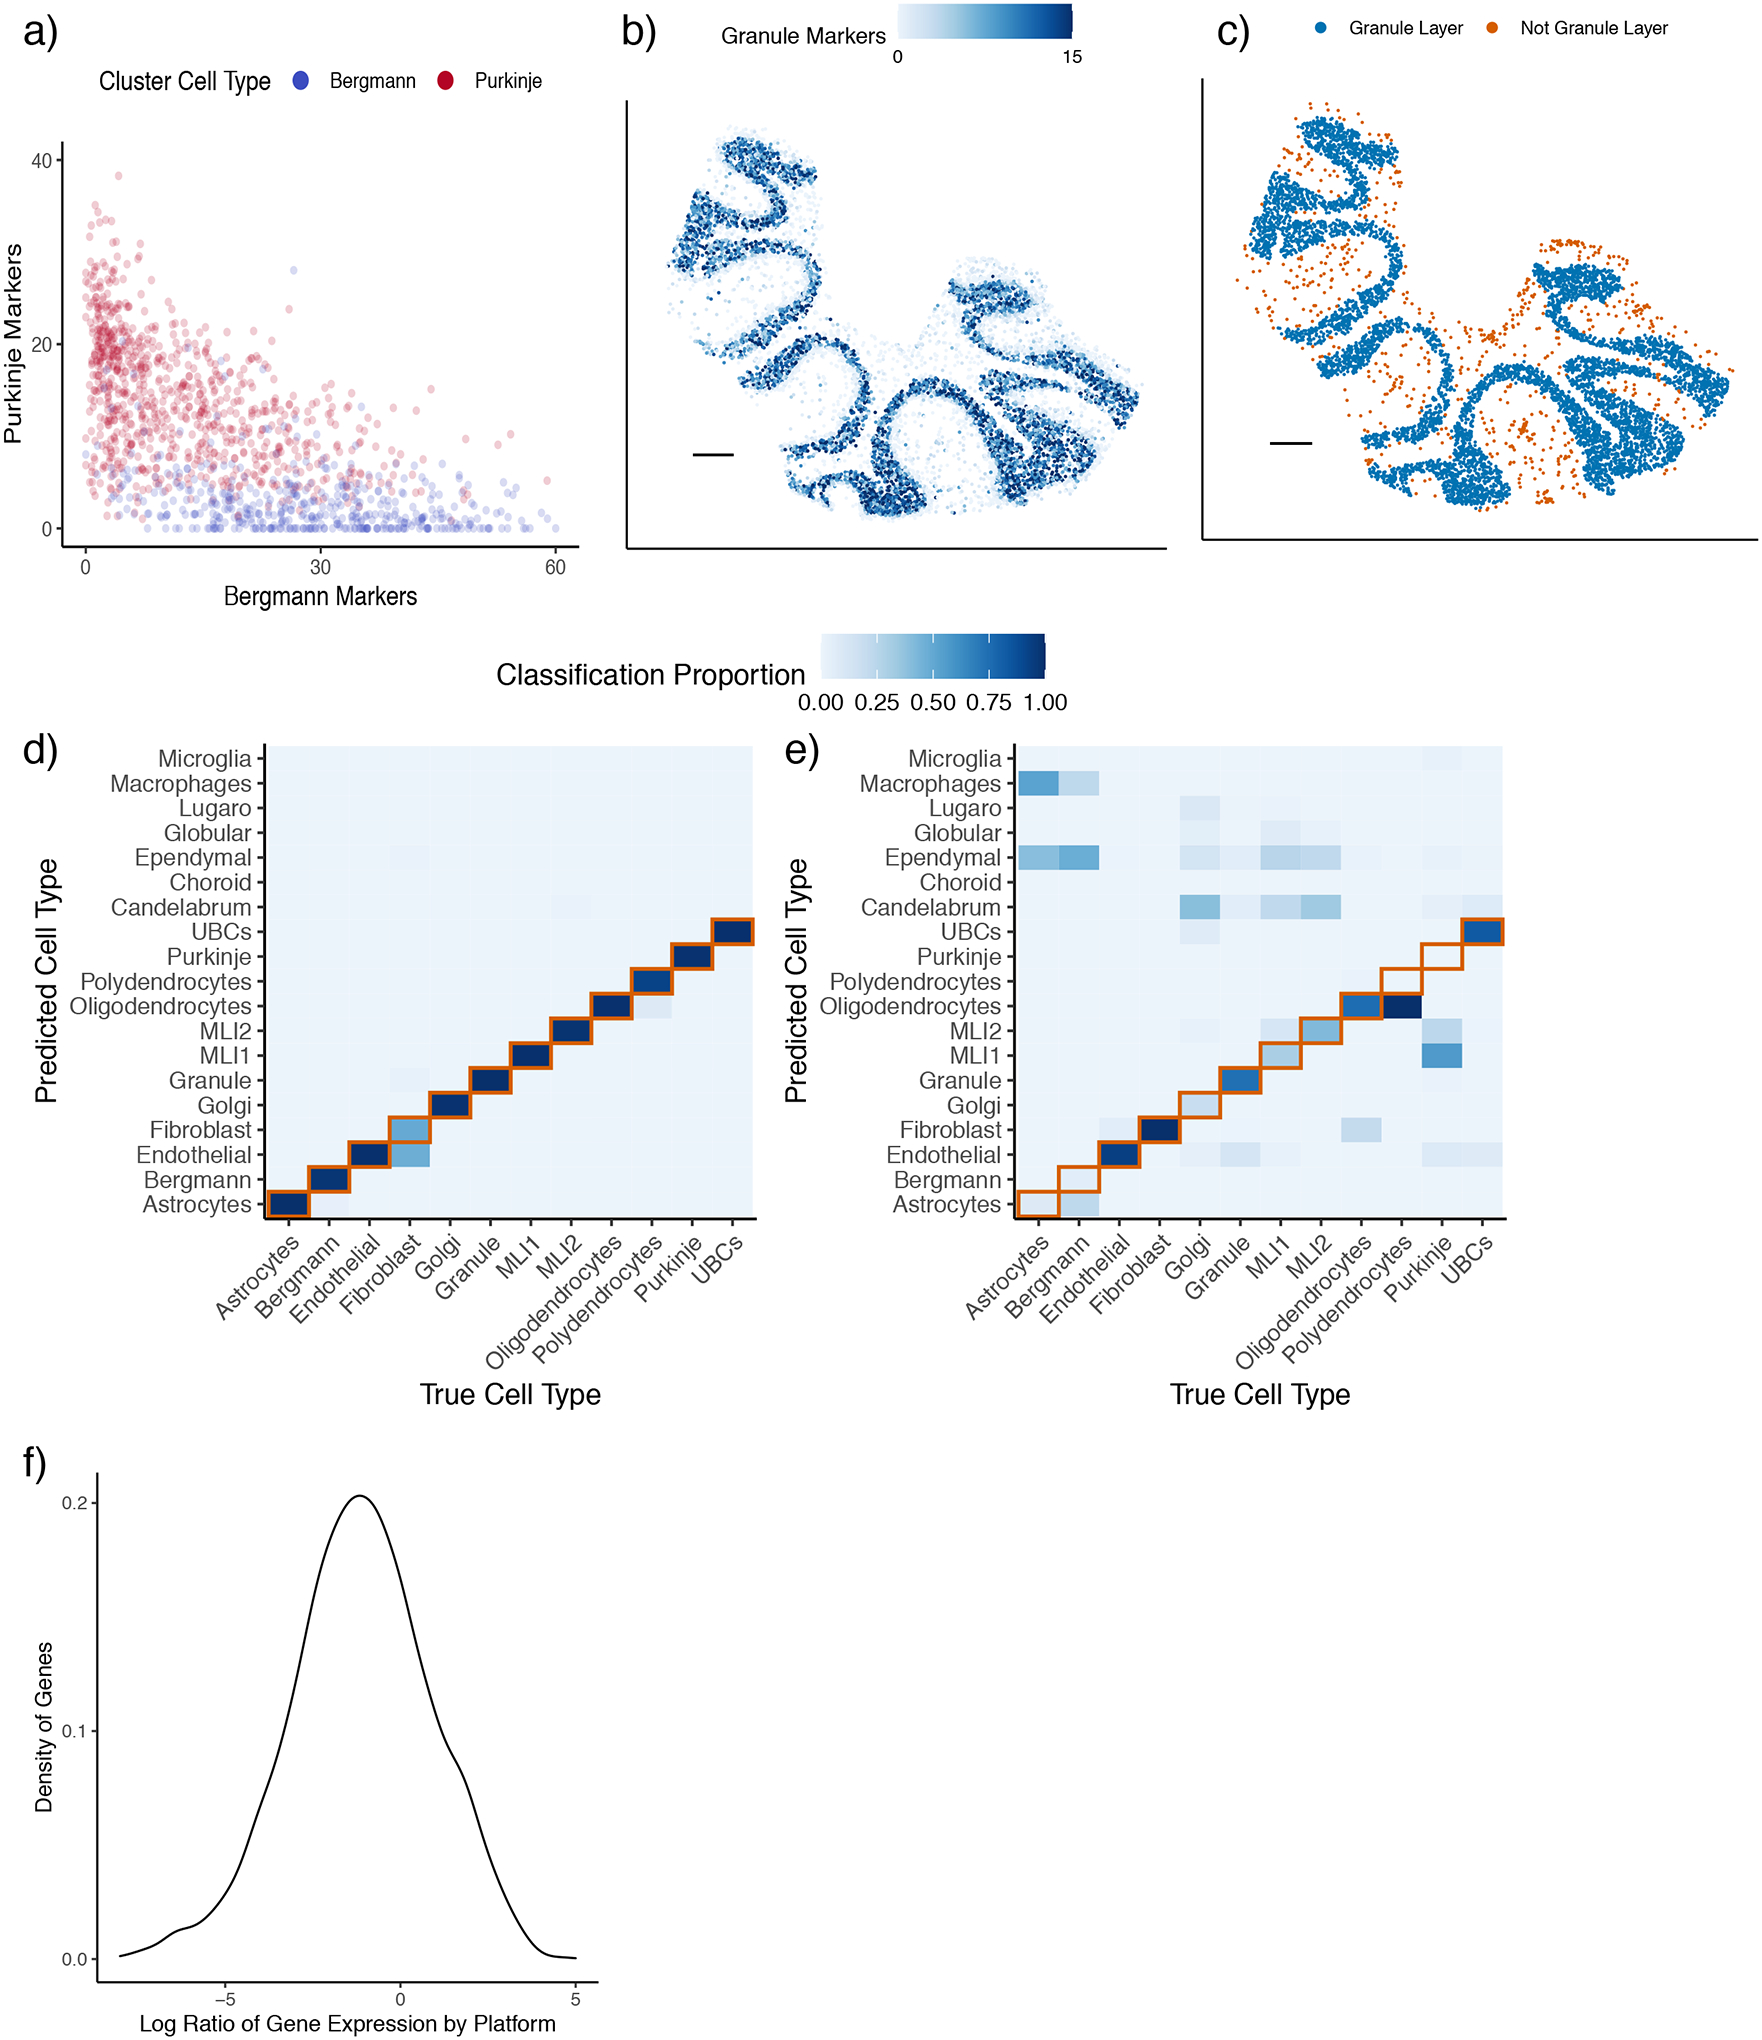
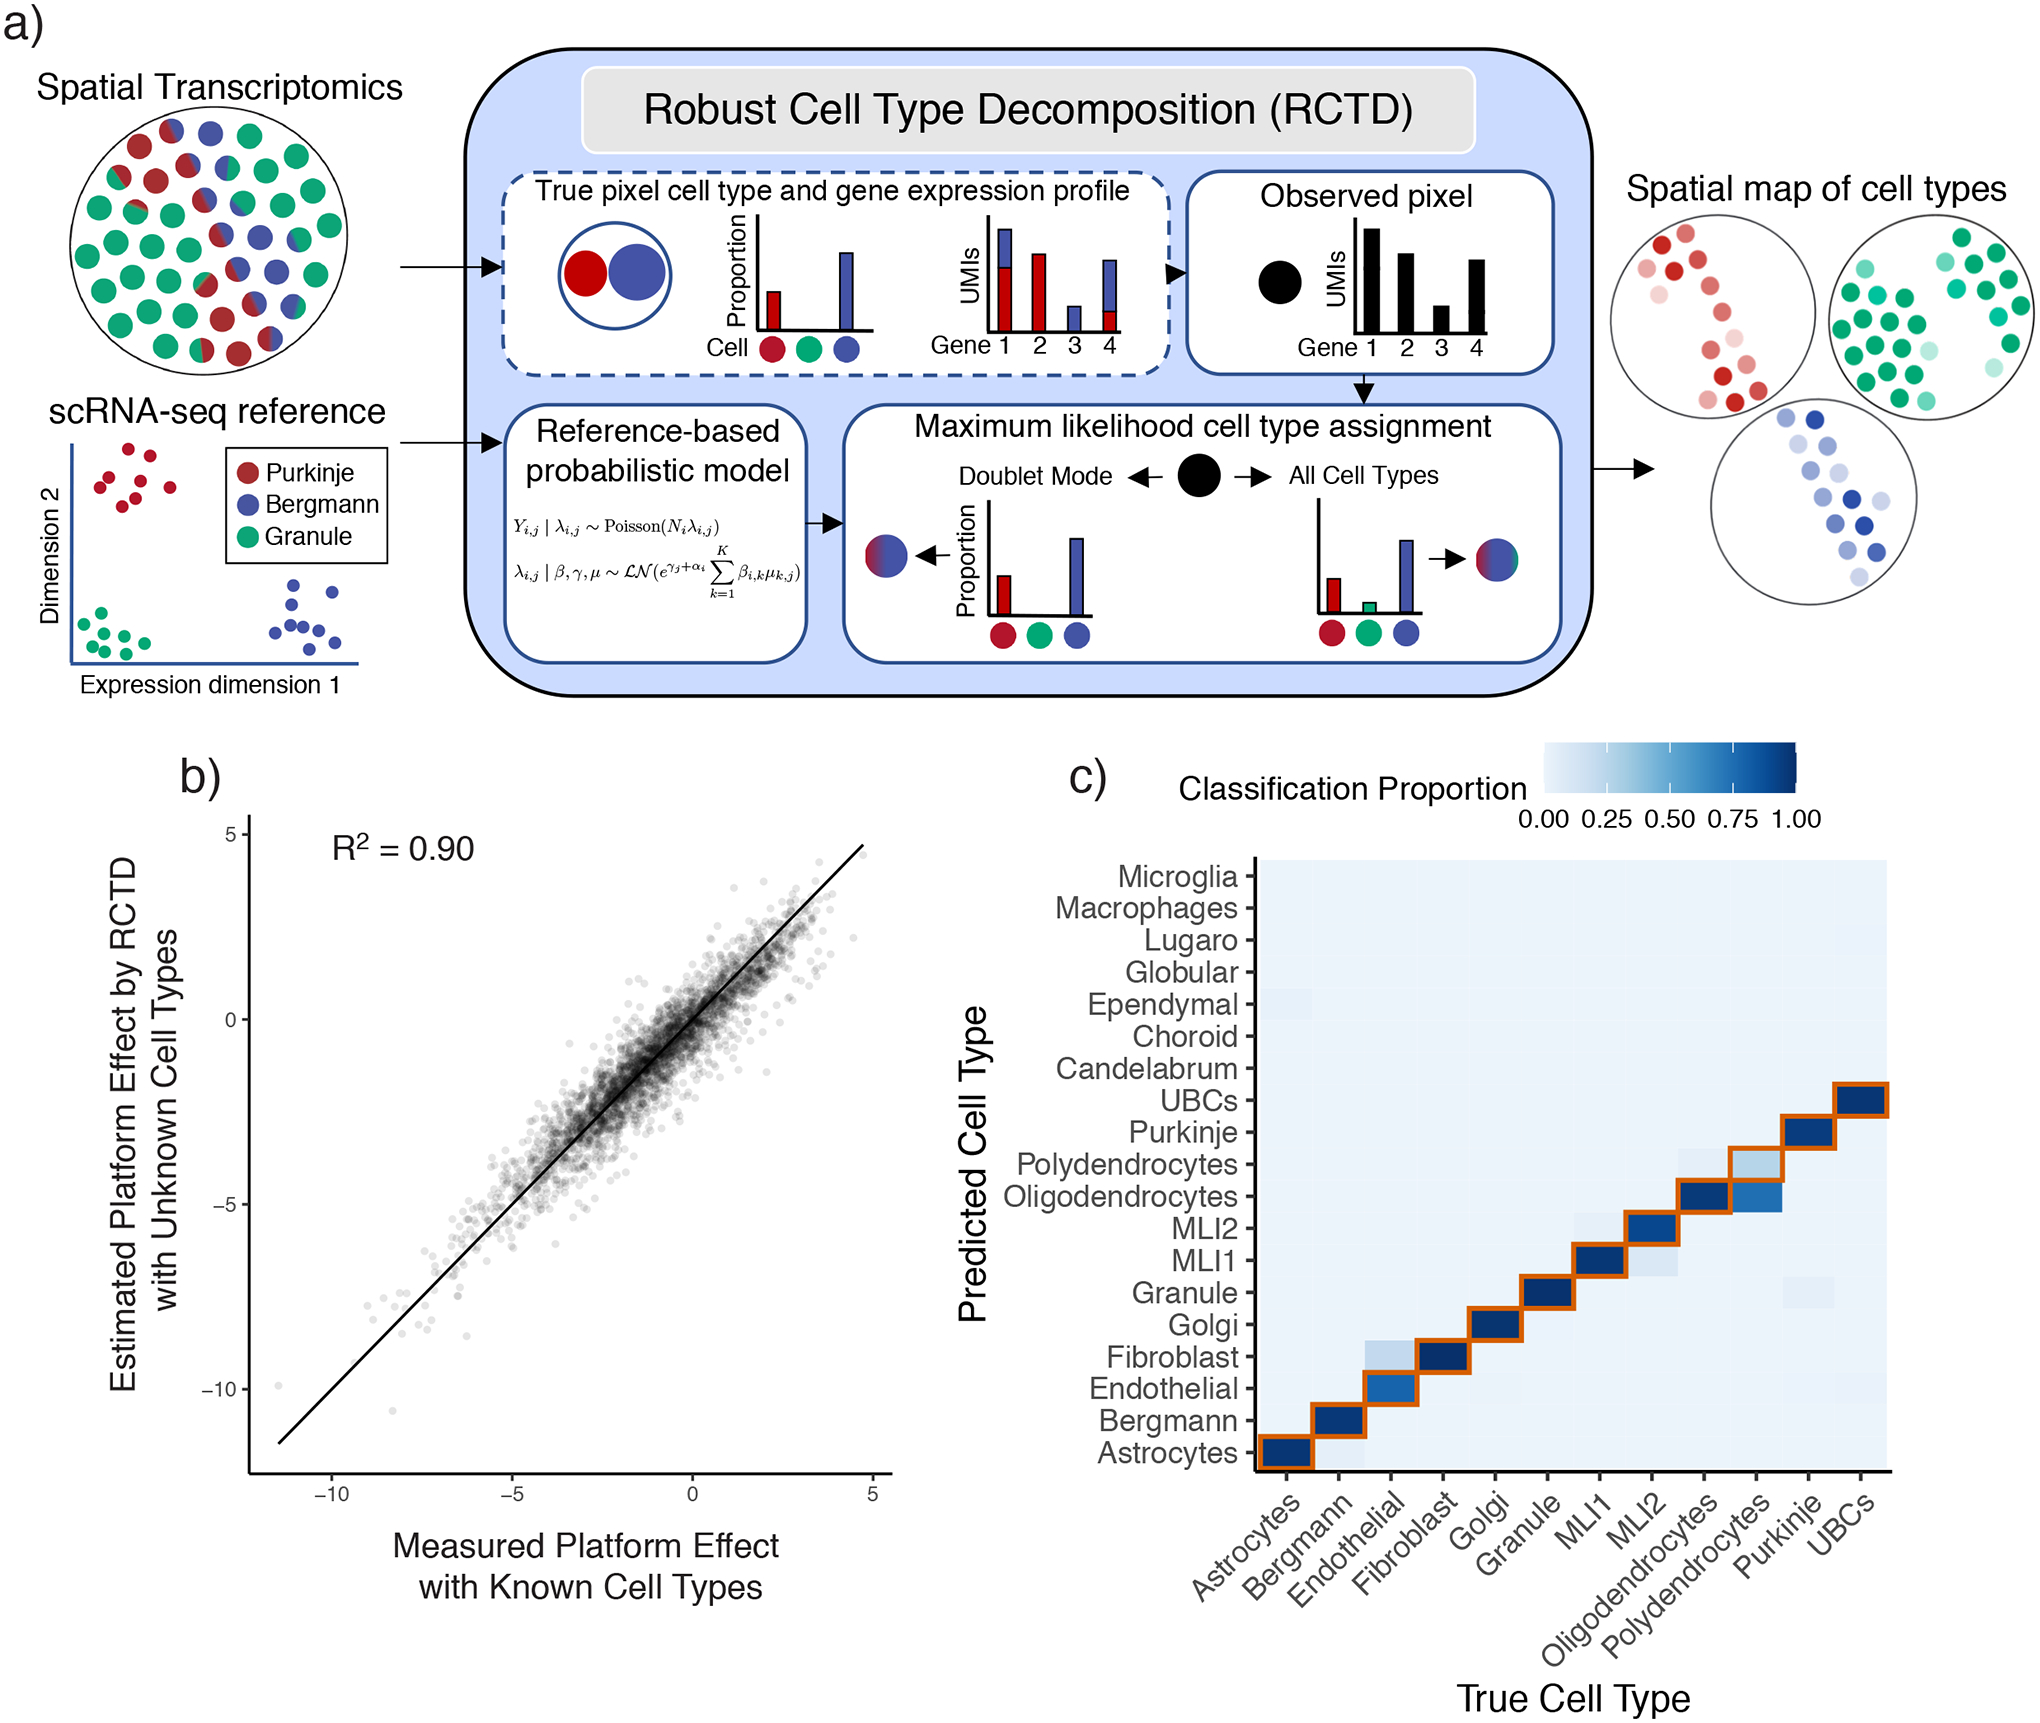
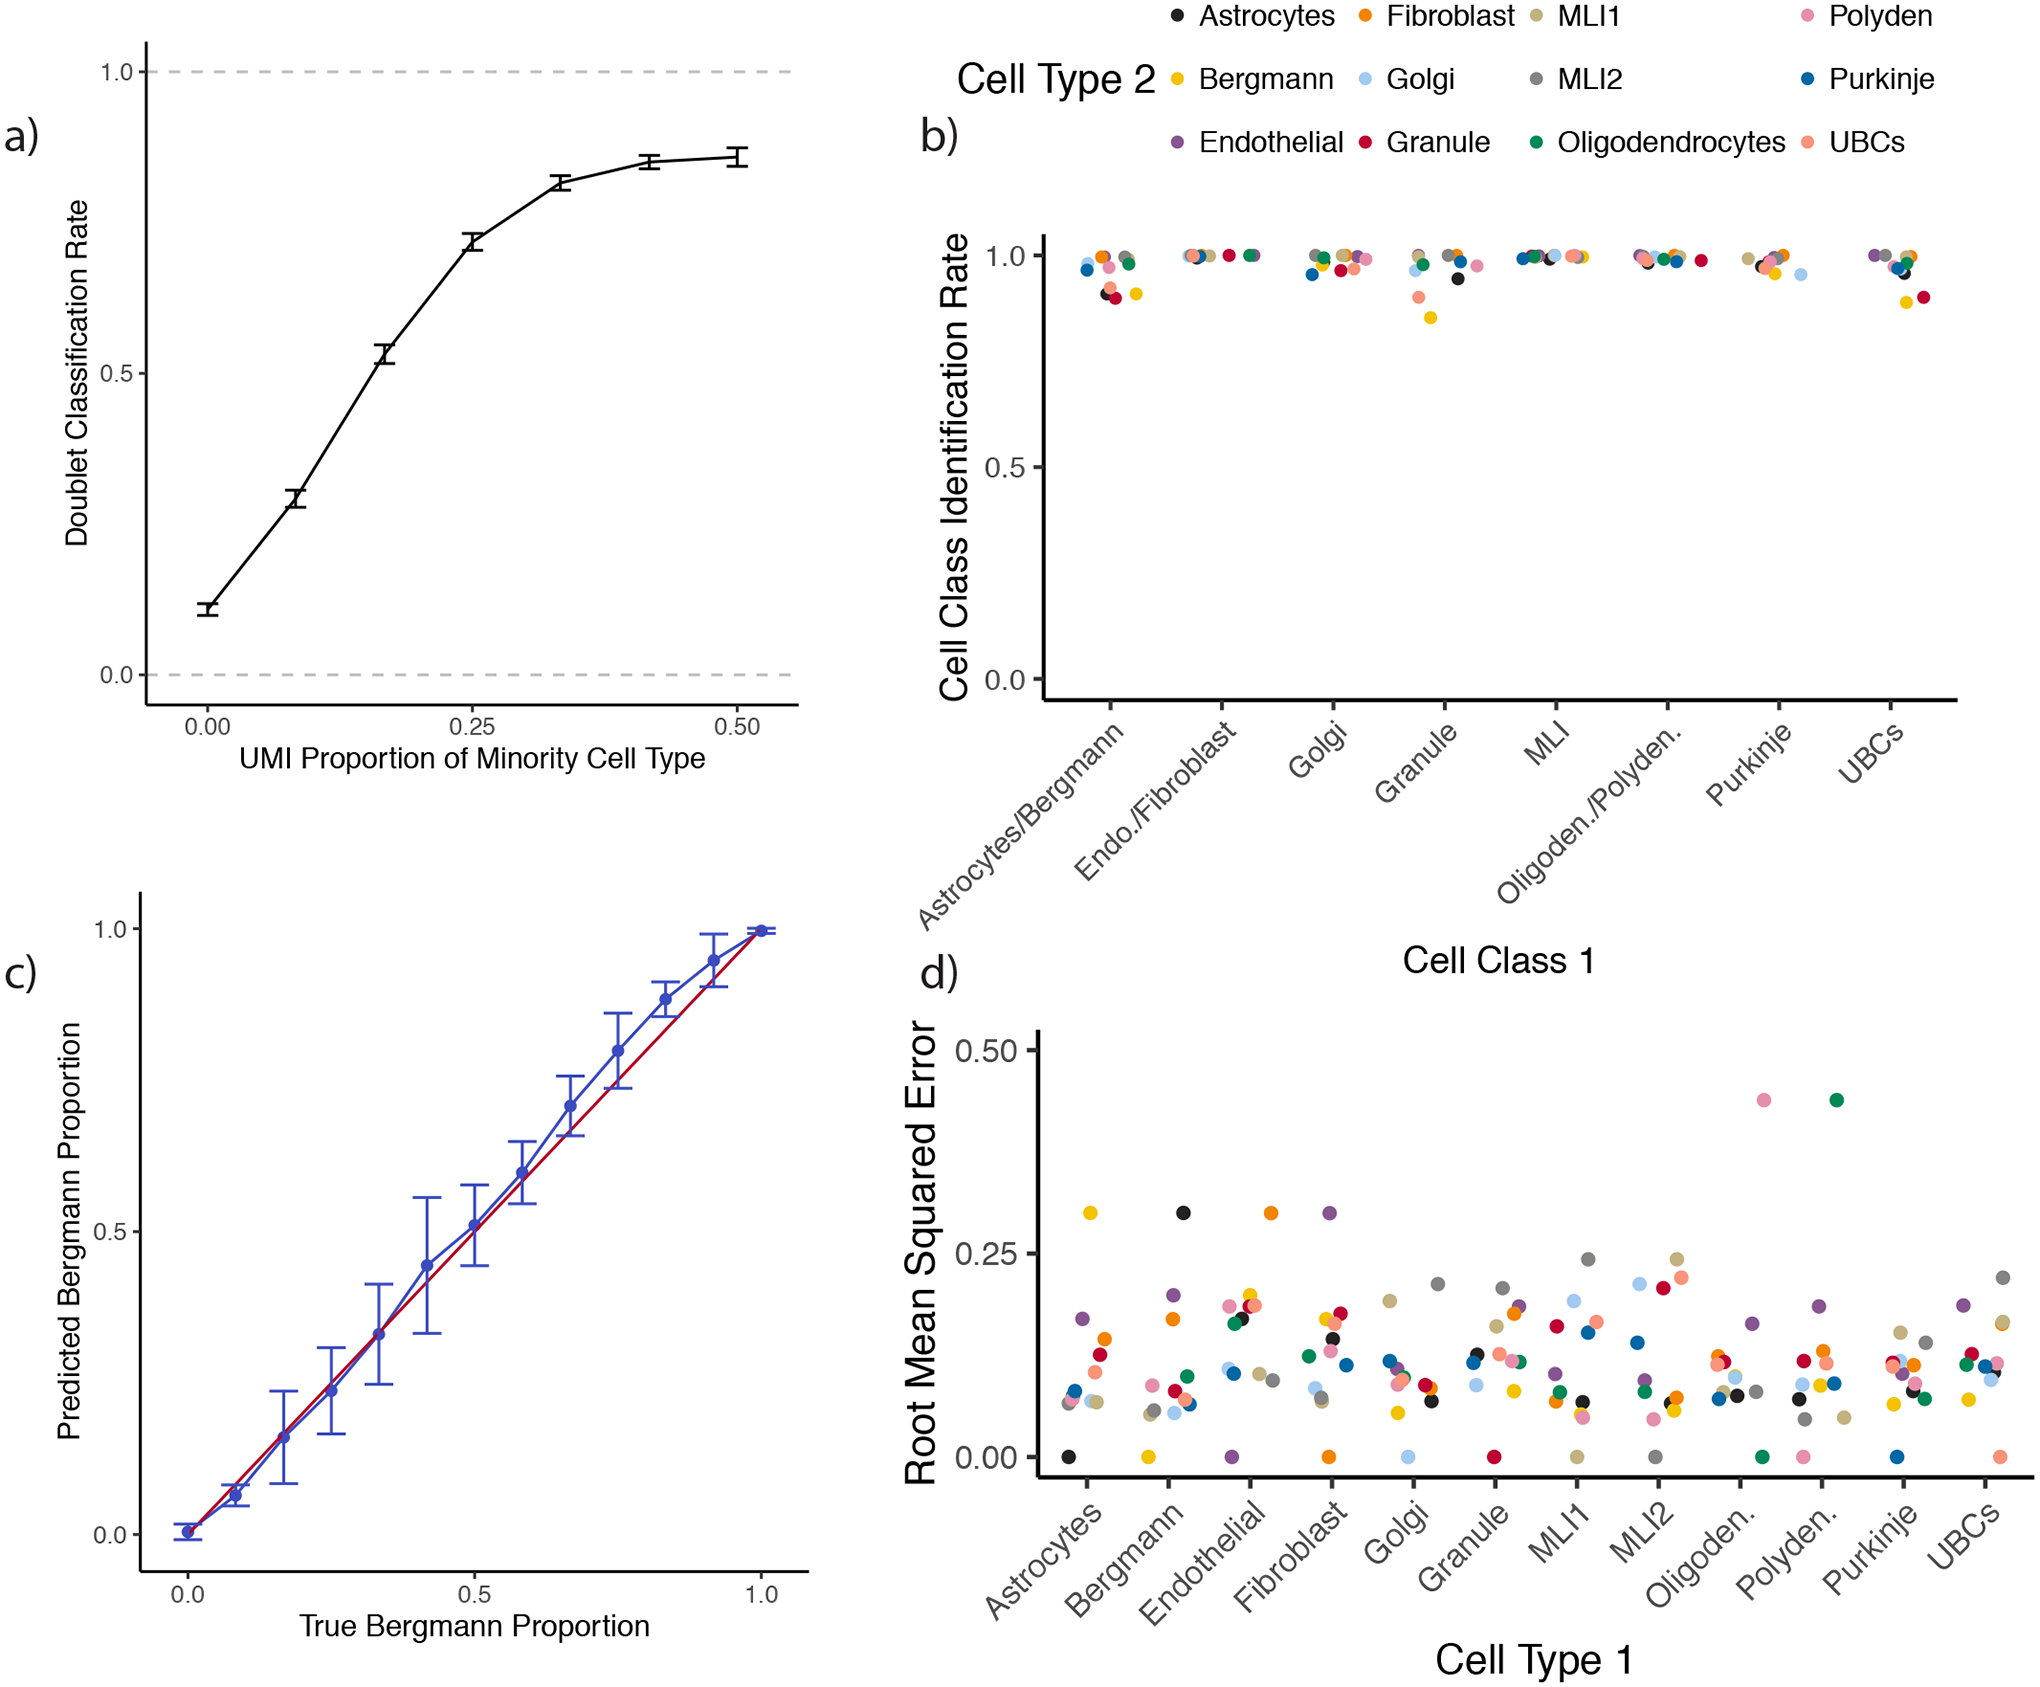
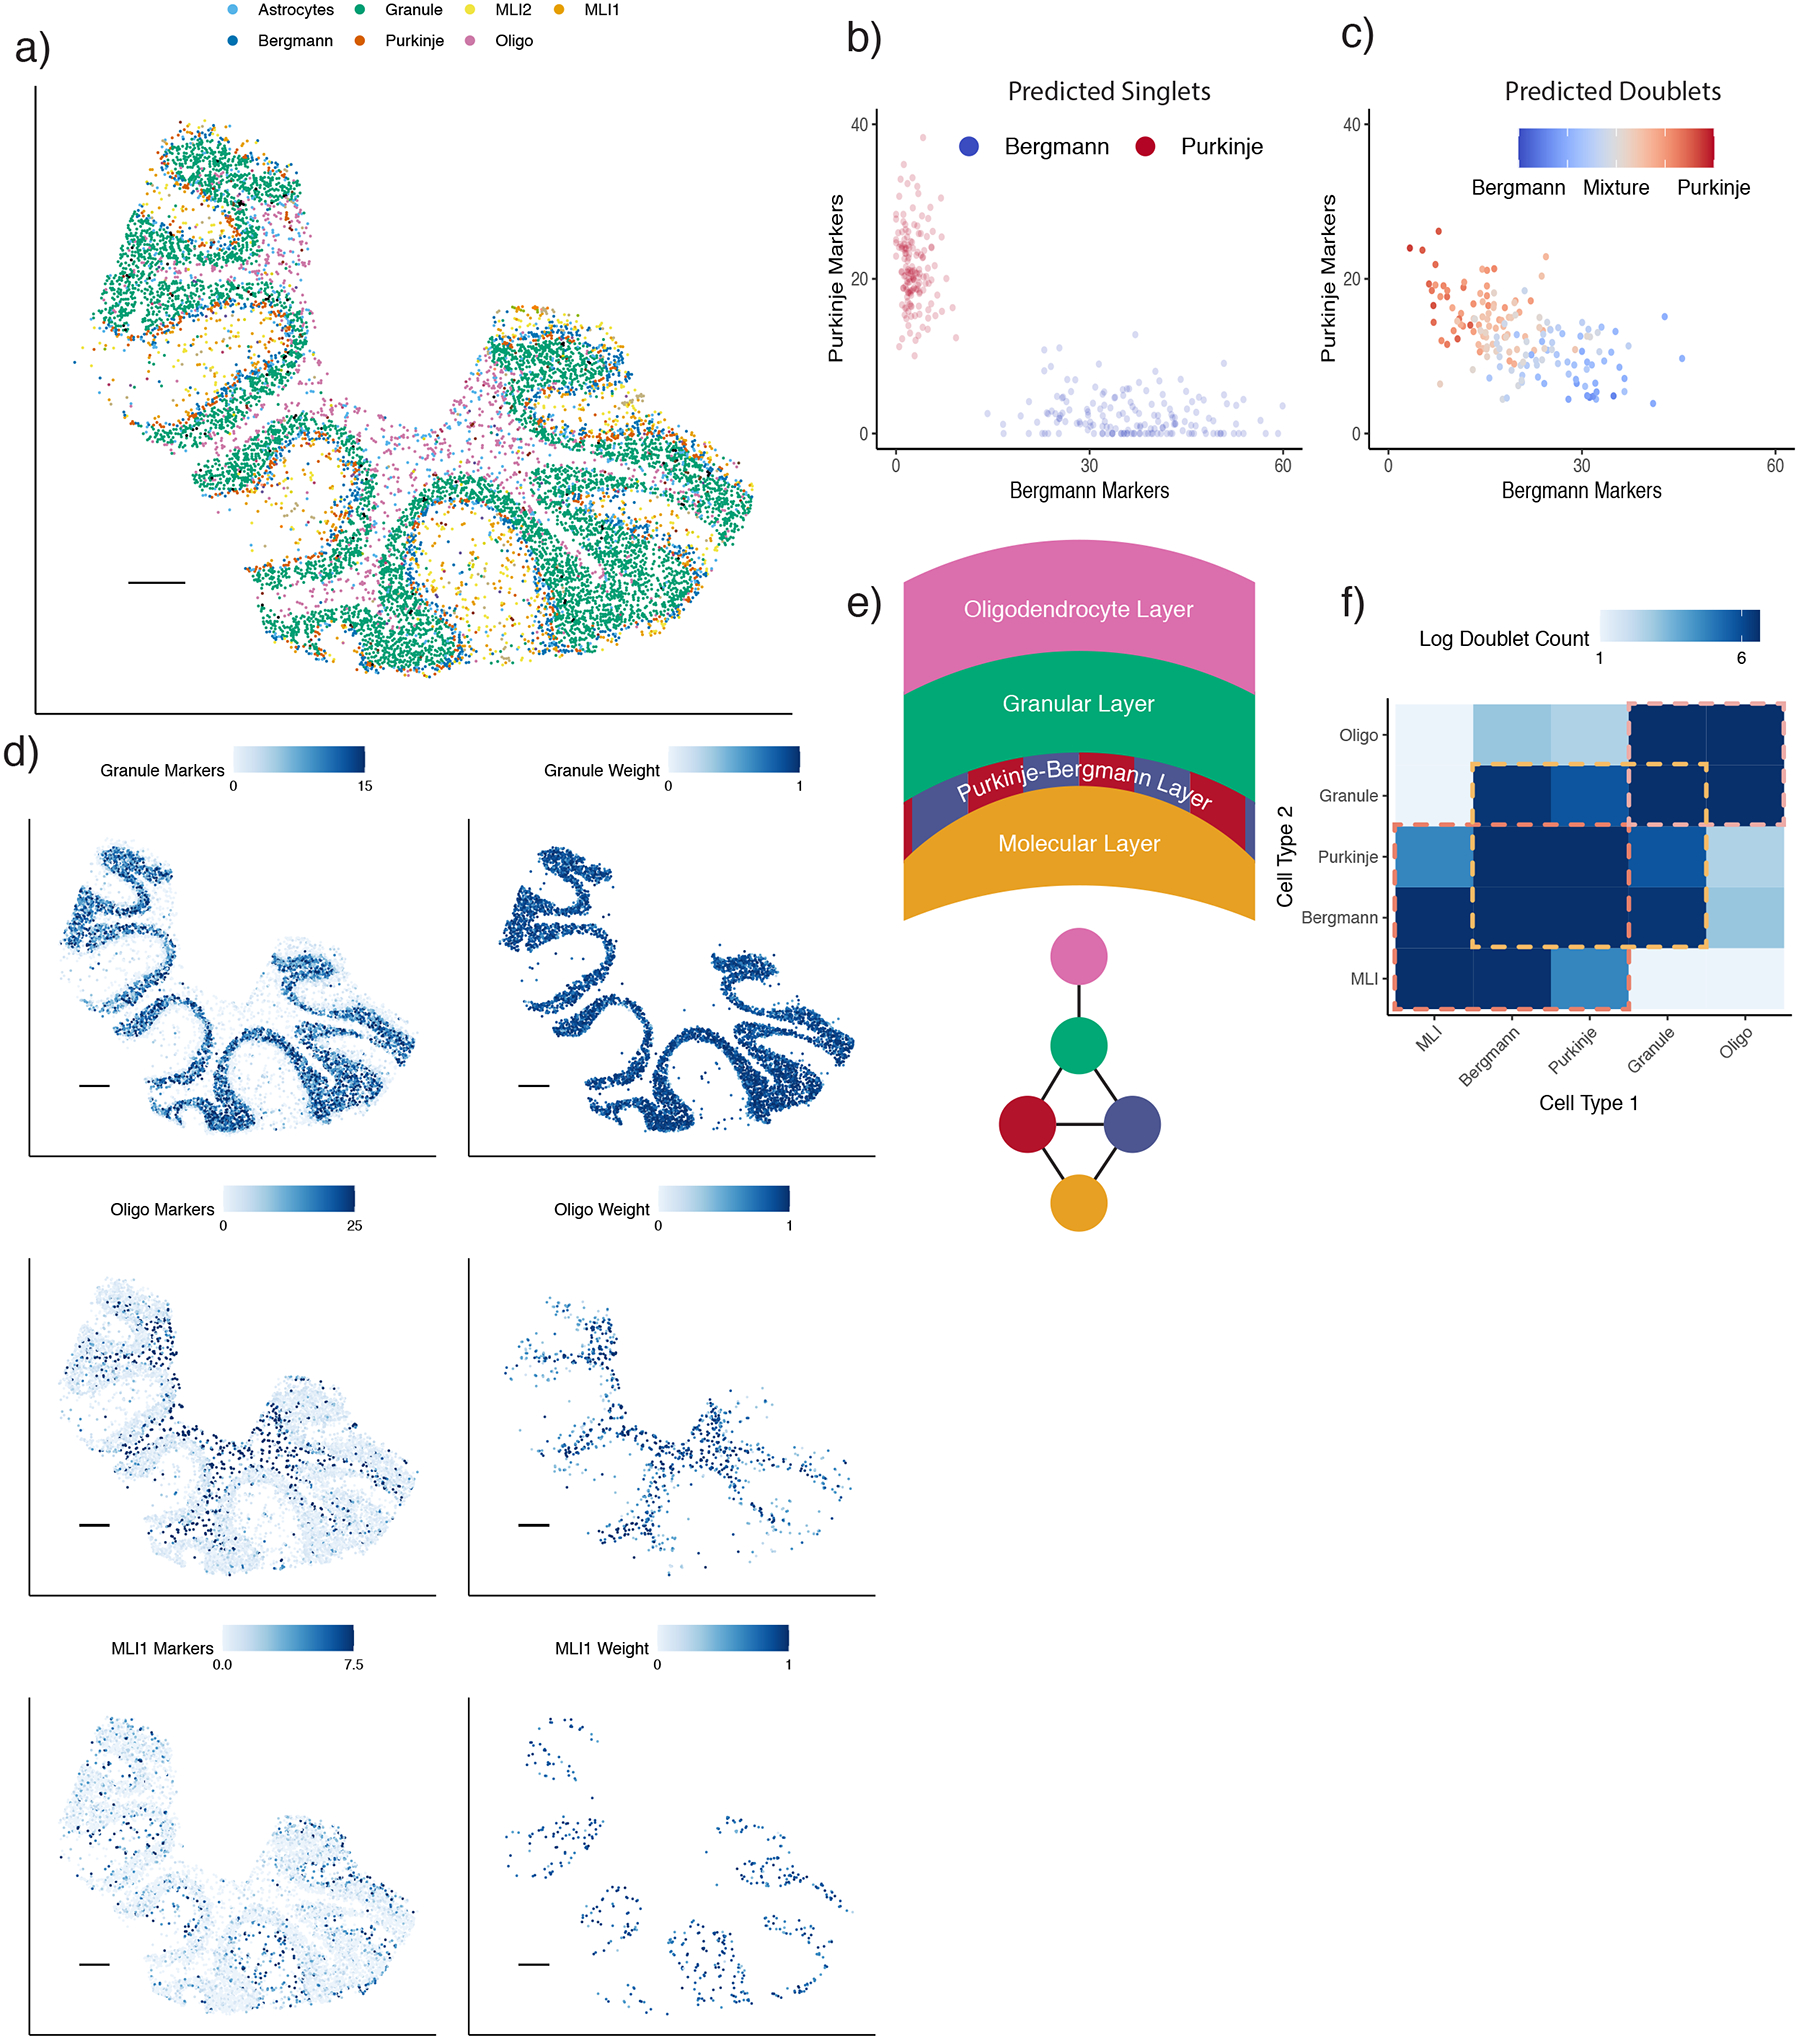
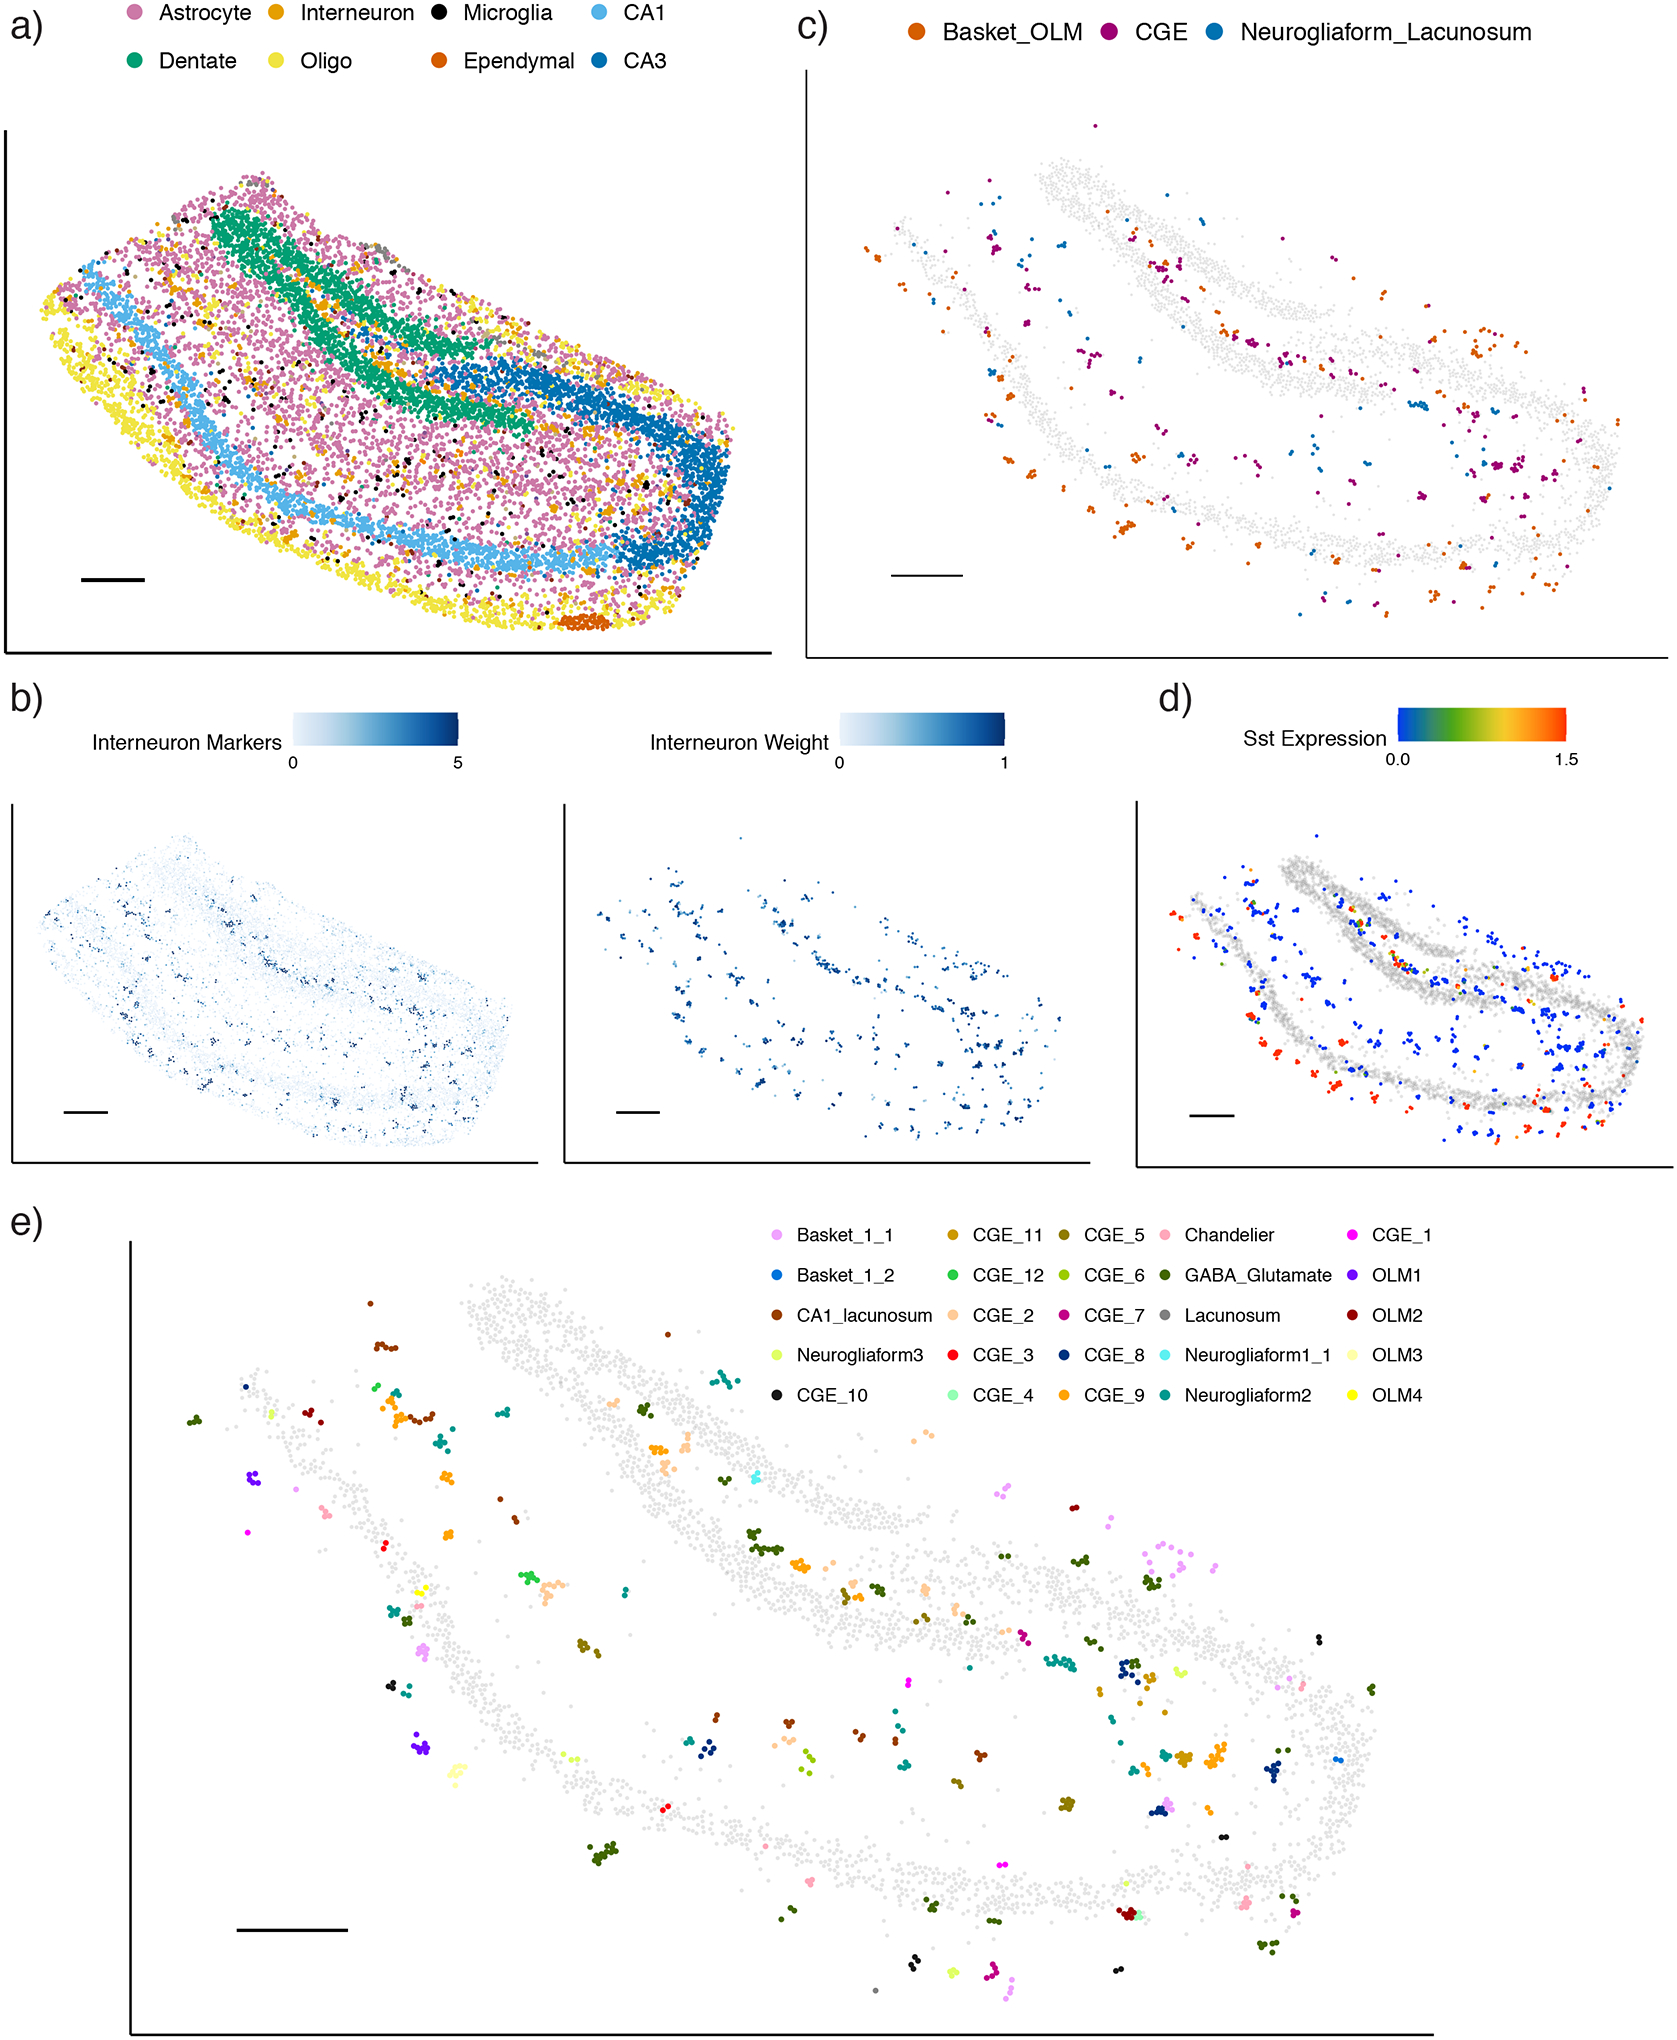
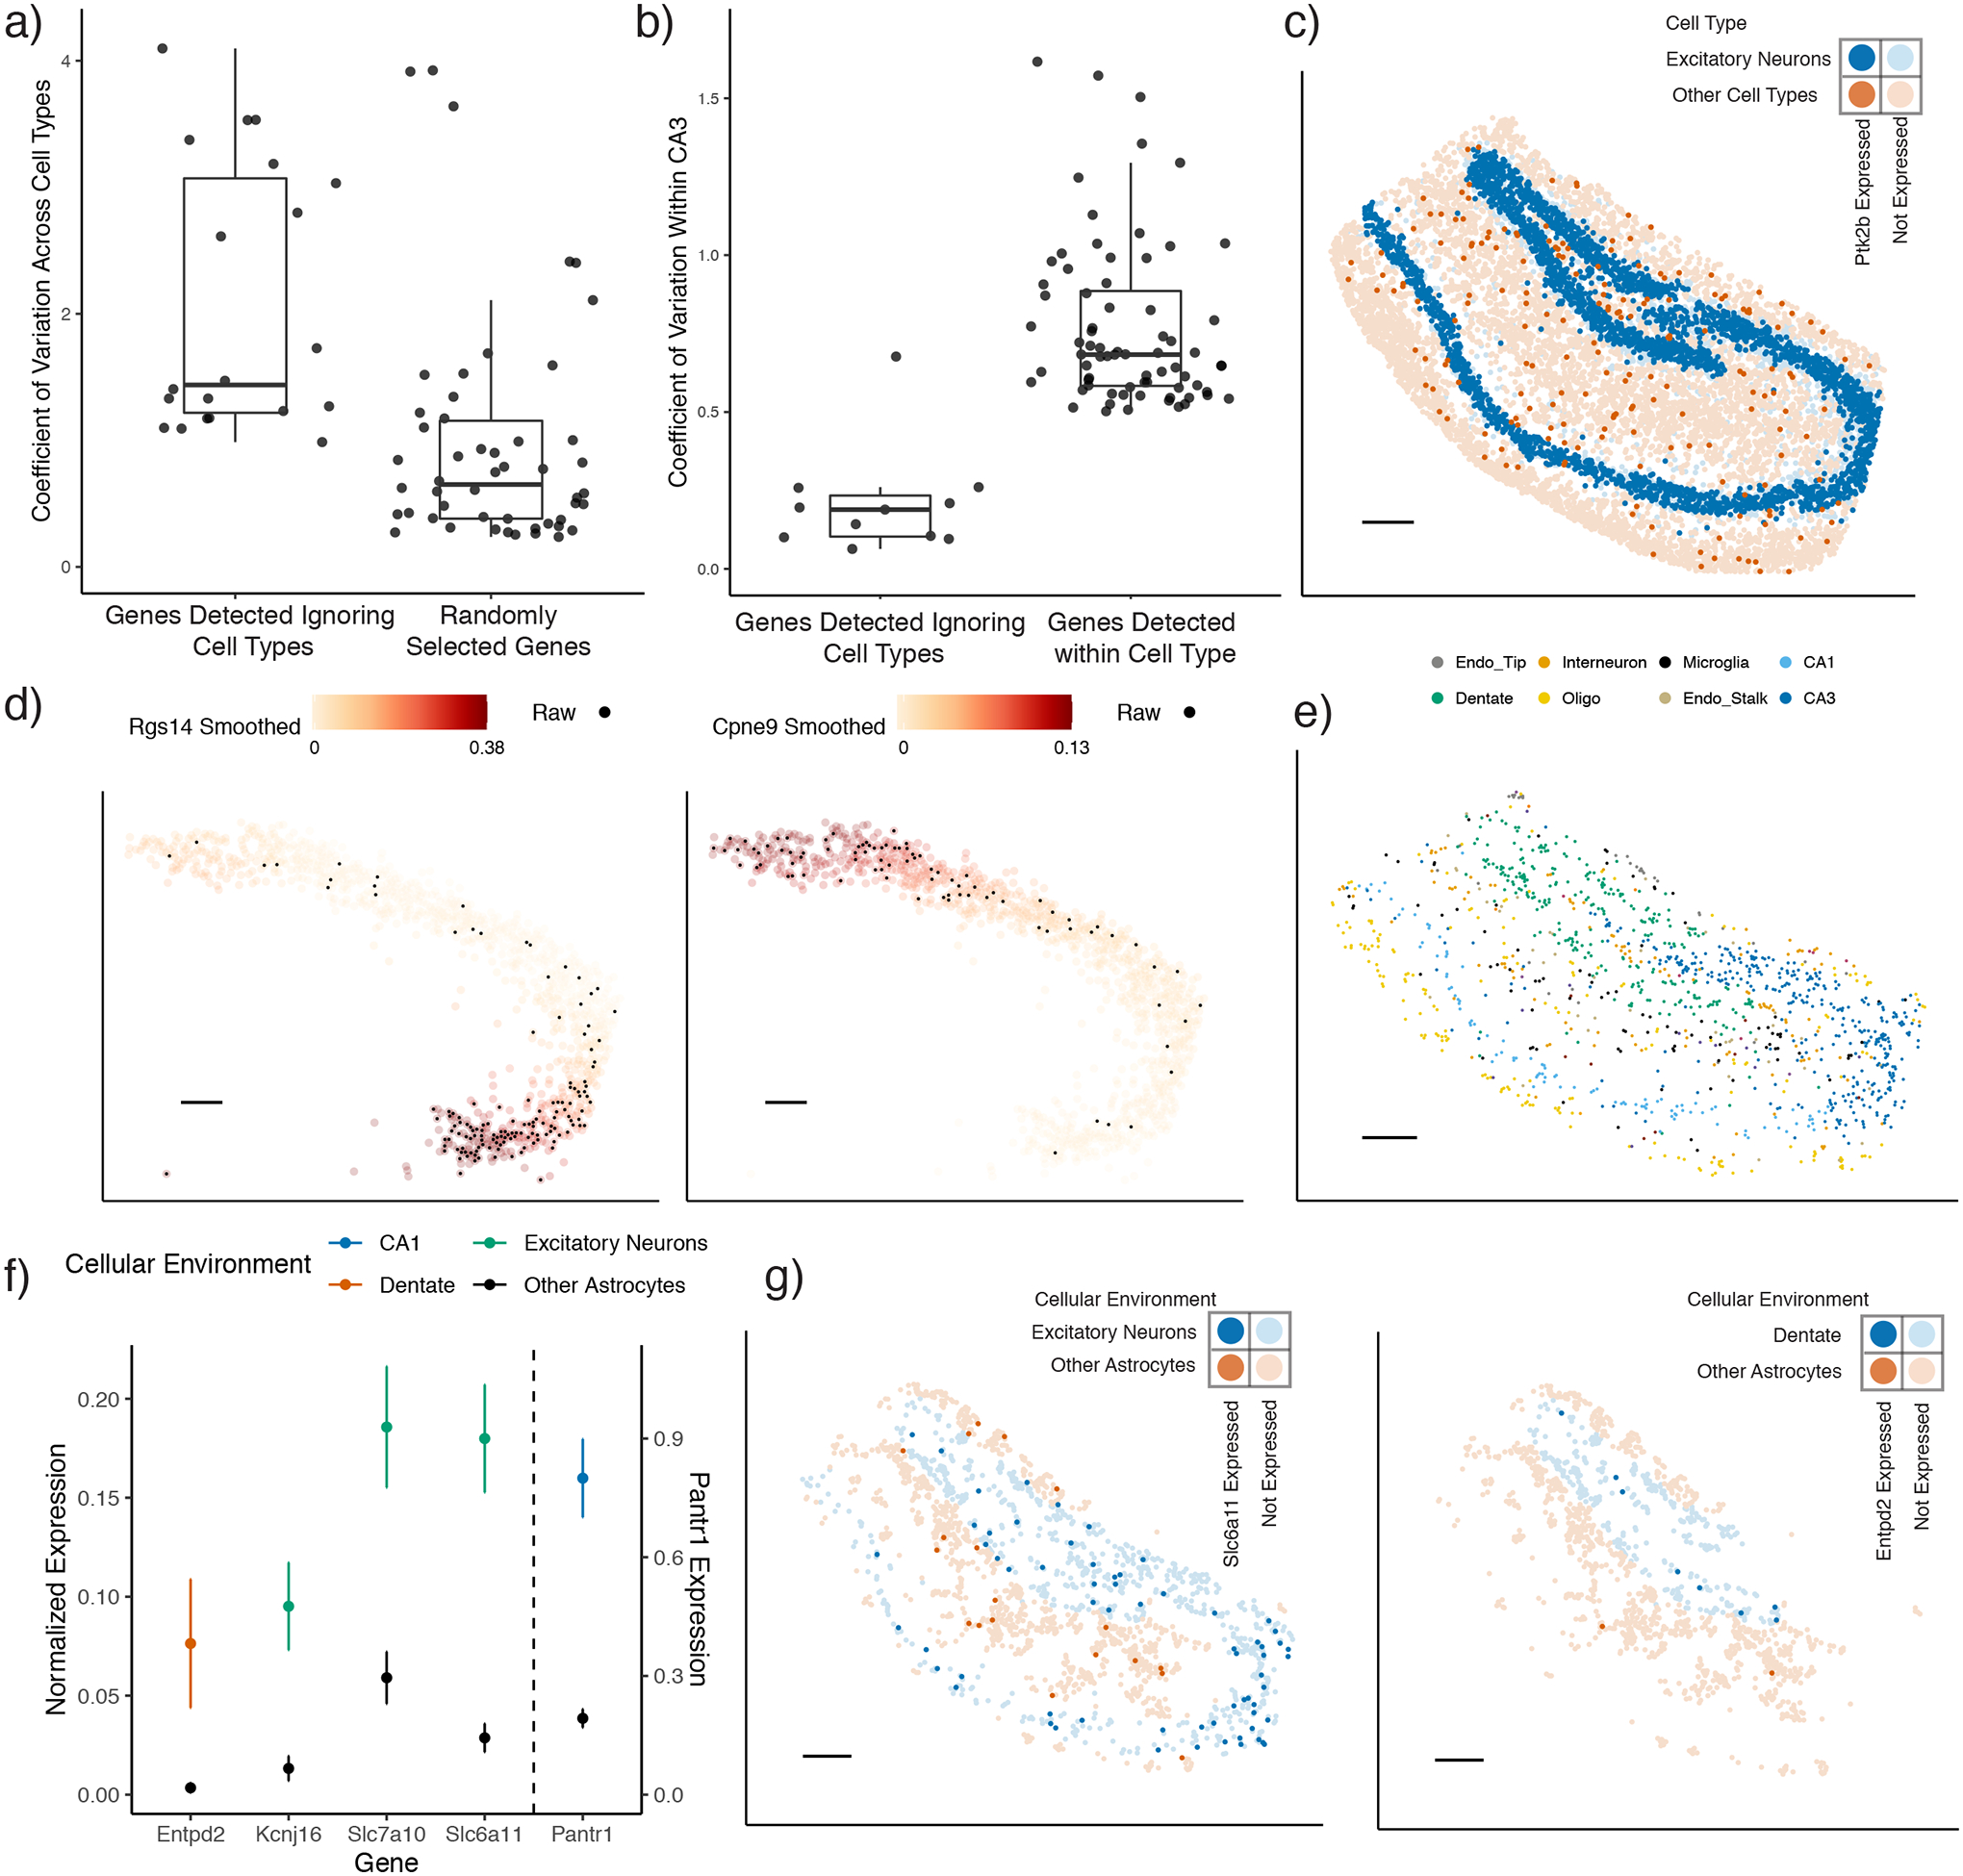
A limitation of spatial transcriptomics technologies is that individual measurements may contain contributions from multiple cells, hindering the discovery of cell-type-specific spatial patterns of localization and expression. Here, we develop robust cell type decomposition (RCTD), a computational method that leverages cell type profiles learned from single-cell RNA-seq to decompose cell type mixtures while correcting for differences across sequencing technologies. We demonstrate the ability of RCTD to detect mixtures and identify cell types on simulated datasets. Furthermore, RCTD accurately reproduces known cell type and subtype localization patterns in Slide-seq and Visium datasets of the mouse brain. Finally, we show how RCTD's recovery of cell type localization enables the discovery of genes within a cell type whose expression depends on spatial environment. Spatial mapping of cell types with RCTD enables the spatial components of cellular identity to be defined, uncovering new principles of cellular organization in biological tissue. RCTD is publicly available as an open-source R package at https://github.com/dmcable/RCTD .


Conflict of interest statement

Conflict of Interest Statement

The authors declare no conflict of interest.

Figures

Figure 1:
Figure 1:
Spatial transcriptomics data presents challenges for cell type learning. a) Expression of Bergmann and Purkinje marker genes for pixels colored by unsupervised clustering cell type assignment within a Slide-seq cerebellum dataset. The e.g. Bergmann markers axis is the sum of the expression (counts per 500) of Bergmann differentially expressed genes. b) Expression (counts per 500) of granule marker genes in Slide-seq. Scale bar: 250 microns. c) Spatial plot of granule cells identified by unsupervised clustering. Pixels are colored by whether they spatially belong to the granule layer. Scale bar: 250 microns. d) Confusion matrix of true vs predicted cell types within training dataset (single-nucleus RNA-seq) by non-negative least squares regression. Color represents the proportion of the cell type on the x-axis classified as the cell type on the y-axis. The diagonal representing ground truth is boxed in red. e) Confusion matrix of cell type predictions across platforms using non-negative least squares regression trained on single-nucleus RNA-seq, tested on single-cell RNA-seq. Same color scale as (d). f) Density plot, across genes, of measured platform effects between cerebellum single-cell RNA-seq and single-nucleus RNA-seq. The platform effect is defined as the log2 ratio of average gene expression between platforms.
Figure 2:
Figure 2:
Robust Cell Type Decomposition enables cross-platform learning of cell types. a) Left: RCTD inputs: a scRNA-seq dataset, annotated by cell type, and a spatial transcriptomics dataset with unknown cell types. Middle: RCTD uses a scRNA-seq reference-based probabilistic model to predict cell types on a single pixel containing a mixture of two cell types (e.g. Bergmann/Purkinje), with unknown cell type proportions. RCTD predicts the maximum likelihood cell type proportions. In doublet mode, RCTD constrains each pixel to contain at most two cell types; alternatively, RCTD can estimate the best fit at a pixel using all cell types. Right: RCTD outputs a spatial map of cell types, with opacity representing the inferred cell type proportion. b) Scatter plot of measured vs predicted platform effect (by RCTD) for each gene between the single-cell and single-nucleus cerebellum datasets. Line is the identity line. Measured platform effect is calculated as the log2 ratio of average gene expression between platforms. c) Confusion matrix for RCTD’s performance on cross-platform (trained on single-nucleus RNA-seq, tested on single-cell RNA-seq) cell type assignments for single cells. Color represents the proportion of the cell type on the x-axis classified as the cell type on the y-axis. The diagonal representing ground truth is boxed in red.
Figure 3:
Figure 3:
RCTD performs cross-platform detection and decomposition of doublets. All: RCTD was trained on the single-nucleus RNA-seq cerebellum dataset and tested on a dataset of simulated mixtures of single cells from a single-cell RNA-seq cerebellum dataset. a) Rate of doublet classification by RCTD on simulated mixtures of single cells, with 95% confidence intervals. The x-axis represents the true proportion of UMIs sampled from the minority cell type, ranging from 0% (true singlet) to 50% (equal proportion doublet) (1980 ≤ n ≤ 3860 simulations per condition). b) On simulated doublets of cell class 1 and cell type 2, the percentage of confident calls by RCTD that correctly identify the cell class, where cell classes group four pairs of transcriptionally similar cell types based on a previous dendrogram [20] (polydendrocytes/oligodendrocytes, MLI1/MLI2, Bergmann/astrocytes, endothelial/fibroblasts). Column represents cell class 1, and color represents cell type 2. c) On simulated Bergmann-Purkinje doublets, predicted Bergmann proportions by RCTD. The x-axis represents the true proportion of UMIs sampled from the Bergmann cell. The red line is the identity line, and the blue line is the average and standard deviation (n = 30 simulations per condition) of RCTD’s prediction. d) For each pair of cell types, root mean squared error (RMSE) of predicted vs true cell type proportion (as in (c)) by RCTD on simulated doublets (n = 390 simulations per cell type pair). Column represents cell type 1, and color represents cell type 2.
Figure 4:
Figure 4:
RCTD applied to cell type learning in Slide-seq datasets. a) RCTD’s spatial map of cell type assignments in the cerebellum. Out of 19 cell types, the seven most common appear in the legend (individual cell types displayed in Supplementary Figure 14). b) Analogous to (1a), expression of Bergmann and Purkinje marker genes for RCTD’s predicted singlet pixels within a Slide-seq cerebellum dataset (colored by cell type assignment). The e.g. Bergmann markers axis is the sum of the expression (counts per 500) of Bergmann differentially expressed genes. c) Expression of Bergmann and Purkinje marker genes for doublet pixels predicted by RCTD, colored by predicted cell type proportion. d) Predicted spatial localization of cell types by RCTD for granule, oligodendrocytes, and molecular layer interneurons 1 (MLI1). Left: summed expression (counts per 500) (represented by color) of cell type-specific marker genes. Right: predicted spatial locations of each cell type, with color representing predicted cell type proportion. e) (Top) Schematic of spatial cell type organization within the cerebellum [22]. (Bottom) Connectivity graph of cell types that are likely to spatially colocalize. Cell types are colored as in (a). f) Frequency of doublets identified by RCTD between each pair of cell types. Color represents log2 scale counts. Dotted boxes represent communities anatomically expected to exhibit spatial co-localization. Diagonal represents prevalence of singlets. Color bar range: 2 to 100 counts. All scale bars 250 microns.
Figure 5:
Figure 5:
RCTD maps cell types and subtypes in Slide-seq hippocampus. a) RCTD’s spatial map of predicted cell types in the hippocampus. Out of 17 cell types, the 8 most common appear in the legend (individual cell types displayed in Supplementary Figure 19). b) Predicted spatial localization of interneuron cell types by RCTD. Left: normalized expression (represented by color, counts per 500) of marker genes. Right: predicted spatial locations of interneurons, with color representing predicted cell type proportion. c) Predicted confident assignments of interneuron pixels by RCTD to 3 classes of interneuron subtypes, plotted in space. Color indicates predicted subclass. d) Expression (counts per 500) of the Sst gene in interneurons identified by RCTD. e) RCTD’s confident assignment of spatial clusters to 27 interneuron subtypes (25/27 subtypes assigned). All scale bars 250 microns. Grey circles represent location of CA1, CA3, and dentate gyrus excitatory neurons for reference.
Figure 6:
Figure 6:
RCTD enables detection of cell type-specific spatial patterns of gene expression. a) Boxplot of coefficient of variation of genes across cell types in the hippocampus single-cell RNA-seq reference. Spatially variable genes were selected for large spatial autocorrelation in the Slide-seq hippocampus, without considering cell type. For reference, 50 randomly selected genes are shown. b-g) Analysis on Slide-seq hippocampus data b) Boxplot of the coefficient of variation in gene expression within CA3 cells identified by RCTD. (Left): Spatially variable genes selected for large spatial autocorrelation in the hippocampus, without considering cell type. (Right): Using RCTD’s expected cell type-specific gene expression, genes determined to be spatially variable by applying local regression within the CA3 cell type (p ≤ 0.01, permutation F-test). c) Bold pixels represent expression of Ptk2b, a gene selected to be spatially variable without considering cell type. Blue represents pixels with excitatory neurons (as detected by RCTD), whereas red represents pixels without excitatory neurons. d) Smoothed spatial expression patterns (counts per 500), recovered by local regression, of two genes detected to have large spatial variation within RCTD’s CA3 cells. Individual pixels expressing the gene are colored in black. e) Spatial localization of astrocyte doublets in the hippocampus, detected by RCTD. Color represents the other cell type on the doublet. f) Mean and standard error of RCTD’s expected gene expression (counts per 500) within groups of astrocytes (129 ≤ n ≤ 956 cells per condition) classified by their cellular environment (color). (Scale on the right for Pantr1, scale on the left for other genes). g) Spatial visualization of genes with environment-dependent expression within astrocytes. Red represents the astrocytes surrounded by other astrocytes, whereas blue represents astrocytes that are surrounded by excitatory neurons (left) or dentate gyrus cells (right). Bold points represent astrocytes expressing Slc6a11 (left) or Entpd2 (right). All scale bars 250 microns. For boxplots, the median, 25th, and 75th percentile define the box, with whiskers extending the hinge by 1.5 times the inter-quartile range (IQR).

Similar articles

Cited by

References

    1. Stickels RR et al. Sensitive spatial genome wide expression profiling at cellular resolution. bioRxiv (2020). https://www.biorxiv.org/content/early/2020/03/14/2020.03.12.989806.full.pdf.
    1. 10x Genomics. 10x genomics: Visium spatial gene expression. https://www.10xgenomics.com/solutions/spatial-gene-expression/ (2020).
    1. Vickovic S et al. High-definition spatial transcriptomics for in situ tissue profiling. Nature methods 16, 987–990 (2019). - PMC - PubMed
    1. Pelkey KA et al. Hippocampal gabaergic inhibitory interneurons. Physiological reviews 97, 1619–1747 (2017). - PMC - PubMed
    1. Cembrowski MS et al. The subiculum is a patchwork of discrete subregions. Elife 7, e37701 (2018). - PMC - PubMed

Publication types