. 2021 Mar;53(3):354-366.
doi: 10.1038/s41588-021-00782-6. Epub 2021 Feb 18.

Base-resolution models of transcription-factor binding reveal soft motif syntax

Affiliations

Base-resolution models of transcription-factor binding reveal soft motif syntax

Žiga Avsec et al. Nat Genet. 2021 Mar.

Abstract

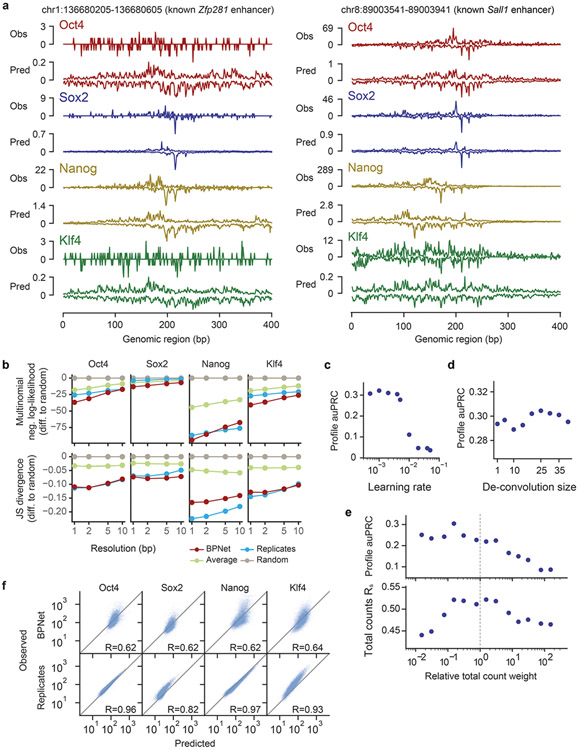
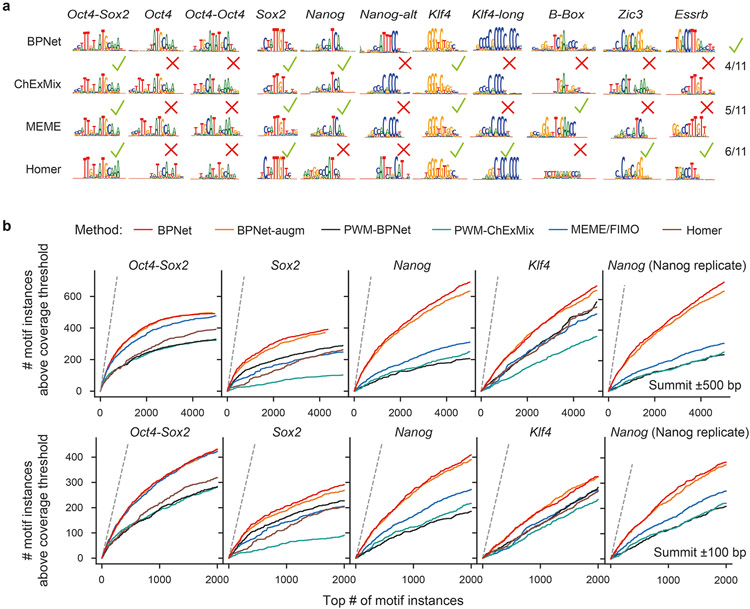
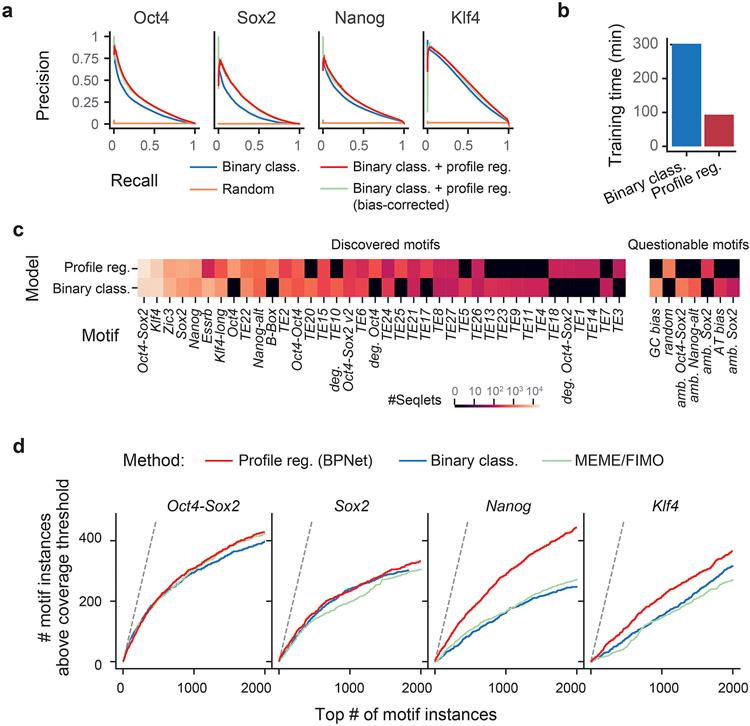
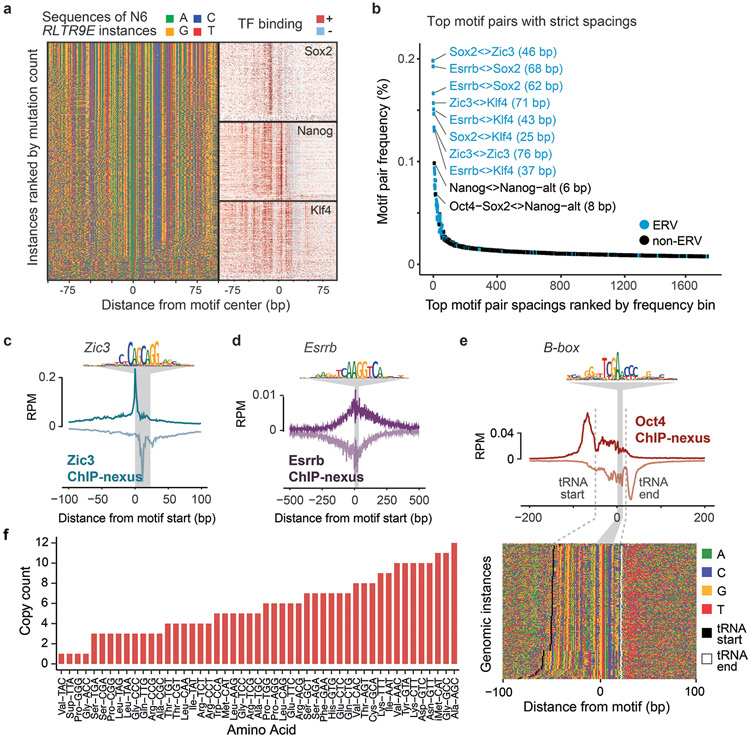
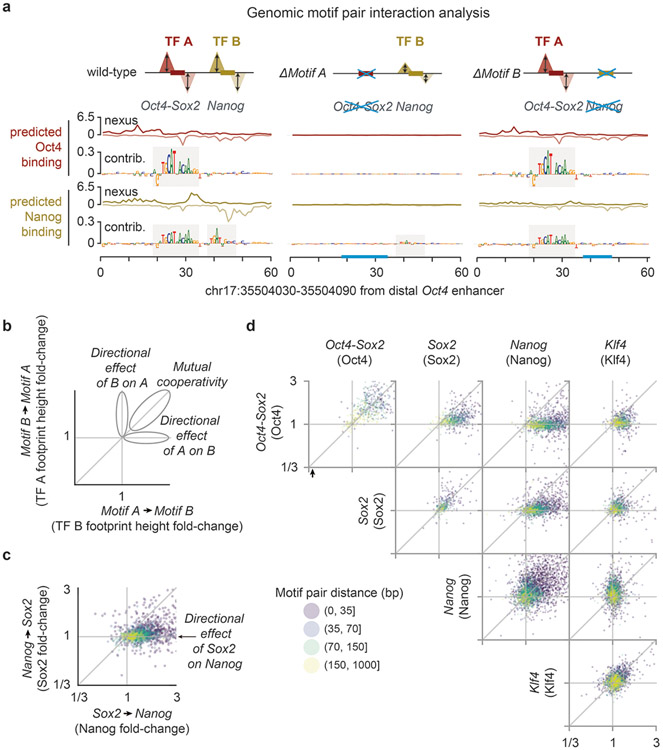
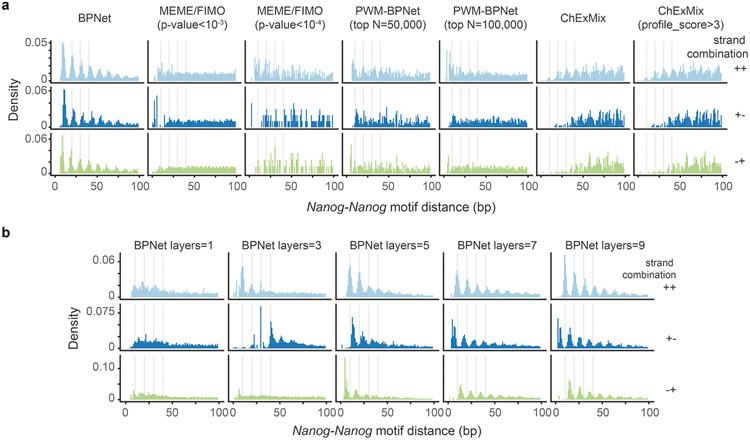
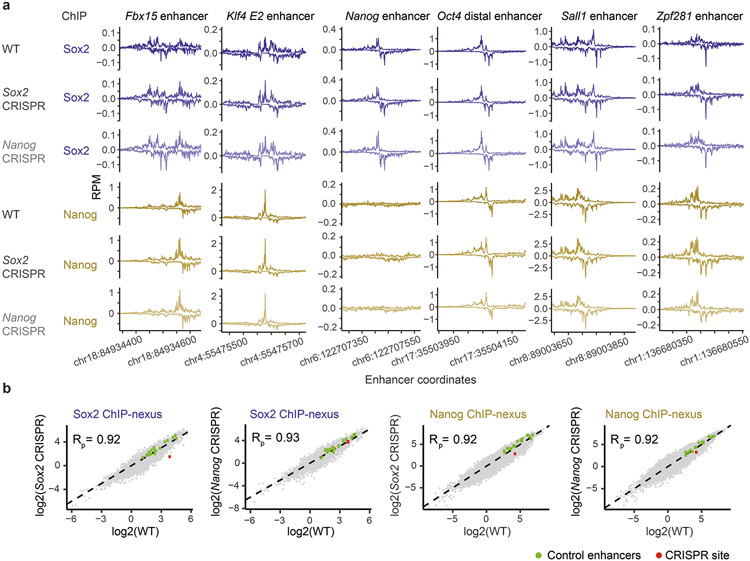
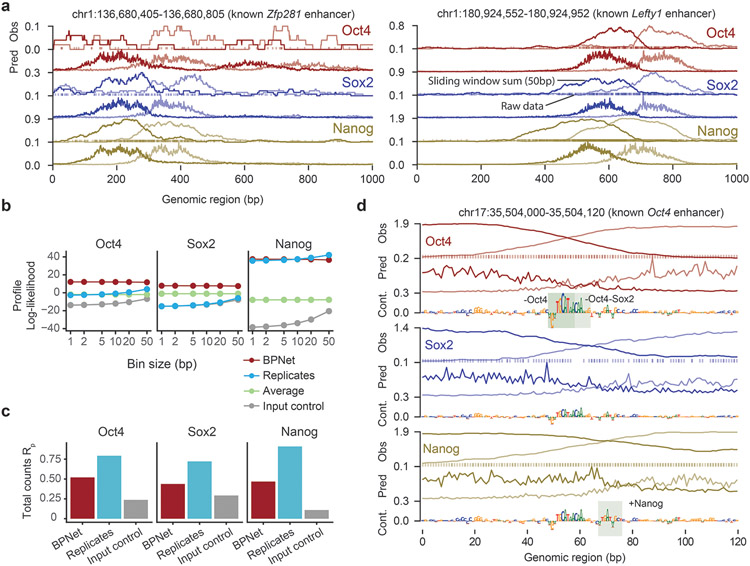
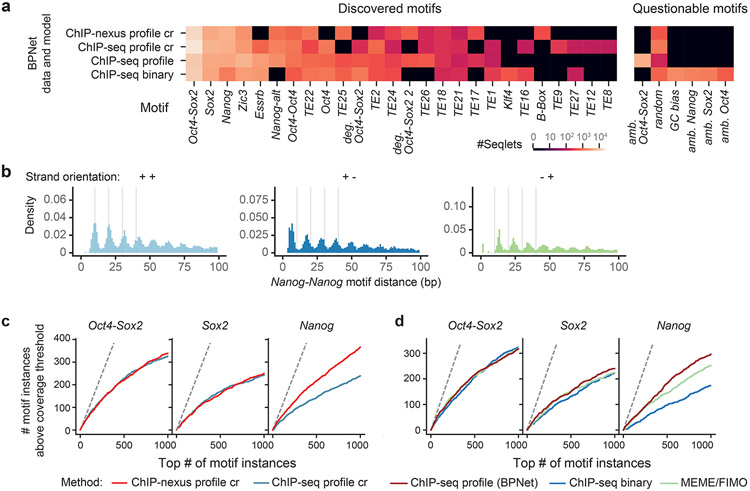
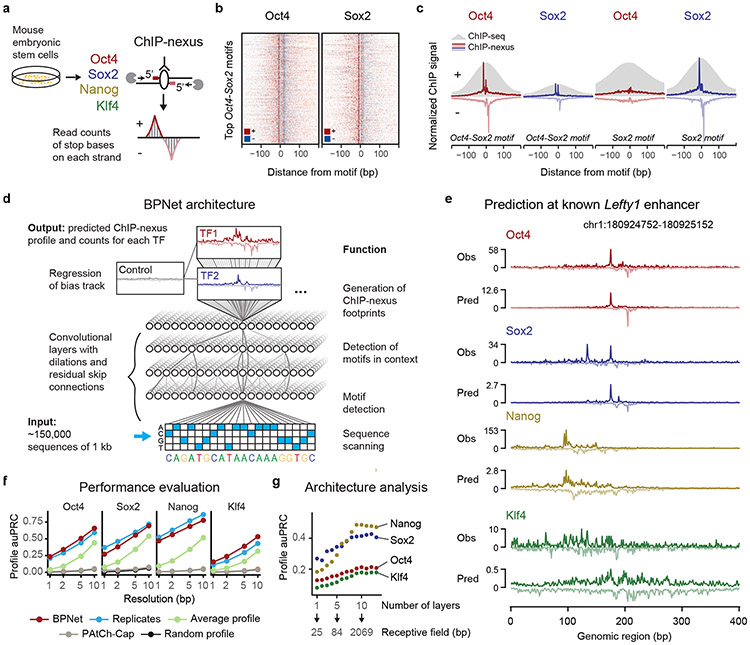
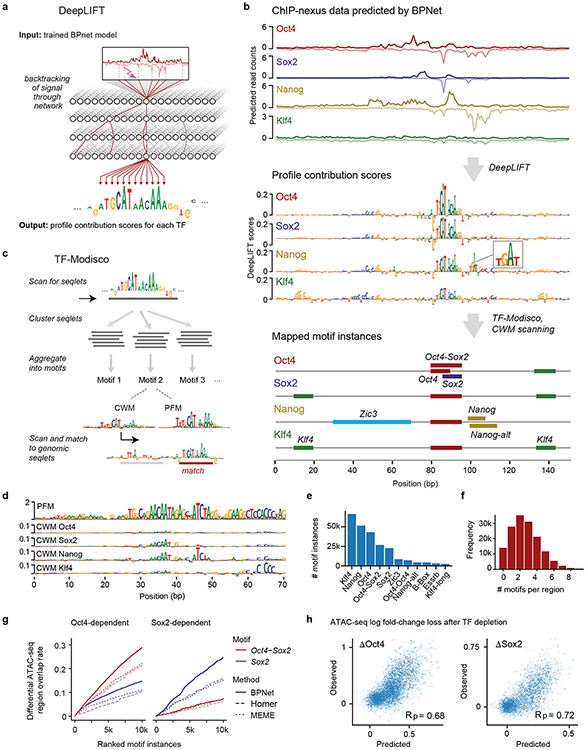
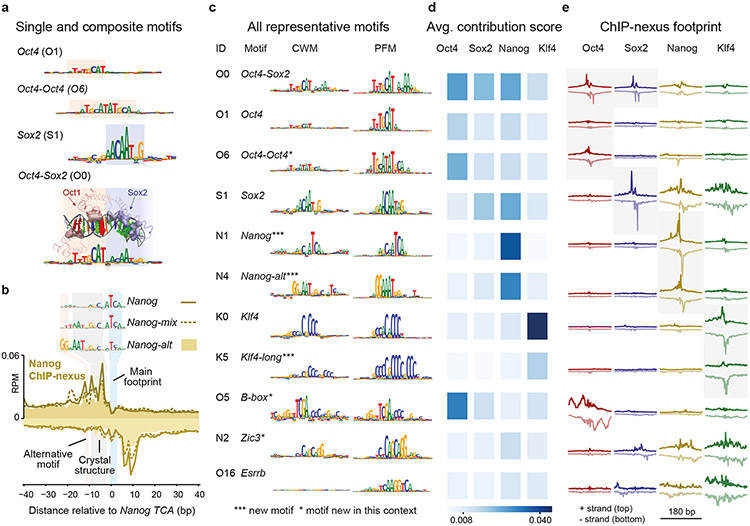
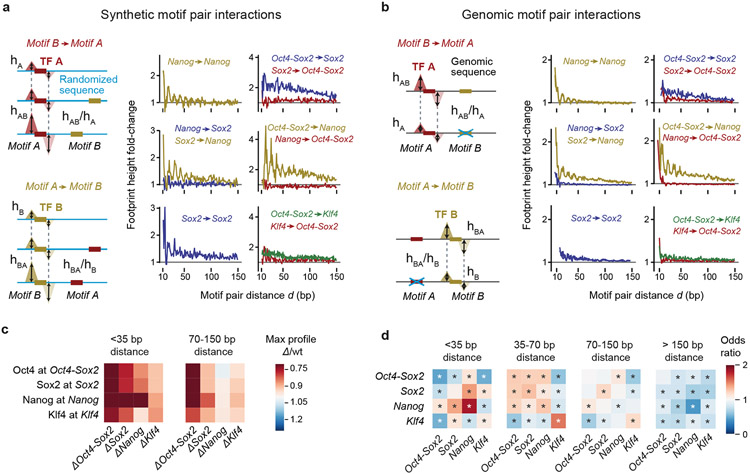
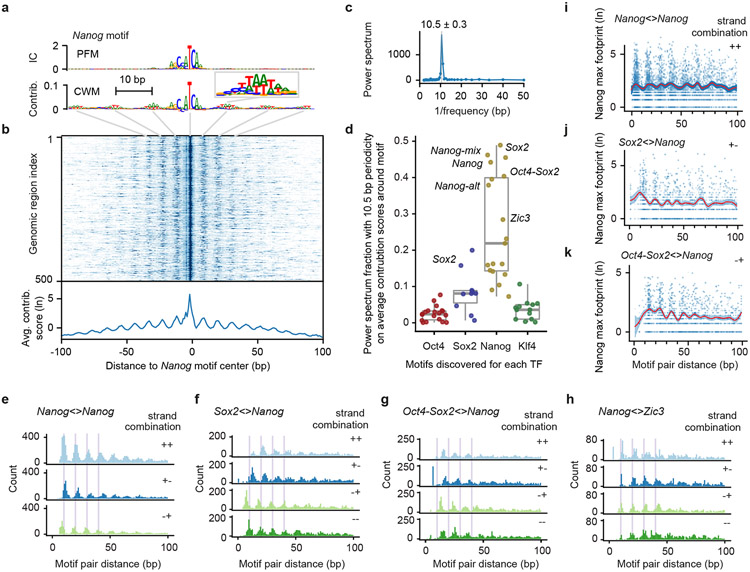
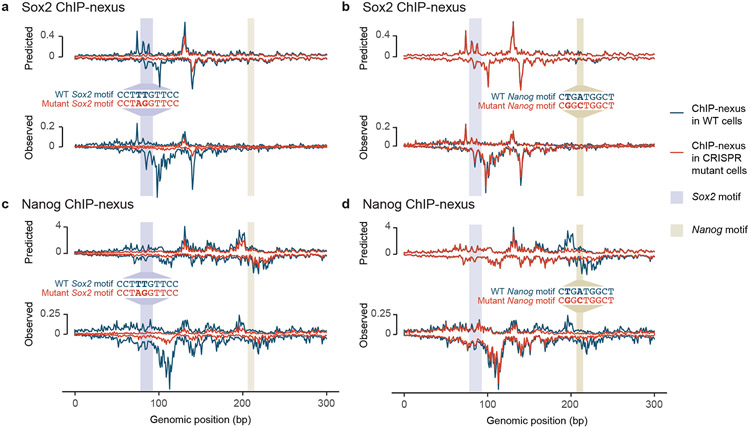
The arrangement (syntax) of transcription factor (TF) binding motifs is an important part of the cis-regulatory code, yet remains elusive. We introduce a deep learning model, BPNet, that uses DNA sequence to predict base-resolution chromatin immunoprecipitation (ChIP)-nexus binding profiles of pluripotency TFs. We develop interpretation tools to learn predictive motif representations and identify soft syntax rules for cooperative TF binding interactions. Strikingly, Nanog preferentially binds with helical periodicity, and TFs often cooperate in a directional manner, which we validate using clustered regularly interspaced short palindromic repeat (CRISPR)-induced point mutations. Our model represents a powerful general approach to uncover the motifs and syntax of cis-regulatory sequences in genomics data.


Conflict of interest statement

Conflict of Interests statement

J.Z. owns a patent on ChIP-nexus (Patent No. 10287628). All other authors declare no competing interests.

Figures

Extended Data Fig. 1
Extended Data Fig. 1. Additional performance evaluation of BPNet’s predictions of ChIP-nexus data
a) Observed and predicted ChIP-nexus read counts mapping to the forward strand (dark) and the reverse strand (light) for the Zfp281 and Sall1 enhancers located on the held-out (test) chromosome 1. b) Alternative profile shape evaluation metrics showing the difference to random predictions: multinomial negative log-likelihood and Jensen-Shannon (JS) divergence. Both metrics were computed at different resolutions (from 1 bp to 10 bp windows) in held-out test chromosomes 1, 8 and 9. c) auPRC of profile predictions is high across various learning rates on the tuning set chromosomes 2, 3 and 4, demonstrating the robustness of the model. d) The deconvolutional layer slightly improves the profile predictive performance compared to a point-wise convolutional layer (deconvolution size=1). e) auPRC of profile predictions (top) and the Spearman correlation of total count predictions (bottom) for a range of different relative total count weight α in the BPNet loss function parameterized as λ = α/2 n_obs. Relative weight of 1 (center) denotes equal weighting of the counts and profile loss functions. The best performance is obtained for α < 1, showing that putting more weight to profile predictions aids both profile and count predictions. f) Observed and predicted total read counts for BPNet (top) and replicate experiments (bottom) across the four studied TFs along with the Spearman correlation coefficient.
Extended Data Fig. 2
Extended Data Fig. 2. Removal of long motifs in retrotransposons and clustering of motifs by similarity
a) Among all motifs discovered by TF-MoDISco, 18 motifs display unusually high information content (IC) of >30 bits (green). The expected short motifs are shown in gray. b) Histogram of the overlap of short motifs (gray) and long motifs (green) with repeat elements shows that long motifs overlap >80% with annotated retrotransposons. c) Long motifs with their PFM, ID, fraction of motif instances overlapping with a repeat and the most frequent (top class) RepeatMasker annotation. Highlighted within the repeat elements are potential motif instances of Oct4-Sox2, Sox2, Nanog and Klf4 as indicated by the CWMs. d) To identify a set of representative motifs from the 33 short motifs discovered for different TFs (information content <30 bit, shown in Supplementary Fig. 3) and remove redundant short motifs, motifs were clustered by similarity using hierarchical clustering. The results were then manually inspected to select clusters that separate known motifs that are distinct (e.g. Oct4-Oct4 resembles the known MORE and PORE motifs that bind Oct4 homodimers, which is different from the monomerically bound Oct4 motif). Among very similar motifs within a cluster, we then selected the most abundant motif that was discovered for the most relevant TF if known). The 11 representative motifs that we selected are shown on the left. Non-canonical motifs were given a name (Nanog-alt for Nanog alternative, Klf4-long for longer Klf4).
Extended Data Fig. 3
Extended Data Fig. 3. BPNet and TF-MoDISco outperform traditional methods in motif discovery and the mapping of motif instances
a) Motifs discovered by ChExMix, HOMER and MEME for Oct4, Sox2, Nanog and Klf4 ChIP-nexus peaks that are closest to the 11 primary representative BPNet motifs (top row). Green checkmark denotes whether the discovered motif is similar to the BPNet motif. b) Number of motif instances located up to 500 bp (top) or 100 bp (bottom) away from the ChIP-nexus peak summits showing a strong ChIP-nexus footprint. Only motif instances in peaks from held-out test chromosomes (1, 8 and 9) were used for the evaluation. (x-axis) top N motif instances from each of the methods were sorted in descending order of scores (PWM log odds score or CWM contrib score). For BPNet-augm, the center of the genomic region for which the contribution scores were computed was randomly jittered up to 200 bp away from the peak summit. This augmentation prevents BPNet from using the positional information of the peak summit. In the final column (Nanog replicate), the Nanog ChIP-nexus footprint was measured by a separate biological replicate using a different antibody (α-Nanog from Abcam, ab214549), which was not used during training or evaluation.
Extended Data Fig. 4
Extended Data Fig. 4. BPNet training on ChIP-nexus profiles is faster and yields more accurate motif instances than a binary classification model
a) Predictive performance as measured by the precision-recall curve of the binary classification models predicting the presence or absence of ChIP-nexus peaks from 1 kb DNA sequences evaluated across the held-out (tuning/validation) chromosomes 2, 3 and 4. The model trained to classify the sequences is outperformed when the model is trained to also predict the ChIP-nexus profiles from DNA sequence (without or without profile bias-correction) in addition to classifying them is shown in blue (without or without profile bias-correction) in light blue and with bias-correction in dark blue). b) Training time of the binary classification model trained genome-wide and the sequence-to-profile model (BPNet) trained in ChIP-nexus peaks. c) Detected motifs by TF-MoDISco using the contribution scores in ChIP-nexus peaks of the sequence-to-profile BPNet (profile reg.) or the binary classification model (binary class). A light color denotes a high number of seqlets for each motif. Motifs not discovered or motifs supported by less than 100 seqlets are shown in black. Questionable motifs are displayed separately on the right. d) The number of motif instances (500 bp within ChIP-nexus peak summit) showing a ChIP-nexus footprint (y-axis) within the top N motif instances with highest contribution scores (x-axis) from the held-out (test) chromosomes 1, 8 and 9. A site was considered to show a ChIP-nexus footprint if the number of reads at the position of the aggregate footprint summit (averaged across both strands) is higher than the 90th percentile value of all motif instances detected by the profile regression model for the corresponding TF (i.e. same as in Extended Data Fig. 3b).
Extended Data Fig. 5
Extended Data Fig. 5. Strict motif spacings are found on retrotransposons and indirectly bound motifs can be validated
a) To show that TF binding occurs with strict spacings in retrotransposons and that this is likely ancestral, the RLTR9E N6 motif is shown as an example. Sequences of the individual instances in the genome were sorted by the Kimura distance from the consensus motif, with the most similar sequences on top (which are likely more ancestral). Nanog, Sox2 and Klf4 ChIP-nexus binding footprints are shown in the same order on the right (+ strand reads in red, − strand reads in blue), revealing that the binding site spacing is largely constant across all sequences. b) Analysis of the most frequent distances between motif pairs (with >500 co-occurrences, distance measured at the trimmed motifs’ centers). The top 1% most frequent distances mapped in 83% to ERVs and were often longer than 20 bp. c) To validate the identified Zic3 motif instances, Zic3 ChIP-nexus experiments were performed. The average signal across the Zic3 instances reveals a strong Zic3 binding footprint. d) A similar validation was performed for the Esrrb motif instances, revealing that the Esrrb ChIP-nexus signal is present but more diffuse at the discovered Esrrb motif instances. e) To better understand the binding of Oct4 to the B-box, which is frequently found in tRNA, tRNA-overlapping B-box motif instances were reoriented to match the transcriptional direction and sorted by tRNA gene start proximity. This reveals Oct4 binding at tRNA gene start/stop sites. f) Amino acid anti-codons and their copy count of the tRNAs that overlapped with the B-box motif instances.
Extended Data Fig. 6
Extended Data Fig. 6. Additional genomic in-silico interaction analyses confirm the directional effects
a) Example genomic in-silico mutagenesis analysis at the distal Oct4 enhancer. Predicted ChIP-nexus profiles and the contribution scores greatly decrease at both motifs (Oct4-Sox2 and Nanog) when erasing the Oct4-Sox2 motif (through random sequence insertion). By contrast, when the Nanog motif is erased (right), the predicted profile and the contribution scores of Oct4-Sox2 motif remain intact. b) Such directional effect of motifs can be quantified by the corrected binding fold change (Supplementary Fig. 10a) for all motif pairs in the genome and visualized as a scatterplot. c) Example scatterplot for the interaction between Sox2 and Nanog. Sox2 shows a positive directional effect on Nanog most profound for short motif distances (<35 bp). d) Predicted binding fold changes for all motif pairs in genomic sequences.
Extended Data Fig. 7
Extended Data Fig. 7. Helical periodicity of Nanog motifs is not discovered with traditional methods and requires BPNet’s large receptive field
a) The pairwise spacing of Nanog motif instances located up to 100 bp away from the ChIP-nexus peak summits in all possible strand orientations (rows) for different methods and/or thresholds (columns). Results for all chromosomes are shown. b) The pairwise spacing of Nanog motif instances when BPNet is trained with different numbers of convolutional layers (Fig. 1g). BPNet with only a single convolutional layer (first column) is unable to capture the 10 bp periodicity due to the limited receptive field similar to PWMs.
Extended Data Fig. 8
Extended Data Fig. 8. The ChIP-nexus data on CRISPR-mutated ESCs are highly reproducible
a) Nanog and Sox2 ChIP-nexus profiles normalized to reads per million (RPM) show highly similar profiles and read counts across known enhancer regions for wild-type (Wt) and CRISPR ESCs with either a mutated Sox2 motif (Sox2 CRISPR) or mutated Nanog motif (Nanog CRISPR) at a selected genomic region (chr10: 85,539,626-85,539,777). b) Pairwise comparisons of ChIP-nexus RPM counts between Wt and CRISPR ESCs at bound genomic regions (151 bp centered on the respective motif) with Sox2 ChIP-nexus counts on Sox2 motifs and Nanog ChIP-nexus counts on Nanog motifs (motifs based on the original model). The bulk data (gray) are highly correlated and known enhancer regions as shown in Supplementary Fig. 5 (green) are highly reproducible between ESC lines. Note the specific loss of counts in the selected mutated genomic region (red) over wild-type. Pearson correlations (Rp) between groups are shown in the top left of each scatter plot.
Extended Data Fig. 9
Extended Data Fig. 9. The base-resolution BPNet model can be trained on ChIP-seq profiles
a) Observed read counts (Obs) and Predicted read counts (Pred) for BPNet trained on ChIP-seq data for the Zfp281 and Lefty1 enhancers located on the held-out (test) chromosome 1, with forward strand reads (dark) and reverse strand reads (light). For Obs, a sliding window of 50 bp was used to smooth the raw 5' end read counts (line); raw counts are shown as points on the bottom at y=0. b) BPNet predicts the ChIP-seq profile shape better than replicates. Multinomial log-likelihood difference compared to the constant model was used to evaluate the profile shape quality at different resolutions (from 1 bp to 10 bp windows) in held-out chromosomes 1, 8 and 9. A log-likelihood of 0 corresponds to the constant model. Multinomial log-likelihood was conditioned on the observed number of total counts as in the training loss. c) Total counts in 1 kb regions can be predicted by BPNet (red) at decent accuracy (measured by Pearson correlation with log(1+observed values)). They do not surpass replicate performance (blue), but are well above the Input control (grey). d) Obs and Pred as in panel a, as well as contribution scores for the known Oct4 enhancer. Motif instances derived by CWM scanning are highlighted with a green box.
Extended Data Fig. 10
Extended Data Fig. 10. BPNet trained on ChIP-seq discovers similar motifs and recovers the Nanog motif periodicity
a) BPNet applied to ChIP-seq discovers the majority of the motifs identified by BPNet applied to ChIP-nexus data. The models 'ChIP-nexus profile cr' and 'ChIP-seq profile cr' were trained on the union of the ChIP-nexus/seq peaks predicting Oct4, Sox2, and Nanog binding and were interpreted on the intersection of the ChIP-nexus/seq peaks. b) The pairwise spacing of Nanog motif instances derived from the ChIP-seq profile model in all possible strand orientations shows helical periodicity (similar to Extended Data Fig. 7a). c) Motif instance calling with CWM scanning has higher accuracy for BPNet trained on ChIP-nexus data than for BPNet trained on ChIP-seq data (evaluated on the union of the ChIP-nexus/seq peaks, 500 bp around the peak summit using ChIP-nexus footprints as ground truth). d) Training a sequence-to-profile model on ChIP-seq data yields more accurate motif instances (500 bp around the ChIP-seq peak summits using ChIP-nexus footprints as ground truth) than training a binary classification model or using a PWM scanning approach using FIMO for motifs derived directly from ChIP-nexus data. See Extended Data Fig. 3b, 4d and Supplementary Note for more details.
Fig. 1:
Fig. 1:. BPNet predicts ChIP-nexus signal at base resolution
a) ChIP-nexus experiments were performed on Oct4, Sox2, Nanog and Klf4 in mouse ESCs. After digestion of the 5’ DNA ends with lambda exonuclease, strand-specific stop sites were mapped to the genome at base resolution. Bound sites exhibit a distinct footprint of aligned reads, where the positive (+) strand peak occurs many bases before the negative (−) strand peak. b) Profile heatmaps of Oct4 and Sox2 ChIP-nexus data at the 500 Oct4-Sox2 motifs with the most ChIP-nexus reads (color depth for each strand represents normalized signal intensity). c) The average Oct4 and Sox2 ChIP-nexus footprints and ChIP-seq profiles at the 500 Oct4-Sox2 or Sox2 motifs with the most reads. The ChIP-nexus data have higher resolution and show less unspecific binding of Oct4 to the Sox2 motif. d) Architecture of the convolutional neural network (BPNet) that was trained to simultaneously predict the ChIP-nexus read counts at each strand for all TFs from 1 kb DNA sequences, while being prevented from learning information already explained by a bias track (PAtCh-Cap control). e) Observed and predicted ChIP-nexus read counts for the Lefty enhancer located on the held-out test chromosome 8. f) BPNet predicts the positions of high ChIP-nexus signal within the profiles at replicate-level accuracy as measured by the area under precision-recall curve (auPRC) at resolutions from 1 to 10 bp in held-out test chromosomes 1, 8 and 9. Results for the average ChIP-nexus profile, the PAtCh-Cap control profile and a randomized profile are shown as control. g) More convolutional layers (x-axis) increase the number of input bases considered for profile prediction at each position (receptive field) and this yields increasingly more accurate profile shape predictions on the tuning chromosomes 2-4 (measured in auPRC as above), showing that larger sequence context is important
Fig. 2:
Fig. 2:. TF motifs and their genomic instances can be accurately derived from BPNet using interpretation tools
a) DeepLIFT recursively decomposes the predicted TF-specific binding output of the model and quantifies the contribution of each base of the input DNA sequence by backtracking the prediction through the network. b) Procedure for inferring and mapping predictive motif instances using the known distal Oct4 enhancer (chr17:35504453-35504603) as an example. From the predicted ChIP-nexus profile for each TF (top), DeepLIFT derives TF-specific profile contribution scores (middle). Regions with high contribution scores (called seqlets) resemble TF binding motifs. Seqlets are annotated by scanning the contribution scores with motifs discovered by TF-MoDISco (bottom). c) To discover motifs, TF-MoDISco scans for seqlets, extends the seqlets to 70 bp, performs pairwise alignments and clusters the seqlets. For each cluster, a motif is derived as contribution weight matrix (CWM), obtained by averaging the contribution scores of each of the 4 bases at each position across all aligned seqlets. The corresponding position frequency matrix (PFM) is the frequency of bases at each position. Motif instances are identified by scanning the CWM for each motif for high scoring matches across the profile contribution scores in the genomic regions. d) Example of a motif (N6) where the PFM differs from the CWMs. The PFM indicates that it is a repeat sequence (RLTR9E), while the CWM for each TF highlights the sequences that contribute to binding. e) Number of motif instances in thousands (k) found in the ~150,000 genomic regions for the 11 representative motifs. f) Histogram of the number mapped motif instances in thousands (k) found per region. g) Evaluation of the mapped motifs using previously identified regions that lose ATAC-seq signal in response to either Oct4 or Sox2 depletion (but not both). BPNet motif instances of Oct4-Sox2 and Sox2 (ranked by contribution scores) outperformed those obtained by HOMER and MEME (ranked by PWM match scores). h) A linear model based on the bottleneck layer of the trained BPNet model makes accurate quantitative predictions of the log fold-change loss in ATAC-seq signal upon depletion of Oct4 (ΔOct4) or Sox2 (ΔSox2). Results are shown with Pearson correlation coefficient (Rp) for the test chromosomes 1, 8 and 9 that were held out during training. See Supplementary Fig. 7b for a similar model based on motif instance features.
Fig. 3:
Fig. 3:. Discovery of composite motifs and indirect binding footprints
a) The CWMs of Oct4, Oct4-Oct4, Sox2 and Oct4-Sox2 were identified by TF-MoDISco as separate motifs (motif IDs = first letter of the TF + number, e.g. O1 discovered for Oct4), highlighting its ability to identify composite motifs. The CWM of the Oct4-Sox2 composite motif correlates with the structure of Oct1 and Sox2 bound to the Oct4-Sox2 motif. For visualization, the amino acids of Oct1 and Sox2 that contact DNA are shown as solid, and the atoms in the DNA bases, shown as colored spheres, are sized according to the contribution scores shown in the CWM below. b) Nanog ChIP-nexus binding footprints were associated with three Nanog motif variants (shown as CWM). For all motifs, the main footprint was found at the TCA sequence. The CWM of Nanog-mix (N5) and Nanog-alt (N4) contain a sequence that matches the sequence AATGGGC bound by Nanog in a crystal structure. The CWM of Nanog-alt contains an alternative GG. c) The discovered representative short motifs contain known motifs, new motifs and known motifs new in this context. All sequence logos share the same y-axis. The B-box mediates RNA polymerase III transcription, and is associated with high levels of Oct4 binding upstream and downstream of tRNA (Extended Data Fig. 5e,f). d) The average contribution score of the motif is shown for each TF. The highest score may indicate the TF that binds directly. e) The TF’s average ChIP-nexus footprint better indicates whether the motif is directly bound (sharp profile, marked with gray background), indirectly bound (fuzzy profile) or not bound at all. The footprints for each TF share the same y-axis.
Fig. 4:
Fig. 4:. In-silico motif interaction analysis reveals TF cooperativity and motif syntax
a) In the synthetic motif interaction analysis, Motif A is inserted into random sequences and the average profile for TF A is predicted by BPNet. The footprint’s summits are recorded (dotted lines) and the height (hA) is measured at this position. Motif B is then inserted at a specific distance (d) from Motif A into a new set of random sequences and the average predicted footprint height is measured at the reference summit position (hAB at dotted lines). The interaction of Motif B->Motif A as a function of d is quantified as the footprint height fold-change (hAB /hA) after correcting hAB for shoulder effects or indirect binding footprints from the nearby motif (Supplementary Fig. 10a). The interaction of Motif A->Motif B is obtained in an analogous way. The results show functions consistent with protein-range interactions between Nanog and Sox2 or nucleosome-range interactions exerted by the Oct4-Sox2 motif (bound by Oct4) on the binding of Sox2, Nanog or Klf4 on their respective motifs. Results are shown for the +/+ orientation of the two motifs (see Supplementary Fig. 10c for all motif pair orientations and Supplementary Fig. 10b for the frequency of motif pairs). b) In the genomic motif interaction analysis, naturally occurring instances of Motif A and Motif B as determined by CWM scanning are used. The average predicted footprint height and position of TF A is measured in the presence of Motif B (hAB) and after replacing Motif B with random bases (hA at dotted lines). The same corrected footprint height fold-change hAB /hA or hBA /hB as a function of d is used to quantify the interaction. The results from the average of all motif orientations is similar to those in the synthetic motif interaction analysis. c) Quantification of the results shown in (b) as heat map. The distances <35 bp is shown as representative for protein-range interactions, while 70-150 bp is shown as representative for nucleosome-range interactions. d) Odds by which two motifs are found within a specified distance from each other divided by the odds the two motifs would be found in the proximity by chance (observed by permuting the region index). * denotes p-value <10−5 using Pearson's Chi-squared test (Supplementary Methods).
Fig. 5:
Fig. 5:. Pervasive helical periodicity between Nanog and partner motifs
a) The CWM, but not the PFM, of the main Nanog motif has periodically occurring contributing bases in the flanks (example in enlarged window). b) A heat map of the contribution scores of the individual Nanog instances also show this periodic pattern, the average of which is shown below. c) A Fourier power spectrum of the average contribution score around Nanog motif instances (after subtracting the smoothed signal) reveals an average periodicity of 10.5 +/− 0.3 bp. d) Fraction of the power spectrum with 10.5 bp periodicity of the average contribution scores around the motifs discovered for each TF (19 for Oct4, 10 for Sox2, 19 for Nanog, and 13 for Klf4) shows that the helical periodicity is specific for Nanog binding. Important motifs are labelled; unlabeled high-scoring motifs are from retrotransposons. The box-plots mark the median, the upper and lower quartiles, and the 1.5x interquartile range (whiskers). e) The pairwise spacing of Nanog motif instances in all possible orientations also show a periodic pattern (++ includes the −− orientation). f-h) Heterologous motif combinations of Nanog with Sox2, Oct4-Sox2 and Zic3 also show a preferred spacing with the same periodicity. The distance between two motifs is always kept positive by placing the second motif in the pair downstream of the first motif. All 4 motif orientations are considered: + denotes the motif lies on the forward strand and − denotes the motifs on the reverse strand. i-k) Nanog ChIP-nexus signal at the reference summit position for each motif instance across every motif pair (blue dots), with the smooth curve fit (B-splines) depicted as a red line and the 95% confidence intervals depicted as blue ribbon. Number of data-points used to estimate 50 smoothing parameters for each plot: 8930 for Nanog<>Nanog, 4011 for Sox2<>Nanog, and 4947 for Oct4-Sox2<>Nanog. Nanog on average binds higher when Nanog motifs have the preferred inter-motif distance.
Fig. 6:
Fig. 6:. CRISPR mutations in a Sox2 and Nanog motif validate BPNet’s predictions
(a-d) A Sox2 motif and Nanog motif in a selected genomic region were mutated through CRISPR/Cas9 and homologous recombination in mouse ESCs. Predicted and observed ChIP-nexus profiles (+ strand above zero, − strand below zero) in reads per million (RPM) are shown for wild-type cells and mutant cells across 300 bp (chr10:85,539,550-85,539,850). a) Upon mutating the Sox2 motif, the Sox2 footprint is lost as predicted. b) In contrast, mutating the Nanog motif does not noticeably affect Sox2 binding. c) Consistent with directional cooperativity, the Sox2 mutation does however affect Nanog binding, which is reduced throughout the region as predicted. d) Similarly, mutating the Nanog motif not only abrogates the Nanog footprint, but also results in reduced binding nearby as predicted. See Extended Data Fig. 8, Supplementary Fig. 14 for reproducibility validations.

Comment in

References

    1. Gerstein MB et al. Architecture of the human regulatory network derived from ENCODE data. Nature 489, 91–100 (2012). - PMC - PubMed
    1. ENCODE Project Consortium. An integrated encyclopedia of DNA elements in the human genome. Nature 489, 57–74 (2012). - PMC - PubMed
    1. Roadmap Epigenomics Consortium et al. Integrative analysis of 111 reference human epigenomes. Nature 518, 317–330 (2015). - PMC - PubMed
    1. Morgunova E & Taipale J Structural perspective of cooperative transcription factor binding. Curr. Opin. Struct. Biol 47, 1–8 (2017). - PubMed
    1. Zinzen RP, Senger K, Levine M & Papatsenko D Computational models for neurogenic gene expression in the Drosophila embryo. Curr. Biol 16, 1358–1365 (2006). - PubMed

Online methods references

    1. Koenecke N, Johnston J, He Q, Meier S & Zeitlinger J Drosophila poised enhancers are generated during tissue patterning with the help of repression. Genome Res. 27, 64–74 (2017). - PMC - PubMed
    1. Stemmer M, Thumberger T, Del Sol Keyer M, Wittbrodt J & Mateo JL Cctop: an intuitive, flexible and reliable crispr/cas9 target prediction tool. PLoS ONE 10, e0124633 (2015). - PMC - PubMed
    1. Labuhn M et al. Refined sgRNA efficacy prediction improves large- and small-scale CRISPR-Cas9 applications. Nucleic Acids Res. 46, 1375–1385 (2018). - PMC - PubMed
    1. Connelly JP & Pruett-Miller SM CRIS.py: A Versatile and High-throughput Analysis Program for CRISPR-based Genome Editing. Sci. Rep 9, 4194 (2019). - PMC - PubMed
    1. Martin M Cutadapt removes adapter sequences from high-throughput sequencing reads. EMBnet j. 17, 10 (2011).

Publication types

MeSH terms