

Two maize cultivars of contrasting leaf size show different leaf elongation rates with identical patterns of extension dynamics and coordination
- PMID: 33604014
- PMCID: PMC7877697
- DOI: 10.1093/aobpla/plaa072
Two maize cultivars of contrasting leaf size show different leaf elongation rates with identical patterns of extension dynamics and coordination
Abstract
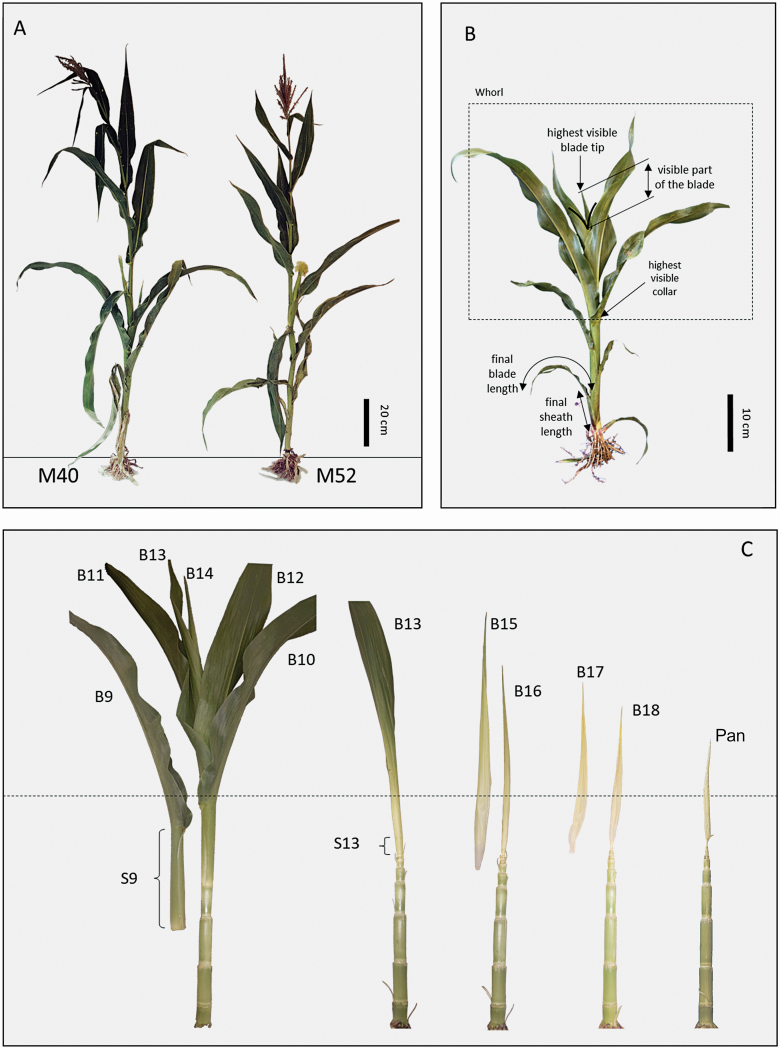
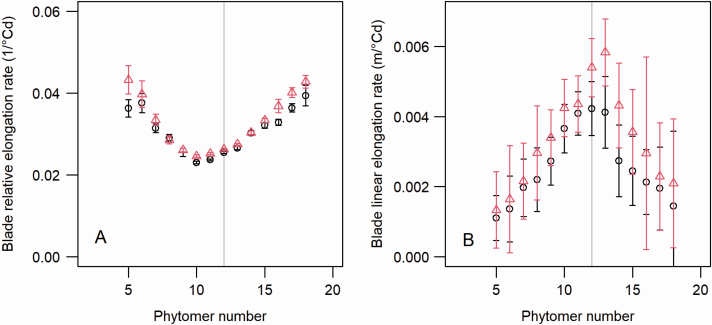
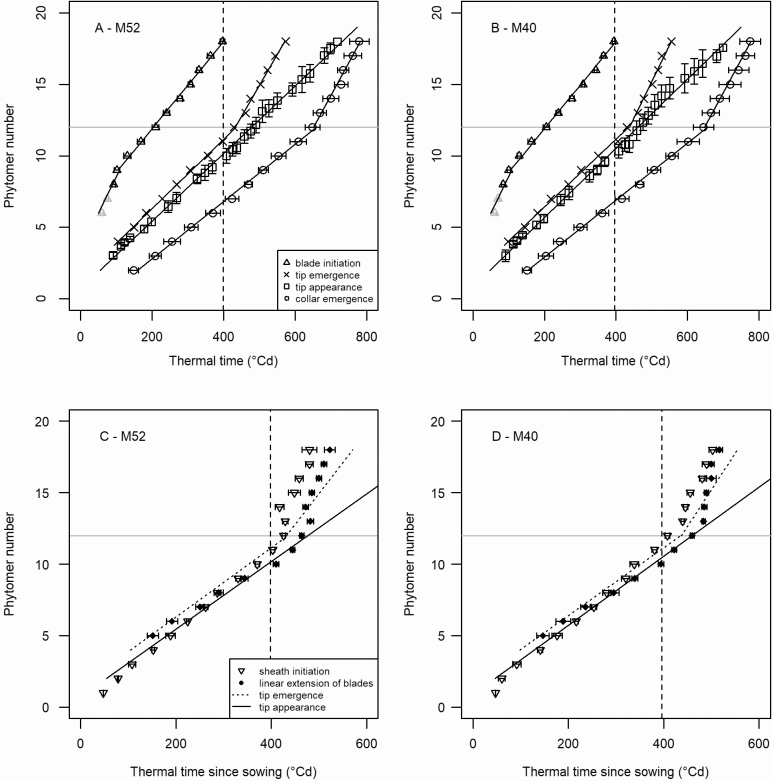
Simulating leaf development from initiation to maturity opens new possibilities to model plant-environment interactions and the plasticity of plant architecture. This study analyses the dynamics of leaf production and extension along a maize (Zea mays) shoot to assess important modelling choices. Maize plants from two cultivars originating from the same inbred line, yet differing in the length of mature leaves were used in this study. We characterized the dynamics of the blade and sheath lengths of all phytomers by dissecting plants every 2-3 days. We analysed how differences in leaf size were built up and we examined the coordination between the emergence of organs and phases of their extension. Leaf extension rates were higher in the cultivar with longer leaves than in the cultivar with shorter leaves; no differences were found in other aspects. We found that (i) first post-embryonic leaves were initiated at a markedly higher rate than upper leaves; (ii) below ear position, sheaths were initiated at a time intermediate between tip emergence and appearance, while above the ear position, sheaths were initiated at a high rate, such that the time interval between the blade and sheath initiations decreased for these leaves; and (iii) ear position also marked a change in the correlation in size between successive phytomers with little correlation of size between upper and lower leaves. Our results identified leaf extension rate as the reason for the difference in size between the two cultivars. The two cultivars shared the same pattern for the timing of initiation events, which was more complex than previously thought. The differences described here may explain some inaccuracies reported in functional-structural plant models. We speculate that genotypic variation in behaviour for leaf and sheath initiation exists, which has been little documented in former studies.
Keywords: Blade; Zea mays; coordination; emergence; extension rate; initiation; leaf; phyllochron; phytomer; sheath.
© The Author(s) 2021. Published by Oxford University Press on behalf of the Annals of Botany Company.
Figures


Similar articles
-
Contrasting phenotypes emerging from stable rules: A model based on self-regulated control loops captures the dynamics of shoot extension in contrasting maize phenotypes.Ann Bot. 2020 Sep 14;126(4):615-633. doi: 10.1093/aob/mcz168. Ann Bot. 2020. PMID: 31630162 Free PMC article.
-
Effects of nitrogen and vapour pressure deficit on phytomer growth and development in a C4 grass.AoB Plants. 2017 Jan 2;8:plw075. doi: 10.1093/aobpla/plw075. Print 2016. AoB Plants. 2017. PMID: 27810947 Free PMC article.
-
Towards modelling the flexible timing of shoot development: simulation of maize organogenesis based on coordination within and between phytomers.Ann Bot. 2014 Sep;114(4):753-62. doi: 10.1093/aob/mcu051. Ann Bot. 2014. PMID: 24748619 Free PMC article.
-
Onset of sheath extension and duration of lamina extension are major determinants of the response of maize lamina length to plant density.Ann Bot. 2006 Nov;98(5):1005-16. doi: 10.1093/aob/mcl177. Epub 2006 Aug 22. Ann Bot. 2006. PMID: 16926228 Free PMC article.
-
The specification of leaf identity during shoot development.Annu Rev Cell Dev Biol. 1998;14:373-98. doi: 10.1146/annurev.cellbio.14.1.373. Annu Rev Cell Dev Biol. 1998. PMID: 9891788 Review.
Cited by
-
A successive time-to-event model of phyllochron dynamics for hypothesis testing: application to the analysis of genetic and environmental effects in maize.Plant Methods. 2023 Jun 7;19(1):54. doi: 10.1186/s13007-023-01029-7. Plant Methods. 2023. PMID: 37287031 Free PMC article.
References
-
- Abbe EC, Phinney BO, Baer DF. 1951. The growth of the shoot apex in maize: external features. American Journal of Botany 38: 737–744.
-
- Arredondo JT, Schnyder H. 2003. Components of leaf elongation rate and their relationship to specific leaf area in contrasting grasses. New Phytologist 158: 305–314.
-
- Birch CJ, Andrieu B, Fournier C, Kroesen C. 2007. Kinetics of leaf extension in maize: parameterization for two tropically adapted cultivars planted on two dates at Gatton. European Journal of Agronomy 27: 215–224.
-
- Bolduc N, O’Connor D, Moon J, Lewis M, Hake S. 2012. How to pattern a leaf. Cold Spring Harbor Symposia on Quantitative Biology 77:47–51. - PubMed
LinkOut - more resources
Full Text Sources
Other Literature Sources
