Review
. 2021 Jan 30:2021:8820444.
doi: 10.1155/2021/8820444. eCollection 2021.

Multimodal Imaging of Lamellar Macular Holes

Affiliations
Review

Multimodal Imaging of Lamellar Macular Holes

Roberto dell'Omo et al. J Ophthalmol. .

Abstract

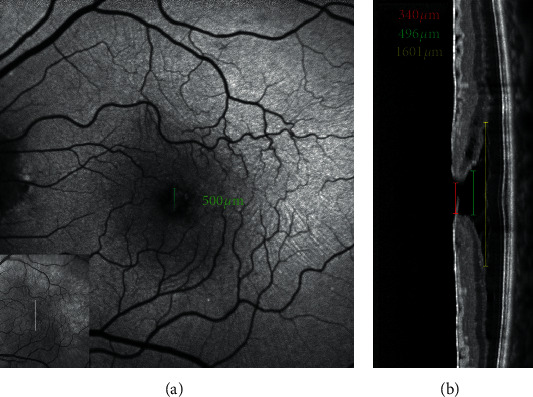
Evolution of imaging techniques has renewed interest in the diagnosis of lamellar macular hole (LMH) and greatly implemented the possibilities of gaining more detailed insights into its pathogenesis. Among noninvasive techniques, optical coherence tomography (OCT) is considered the primary examination modality to study LMHs, given its ability to image foveal structure and its widespread availability. OCT also allows to resolve the epiretinal materials associated with LMH, i.e., tractional epiretinal membranes (ERMs) and epiretinal proliferation (EP). En face OCT reconstructions are useful to confirm the foveal abnormalities shown by the eyes with LMH, whereas OCT angiography may reveal alterations of the size and shape of the foveal avascular zone and alterations of the density of the superficial and deep vascular plexuses. On slit-lamp biomicroscopy or fundus camera examination, LMH appears as a round or oval, reddish lesion at the center of the macula, slightly darker than the surrounding retina. The associated tractional ERM, causing wrinkling and glistening of the retinal surface, is usually readily appreciable, whereas EP is hardly apparent on biomicroscopy or fundus photography since the retina surface appears smooth. When imaged with blue fundus autofluorescence (B-FAF) imaging, LMHs are characterized by an increased autofluorescent signal, the intensity of which does not correlate with the thickness of the residual outer retinal tissue. Green reflectance and blue reflectance (BR) images clearly show the increased reflection and wrinkling of the retinal surface caused by tractional ERM associated with LMH. BR and multicolor imaging enable the visualization of EP associated with LMH in the form of a sharply demarcated dark area and in the form of a yellowish area surrounding the hole, respectively. Scarce data regarding invasive imaging techniques, such as fluorescein angiography, for the study of LMH are available in the literature. The aim of this review is to evaluate the contribution that each imaging modality can provide to study the morphologic characteristics of LMH.


Conflict of interest statement

No conflicts of interest exist for any of the authors.

Figures

Figure 1
Figure 1
Flow diagram showing the methodology followed to review the literature and select the papers of interest.
Figure 2
Figure 2
(a–c) Fundus camera (FC) color photograph, infrared (IR) image, and optical coherence tomography (OCT) of epiretinal membrane (ERM) foveoschisis. (a) On FC there is an oval reddish lesion at the fovea, (b) whereas on IR image, wrinkling of the retinal surface is appreciated; (c) on OCT there is an ERM over the inner limiting membrane (ILM) with the presence of hyporeflective spaces between the ERM and the ILM and a foveoschisis at the level of Henle fiber layer. (d–f) FC color photograph, IR image, and OCT of lamellar macular hole (LMH). (d) On FC a round reddish lesion at the fovea is noted; (e) on IR image the retinal surface appears smooth; (f) on OCT irregular foveal contour, foveal cavity with undermined edges, thinning of the fovea, foveal bump, and ellipsoid line disruption are present.
Figure 3
Figure 3
Blue fundus autofluorescence (B-FAF) (a, c, e) and optical coherence tomography images (OCT) (b, d, f) in eyes with epiretinal membrane (ERM) foveoschisis and lamellar macular hole (LMH). On B-FAF images, areas of increased autofluorescence at the center of the fovea can be present in both conditions. On OCT images, ERM foveoschisis is, by definition, associated with a tractional epiretinal membrane (arrowheads, b), whereas LMH may be associated with epiretinal proliferation (EP, d, asterisks) or with concomitant ERM and EP (f, arrowhead and asterisk, respectively). Intraretinal schisis and usually intact external limiting membrane (ELM) and ellipsoid zone (EZ) are noted in presence of ERM foveoschisis (b) whereas undermined edges and disrupted ELM and EZ are noted in presence of LMH. The horizontal white arrows on the infrared image (small squares within the B-FAF images) indicate the location of the corresponding OCT scans.
Figure 4
Figure 4
Blue fundus autofluorescence (B-FAF) and optical coherence tomography images (OCT) in an eye with standard macular pseudohole (PSH) and in an eye with PSH with lamellar cleavage of its edges according to Gaudric et al. [14]. B-FAF (a, c): an increased autofluorescent signal is present at the fovea in both cases. On OCT (b), standard PSH is characterized by foveal centre sparing epiretinal membrane, retinal thickening, verticalised/steepened foveal profile, and near normal central foveal thickness. PSH with lamellar cleavage of its edges (d) shows in addition an intraretinal schisis. and has been reclassified as epiretinal membrane foveoschisis by Hubschman and coworkers [10].
Figure 5
Figure 5
Multimodal imaging of epiretinal membrane (ERM) foveoschisis. (a) Structural optical coherence tomography (OCT) shows the hyperreflective line corresponding to the ERM on the retinal surface and the intraretinal schisis at the level of the Henle fiber layer. (b) On en face OCT (segmentation at the level of the vitreoretinal interface) signs of traction like folds and retinal wrinkling are visible in the macular area. The horizontal green line indicates the location of the corresponding structural OCT scan. (c) Blue fundus autofluorescence shows an area of increased signal at the fovea and retinal vessel printings at the superonasal aspect of the macula (arrows). Superficial wrinkling of the inner retina is notable on the infrared image (d) but is better visualized on the green reflectance image (e) where several foci of traction are also evident.
Figure 6
Figure 6
Multimodal imaging of lamellar macular hole. (a) Structural optical coherence tomography (OCT) shows irregular foveal contour, foveal cavity with undermined edges, posterior vitreous detachment with pseudooperculum, and thinning of the fovea at its center. (b) On en face OCT (segmentation at the level of the vitreoretinal interface), no signs of traction like folds and retinal wrinkling are visible in the macular area. Blue-fundus autofluorescence (c) shows an area of increased signal at the fovea partially masked by the pseudo-operculum. On infrared (d) and on green-reflectance (e) images, the retinal surface appears smooth.
Figure 7
Figure 7
Structural and en face optical coherence tomography (OCT) of epiretinal membrane (ERM) foveoschisis. A structural OCT illustrates an ERM foveoschisis, with a sharp split at the level of the outer nuclear-Henle fiber layers complex. (a) Tractional ERM is visible. (b) The en face OCT segmented at the level of the outer nuclear-Henle fiber layers complex illustrates hyporeflective intraretinal cystoid spaces disposed in a radial pattern centered into the fovea. Such disposition may recall a “spoke-wheel” shape as shown in the drawing (c).
Figure 8
Figure 8
Blue fundus autofluorescence (a) and optical coherence tomography (OCT, b)-based measurements in an eye with epiretinal membrane foveoschisis. The horizontal white arrow on the infrared image (small square within the B-FAF image) indicates the location of the corresponding OCT scans; the green caliper on the B-FAF image indicates where the diameter of the increased area of autofluorescence was measured. The measurements on OCT image are taken at the level of the inner limiting membrane (red line), Henle fiber layer (green line), and schisis (yellow line) level. Note the similarity between the diameter of the area of increased autofluorescence measured from B-FAF image and the diameter measured at the level of the Henle fiber layer from OCT image.
Figure 9
Figure 9
Blue fundus autofluorescence (a) and optical coherence tomography (OCT, b)-based measurements in an eye with lamellar macular hole. The horizontal white arrow on the infrared image (small square within the B-FAF image) indicates the location of the corresponding OCT scans; the green caliper on the B-FAF image indicates where the diameter of the increased area of autofluorescence was measured. The measurements on OCT image are taken at the level of the inner limiting membrane (red line) and Henle fiber layer (green line). Note the similarity between the diameter of the area of increased autofluorescence measured from B-FAF image and the diameter measured at the level of the Henle fiber layer from OCT image.
Figure 10
Figure 10
B-FAF and OCT imaging of Foveal Abnormality associated with epiretinal Tissue of medium reflectivity and Increased blue-light fundus Autofluorescence Signal (FATIAS). In the step type, the B-FAF image shows an area of increased autofluorescent signal (a), and, in the OCT image, there is an asymmetric contour of the foveal pit with one side more elevated than the other (b). The white lines on the B-FAF images in the small squares indicate the OCT scan level. In the rail type, the B-FAF image shows an increased autofluorescent signal at the fovea (c), and the OCT profile is characterized by a shallow foveal pit and a rail of tissue of medium reflectivity that is thicker in the central part and thinner at the edges of the foveal pit and that is similar to epiretinal proliferation (d).
Figure 11
Figure 11
Multimodal imaging of a lamellar macular hole (LMH) with associated epiretinal proliferation (EP). On color fundus photograph (a), an oval reddish foveal lesion with no distortion or wrinkling of the surrounding retinal tissue is visible. On multicolor image (b), a yellowish area around the hole is visible, but its boundaries are not clearly delineated. On infrared reflectance image (c), no remarkable features are noted. On horizontal and oblique optical coherence tomography sections (d and e), EP in the form of material with medium reflectivity is observed on the retinal surface around the hole. On blue-fundus autofluorescence imaging (f), discrete areas of increased autofluorescent signal are visible. On blue-reflectance image (g), a sharply demarcated dark area, surrounding the hole, is evident. This area corresponds precisely to the surface covered by the EP on OCT scans. On green reflectance image (h), there are no peculiar findings corresponding to the area with EP.
Figure 12
Figure 12
Optical coherence tomography (OCT) and OCT angiography of the eyes with epiretinal membrane (ERM) foveoschisis and lamellar macular hole (LMH). The tractional ERM associated with the foveoschisis (a) causes distortion and tortuosity of the superficial vessels (b). The foveal avascular zone (FAZ) of the deep capillary plexus appears enlarged (c). In the eye with LMH (d), the superficial vessels are not distorted (e). The FAZ of the deep capillary plexus appears enlarged with an irregular contour (f).

References

    1. Gass J. D. Lamellar macular hole: a complication of cystoid macular edema after cataract extraction: a clinicopathologic case report. Transactions of the American Ophthalmological Society. 1975;73:231–50. - PMC - PubMed
    1. Takahashi H., Kishi S. Tomographic features of a lamellar macular hole formation and a lamellar hole that progressed to a full-thickness macular hole. American Journal of Ophthalmology. 2000;130(5):677–679. doi: 10.1016/s0002-9394(00)00626-7. - DOI - PubMed
    1. Haouchine B., Massin P., Tadayoni R., Erginay A., Gaudric A. Diagnosis of macular pseudoholes and lamellar macular holes by optical coherence tomography. American Journal of Ophthalmology. 2004;138(5):732–739. doi: 10.1016/j.ajo.2004.06.088. - DOI - PubMed
    1. Witkin A. J., Ko T. H., Fujimoto J. G., et al. Redefining lamellar holes and the vitreomacular interface: an ultrahigh-resolution optical coherence tomography study. Ophthalmology. 2006;113(3):388–397. doi: 10.1016/j.ophtha.2005.10.047. - DOI - PMC - PubMed
    1. Chen J. C., Lee L. R. Clinical spectrum of lamellar macular defects including pseudoholes and pseudocysts defined by optical coherence tomography. British Journal of Ophthalmology. 2008;92(10):1342–1346. doi: 10.1136/bjo.2007.133041. - DOI - PMC - PubMed

LinkOut - more resources