. 2021 Feb 5:9:e10735.
doi: 10.7717/peerj.10735. eCollection 2021.

Quantifying upper limb motor impairment in people with Parkinson's disease: a physiological profiling approach

Affiliations

Quantifying upper limb motor impairment in people with Parkinson's disease: a physiological profiling approach

Lewis A Ingram et al. PeerJ. .

Abstract

Background: Upper limb motor impairments, such as slowness of movement and difficulties executing sequential tasks, are common in people with Parkinson's disease (PD).

Objective: To evaluate the validity of the upper limb Physiological Profile Assessment (PPA) as a standard clinical assessment battery in people with PD, by determining whether the tests, which encompass muscle strength, dexterity, arm stability, position sense, skin sensation and bimanual coordination can (a) distinguish people with PD from healthy controls, (b) detect differences in upper limb test domains between "off" and "on" anti-Parkinson medication states and (c) correlate with a validated measure of upper limb function.

Methods: Thirty-four participants with PD and 68 healthy controls completed the upper limb PPA tests within a single session.

Results: People with PD exhibited impaired performance across most test domains. Based on validity, reliability and feasibility, six tests (handgrip strength, finger-press reaction time, 9-hole peg test, bimanual pole test, arm stability, and shirt buttoning) were identified as key tests for the assessment of upper limb function in people with PD.

Conclusions: The upper limb PPA provides a valid, quick and simple means of quantifying specific upper limb impairments in people with PD. These findings indicate clinical assessments should prioritise tests of muscle strength, unilateral movement and dexterity, bimanual coordination, arm stability and functional tasks in people with PD as these domains are the most commonly and significantly impaired.

Keywords: Hypokinesia; Levodopa; Movement disorders; Parkinson disease; Tremor; Upper extremity.


Conflict of interest statement

The authors declare there are no competing interests.

Figures

Figure 1
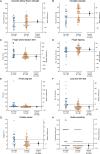
Figure 1. Differences in performance in each test of the upper limb PPA between people with PD and age- and sex-matched healthy controls for (A) isometric elbow flexion strength, (B) handgrip strength, (C) finger-press reaction time, (D) finger tapping, (E) 9-hole peg test, (F) loop and wire test, (G) position sense, and (H) tactile sensitivity.
Test scores from the PD group performed during their ‘off’ medication state. Blue circles represent each individual PD participant’s test score for that particular test, while orange circles represent each individual control participant’s test score. The black circle located along the right axis of each graph represents the mean or median difference (depending on the distribution of the test scores in each group) in test scores between the PD group and the age- and sex-matched control group. Error bars depict 95% confidence intervals. Note: due to missing data, a small number of control group test scores (n = 1–13) do not contain a complete set of 68 observations.
Figure 2
Figure 2. Differences in performance in each test of the upper limb PPA between people with PD and age- and sex-matched healthy controls for (A) two-point discrimination, (B) two-line discrimination, (C) bimanual pole test, (D) arm stability (eyes open), (E) arm stability (eyes closed), (F) arm stability (weight eyes open), (G) arm stability (weight eyes closed), and (H) the shirt task.
Test scores from the PD group performed during their ‘off’ medication state. Blue circles represent each individual PD participant’s test score for that particular test, while orange circles represent each individual control participant’s test score. The black circle located along the right axis of each graph represents the mean or median difference (depending on the distribution of the test scores in each group) in test scores between the PD group and the age- and sex-matched control group. Error bars depict 95% confidence intervals. Note: due to missing data, a small number of control group test scores (n = 1–13) do not contain a complete set of 68 observations.
Figure 3
Figure 3. Differences in performance in each test of the upper limb PPA between people with PD and age- and sex-matched healthy controls for (A) isometric elbow flexion strength, (B) handgrip strength, (C) finger-press reaction time, (D) finger tapping, (E) 9-hole peg test, (F) loop and wire test, (G) position sense, and (H) tactile sensitivity.
Test scores from the PD group performed during their ‘on’ medication state. Blue circles represent each individual PD participant’s test score for that particular test, while orange circles represent each individual control participant’s test score. The black circle located along the right axis of each graph represents the mean or median difference (depending on the distribution of the test scores in each group) in test scores between the PD group and the age- and sex-matched control group. Error bars depict 95% confidence intervals. Note: due to missing data, a small number of control group test scores (n = 1–13) do not contain a complete set of 68 observations.
Figure 4
Figure 4. Differences in performance in each test of the upper limb PPA between people with PD and age- and sex-matched healthy controls for (A) two-point discrimination, (B) two-line discrimination, (C) bimanual pole test, (D) arm stability (eyes open), (E) arm stability (eyes closed), (F) arm stability (weight eyes open), (G) arm stability (weight eyes closed), and (H) the shirt task.
Test scores from the PD group performed during their ‘on’ medication state. Blue circles represent each individual PD participant’s test score for that particular test, while orange circles represent each individual control participant’s test score. The black circle located along the right axis of each graph represents the mean or median difference (depending on the distribution of the test scores in each group) in test scores between the PD group and the age- and sex-matched control group. Error bars depict 95% confidence intervals. Note: due to missing data, a small number of control group test scores (n = 1–13) do not contain a complete set of 68 observations.
Figure 5
Figure 5. Upper limb Physiological Profile Assessment (PPA) test scores presented as standardised (z) scores for the PD group during the ‘off’ and ‘on’ medication states referenced to a cohort of people aged 50+ years without PD.
Test scores are presented as standardised (z) scores to allow direct comparison in performance between each test both within and between individuals. Each unit represents one standard deviation. A score of zero indicates an average level of performance compared to the reference population without PD, while negative scores represent below-average performances.Note that a and b indicate those variables that were positively skewed during the ‘off’ and ‘on’ states, respectively, and therefore converted to their logarithmic form prior to calculation of their z-scores. Abbreviations: EO, eyes open; EC, eyes closed; WEO, weight eyes open; WEC, weight eyes closed.
Figure 6
Figure 6. Upper limb physiological performance profiles of four individuals with PD, highlighting the inter-individual variability of upper limb motor impairment associated with PD.
Test scores are presented as standardised (z) scores referenced to a normative database of individuals from the general population aged 50 years and over. (A) A 58-year old male (HY = 2.0) demonstrating clear differences in performance between the ‘off’ and ‘on’ medication states in measures of arm stability. (B) A 73-year old male (HY = 1.0) who, despite below average muscle strength, displays above average levels of performance across all remaining physiological domains. (C) In contrast, a 63-year old male (HY = 3.0) who, with the exception of finger tapping speed, scores well below average in all other physiological domains. (D) A 71-year old female (HY = 3.0) with a mixed presentation, showing above average performance in measures of proximal muscle strength, motor speed and skin sensation while appearing impaired in reaction time, dexterity and functional tasks. Note: strength test scores are adjusted for gender. Note that a and b indicate those variables that were positively skewed during the ‘off’ and ‘on’ states, respectively, and therefore converted to their logarithmic form prior to calculation of their z-scores. Note: z-scores are capped at –4.5 in Fig. 1C. Abbreviations: EO, eyes open; EC, eyes closed; WEO, weight eyes open; WEC, weight eyes closed.
Figure 7
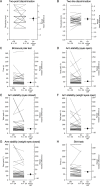
Figure 7. Comparisons of test scores in each test of the upper limb PPA between the ‘off’ and ‘on’ medication states in people with PD.
Each grey line plotted along the left axis of each graph represents the change in performance between the ‘off’ medication state (left-side of the line) and the ‘on’ medication state (right-side of the line) of each individual PD participant. The black circle located along the right axis of each graph represents the mean or median difference (depending on the distribution of the differences in test scores between medication states) in test scores between the ‘off and ‘on’ medication states. Error bars depict 95% confidence intervals.
Figure 8
Figure 8. Comparisons of test scores in each test of the upper limb PPA between the ‘off’ and ‘on’ medication states in people with PD.
Each grey line plotted along the left axis of each graph represents the change in performance between the ‘off’ medication state (left-side of the line) and the ‘on’ medication state (right-side of the line) of each individual PD participant. The black circle located along the right axis of each graph represents the mean or median difference (depending on the distribution of the differences in test scores between medication states) in test scores between the ‘off and ‘on’ medication states. Error bars depict 95% confidence intervals.

References

    1. Albin RL, Young AB, Penney JB. The functional anatomy of basal ganglia disorders. Trends in Neurosciences. 1989;12:366–375. doi: 10.1016/0166-2236(89)90074-X. - DOI - PubMed
    1. Almeida QJ, Wishart LR, Lee TD. Bimanual coordination deficits with Parkinson’s disease: the influence of movement speed and external cueing. Movement Disorders. 2002;17:30–37. doi: 10.1002/mds.10030. - DOI - PubMed
    1. Aragon A, Ramaswamy B, Ferguson C. The professional’s guide to Parkinson’s disease. Parkinson’s Disease Society of the United Kingdom; London: 2007.
    1. Barrantes S, Sánchez Egea AJ, González Rojas HA, Martí MJ, Compta Y, Valldeoriola F, Simo Mezquita E, Tolosa E, Valls-Solè J. Differential diagnosis between Parkinson’s disease and essential tremor using the smartphone’s accelerometer. PLOS ONE. 2017;25(12):e0183843 - PMC - PubMed
    1. Beaton DE, Davis AM, Hudak P, McConnell S. The DASH (Disabilities of the Arm, Shoulder and Hand) outcome measure: what do we know about it now? British Journal of Hand Therapy. 2001;6:109–118. doi: 10.1177/175899830100600401. - DOI

LinkOut - more resources