. 2021 Feb 1:22:100244.
doi: 10.1016/j.pacs.2021.100244. eCollection 2021 Jun.

Parts-per-billion detection of carbon monoxide: A comparison between quartz-enhanced photoacoustic and photothermal spectroscopy

Affiliations

Parts-per-billion detection of carbon monoxide: A comparison between quartz-enhanced photoacoustic and photothermal spectroscopy

Davide Pinto et al. Photoacoustics. .

Abstract

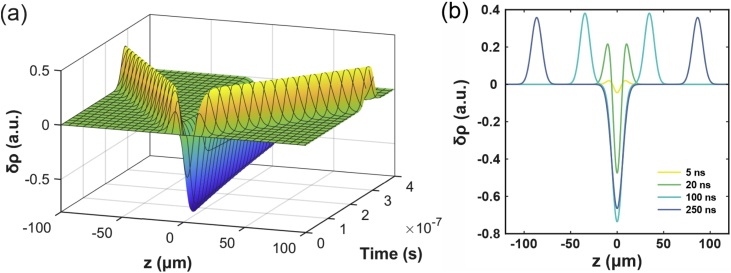
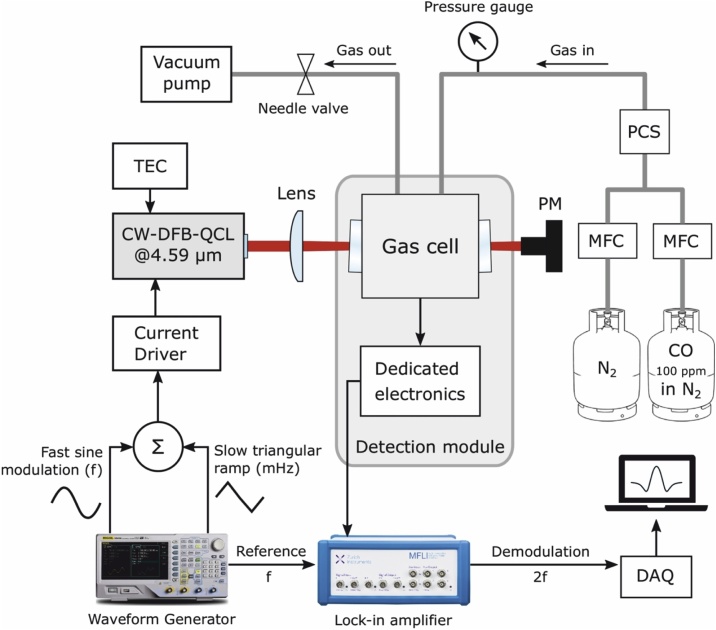
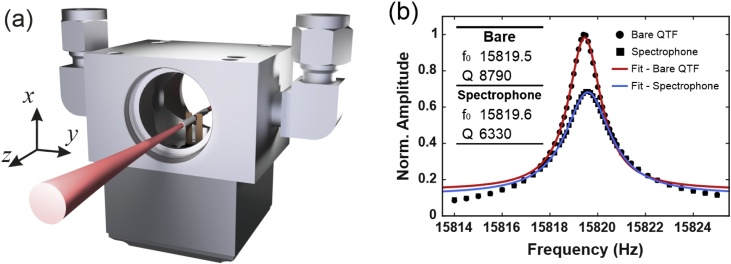
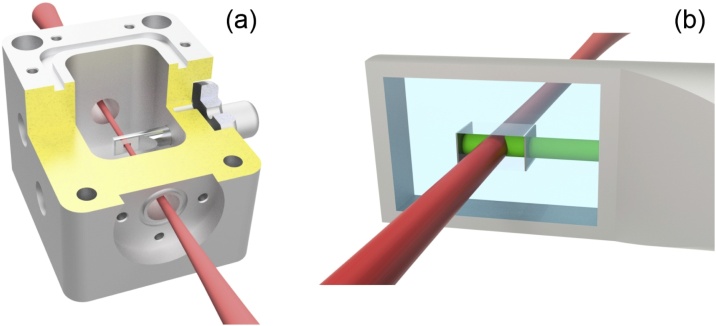
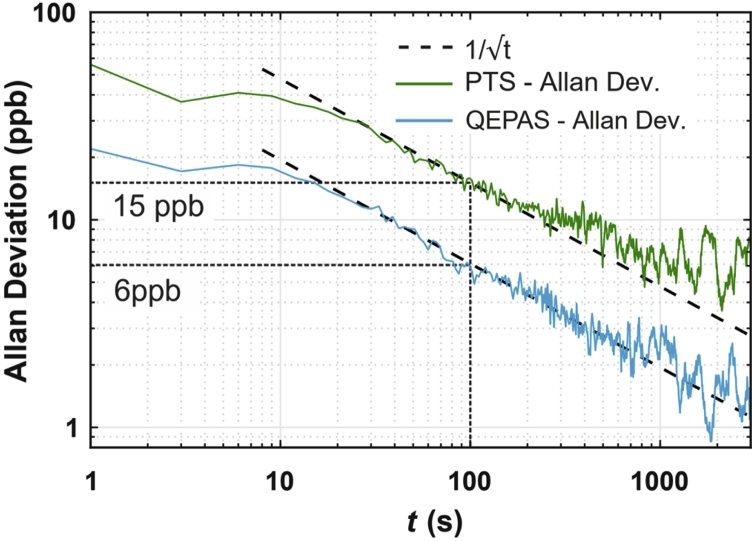
We report on a comparison between two optical detection techniques, one based on a Quartz-Enhanced Photoacoustic Spectroscopy (QEPAS) detection module, where a quartz tuning fork is acoustically coupled with a pair of millimeter-sized resonator tubes; and the other one based on a Photothermal Spectroscopy (PTS) module where a Fabry-Perot interferometer acts as transducer to probe refractive index variations. When resonant optical absorption of modulated light occurs in a gas sample, QEPAS directly detects acoustic waves while PTS probes refractive index variations caused by local heating. Compact QEPAS and PTS detection modules were realized and integrated in a gas sensor system for detection of carbon monoxide (CO), targeting the fundamental band at 4.6 μm by using a distributed-feedback quantum cascade laser. Performance was compared and ultimate detection limits up to ∼ 6 part-per-billion (ppb) and ∼15 ppb were reached for QEPAS and the PTS module, respectively, using 100 s integration time and 40 mW of laser power.

Keywords: Carbon monoxide; Fabry-Perot interferometer; Gas sensing; Laser spectroscopy; Quartz tuning fork.


Conflict of interest statement

No conflict of interest

Figures

Fig. 1
Fig. 1
Gas density perturbation for one-dimensional hydrodynamic relaxation of a sample excited from a Gaussian intensity distribution single-pulse obtained by using Eq. 1. The density decrease at z=0 corresponds to the diffusive thermal mode, while the ‘wings’ represent the propagating acoustic mode. For the simulation, the following parameters have been used: beam waist, w=10 μm; acoustic attenuation constant, Γ=1.210-5m2s-1; thermal diffusivity, DT=2.210-5m2s-1; speed of sound, c=346ms-1. (b) Density perturbation at four different times (5, 20, 100 and 250 ns).
Fig. 2
Fig. 2
Schematic of the gas sensor system for CO detection. DAQ: data acquisition card; MFC: mass flow controller; PCS: pressure control system; PM: power meter; TEC: thermoelectric cooler. The sensor system can easily accommodate QEPAS or PTS detection module.
Fig. 3
Fig. 3
(a) Sketch of the QEPAS spectrophone inside of the gas cell. (b) Resonance profile of QTF-S15 at ambient pressure, as bare (circles) and with mR-tubes (squares). Lorentzian fit of bare S15 (red solid line) and spectrophone (blue solid line) have been performed to retrieve the resonance frequency and the Q-factor.
Fig. 4
Fig. 4
(a) Sectioned view of the gas cell with the optical transducer. Top lid and windows not shown for clarity. (b) Enlarged view of the transducer head containing the interferometer: the probe beam (green) overlaps with the excitation beam (red) between the interferometer mirrors.
Fig. 5
Fig. 5
(a) PTS signal demodulated at the 2nd harmonic as a function of the excitation source’s modulation frequency; (b) Noise level measured in 200 sccm gas flow (black) and in static conditions without excitation laser (red); (c) Signal-to-noise ratio calculated by ratio of the black curves in (a) and (b).
Fig. 6
Fig. 6
(a) 2f-QEPAS signal for 100 ppm, 65 ppm, 40 ppm, 20 ppm and 5 ppm CO concentrations in N2 when the sensor operates in spectral scan acquisition mode. (b) QEPAS peak signals plotted as a function of the CO concentration (datapoints) together with the best linear fit (solid line).
Fig. 7
Fig. 7
(a) 2f-PTS signal as a function of time in the spectral scan acquisition mode for different CO concentrations in N2. (b) PTS peak signals at different CO concentrations (datapoints) and the related best linear fit (solid line).
Fig. 8
Fig. 8
Allan deviations (in ppb) for QEPAS and PTS sensors, both calculated starting from a 3 -h noise acquisition where the laser was turned ON and tuned to the absorption peak with pure N2 within the gas cell. Dashed line represents the 1/t trend. Dotted black line represents MDL at t= 100 s.

Similar articles

Cited by

References

    1. Mattiuzzi C., Lippi G. Worldwide epidemiology of carbon monoxide poisoning. Hum. Exp. Toxicol. 2020;39:387–392. doi: 10.1177/0960327119891214. - DOI - PubMed
    1. Lambrini K., Christos I., Petros O., Alexandros M. Dangerous gases and poisoning: a literature review. J. Healthc. Commun. 2018;03 doi: 10.4172/2472-1654.100136. - DOI
    1. Townsend C.L. Effects on health of prolonged exposure to low concentrations of carbon monoxide. Occup. Environ. Med. 2002;59:708–711. doi: 10.1136/oem.59.10.708. - DOI - PMC - PubMed
    1. Raub J. World Health Organization; Geneva: 1999. International Programme on Chemical Safety, eds., Carbon Monoxide, 2. Ed.
    1. Herriott D., Kogelnik H., Kompfner R. Off-axis paths in spherical mirror interferometers. Appl. Opt. 1964;3:523. doi: 10.1364/AO.3.000523. - DOI

LinkOut - more resources