Comparison of Intraoperative Ultrasound B-Mode and Strain Elastography for the Differentiation of Glioblastomas From Solitary Brain Metastases. An Automated Deep Learning Approach for Image Analysis
- PMID: 33604286
- PMCID: PMC7884775
- DOI: 10.3389/fonc.2020.590756
Comparison of Intraoperative Ultrasound B-Mode and Strain Elastography for the Differentiation of Glioblastomas From Solitary Brain Metastases. An Automated Deep Learning Approach for Image Analysis
Abstract
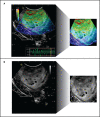
Background: The differential diagnosis of glioblastomas (GBM) from solitary brain metastases (SBM) is essential because the surgical strategy varies according to the histopathological diagnosis. Intraoperative ultrasound elastography (IOUS-E) is a relatively novel technique implemented in the surgical management of brain tumors that provides additional information about the elasticity of tissues. This study compares the discriminative capacity of intraoperative ultrasound B-mode and strain elastography to differentiate GBM from SBM.
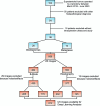
Methods: We performed a retrospective analysis of patients who underwent craniotomy between March 2018 to June 2020 with glioblastoma (GBM) and solitary brain metastases (SBM) diagnoses. Cases with an intraoperative ultrasound study were included. Images were acquired before dural opening, first in B-mode, and then using the strain elastography module. After image pre-processing, an analysis based on deep learning was conducted using the open-source software Orange. We have trained an existing neural network to classify tumors into GBM and SBM via the transfer learning method using Inception V3. Then, logistic regression (LR) with LASSO (least absolute shrinkage and selection operator) regularization, support vector machine (SVM), random forest (RF), neural network (NN), and k-nearest neighbor (kNN) were used as classification algorithms. After the models' training, ten-fold stratified cross-validation was performed. The models were evaluated using the area under the curve (AUC), classification accuracy, and precision.
Results: A total of 36 patients were included in the analysis, 26 GBM and 10 SBM. Models were built using a total of 812 ultrasound images, 435 of B-mode, 265 (60.92%) corresponded to GBM and 170 (39.8%) to metastases. In addition, 377 elastograms, 232 (61.54%) GBM and 145 (38.46%) metastases were analyzed. For B-mode, AUC and accuracy values of the classification algorithms ranged from 0.790 to 0.943 and from 72 to 89%, respectively. For elastography, AUC and accuracy values ranged from 0.847 to 0.985 and from 79% to 95%, respectively.
Conclusion: Automated processing of ultrasound images through deep learning can generate high-precision classification algorithms that differentiate glioblastomas from metastases using intraoperative ultrasound. The best performance regarding AUC was achieved by the elastography-based model supporting the additional diagnostic value that this technique provides.
Keywords: brain tumor; convolutional neural network; deep learning; elastography; intraoperative ultrasound.
Copyright © 2021 Cepeda, García-García, Arrese, Fernández-Pérez, Velasco-Casares, Fajardo-Puentes, Zamora and Sarabia.
Conflict of interest statement
The authors declare that the research was conducted in the absence of any commercial or financial relationships that could be construed as a potential conflict of interest.
Figures


References
LinkOut - more resources
Full Text Sources
Other Literature Sources
Medical

