. 2021 Feb 2:9:625231.
doi: 10.3389/fcell.2021.625231. eCollection 2021.

STIM2 Mediates Excessive Store-Operated Calcium Entry in Patient-Specific iPSC-Derived Neurons Modeling a Juvenile Form of Huntington's Disease

Affiliations

STIM2 Mediates Excessive Store-Operated Calcium Entry in Patient-Specific iPSC-Derived Neurons Modeling a Juvenile Form of Huntington's Disease

Vladimir A Vigont et al. Front Cell Dev Biol. .

Abstract

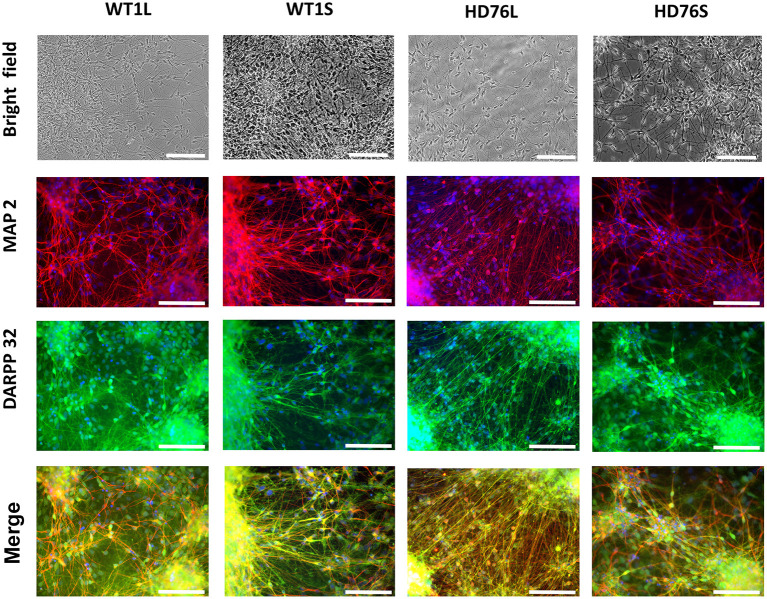
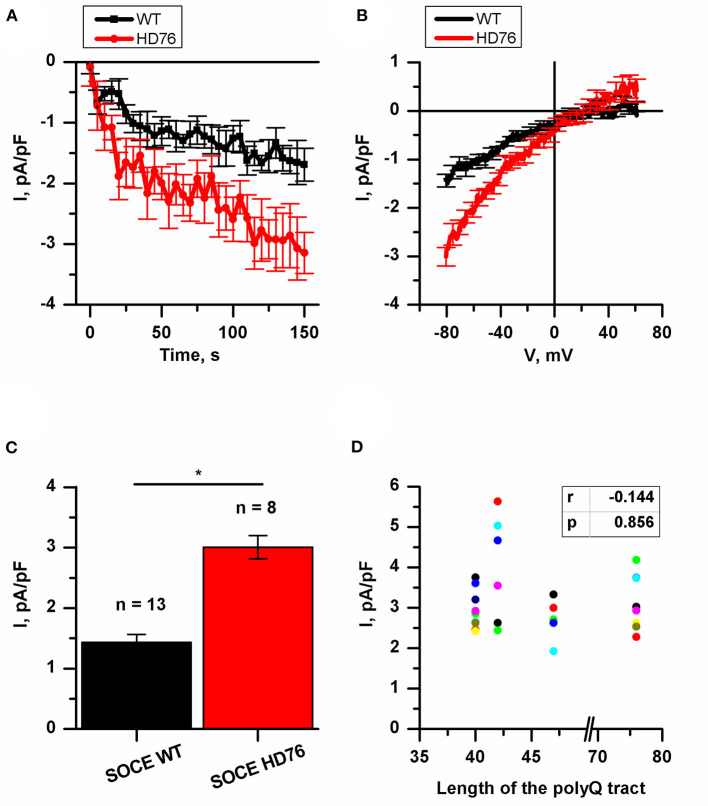
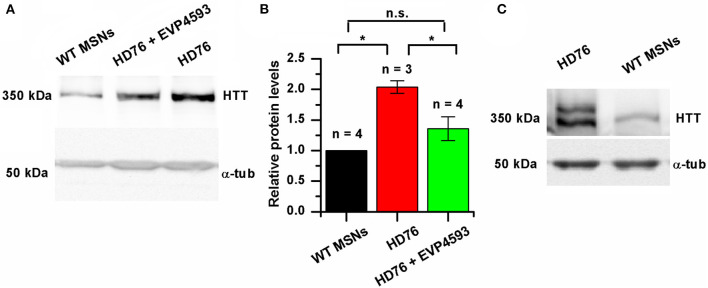
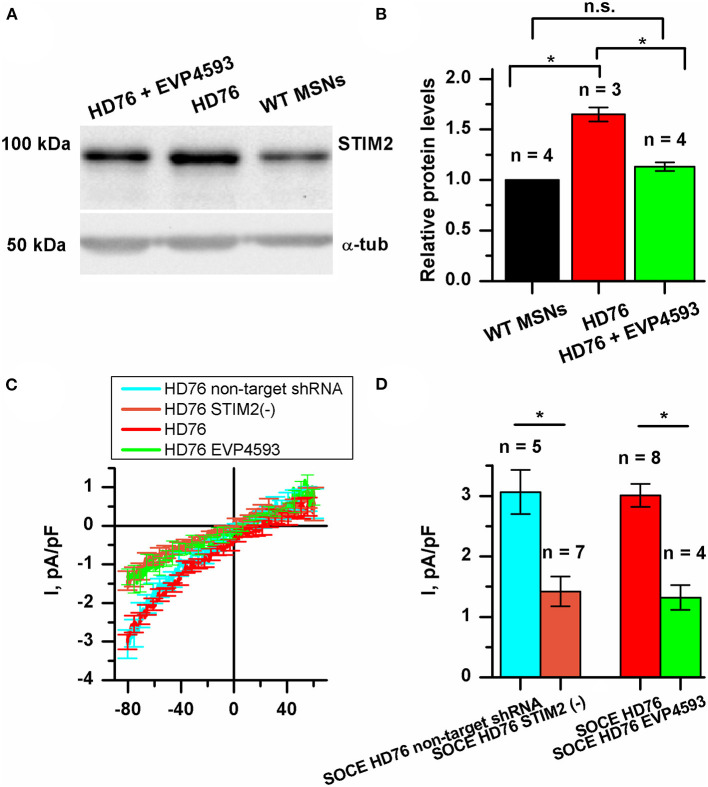
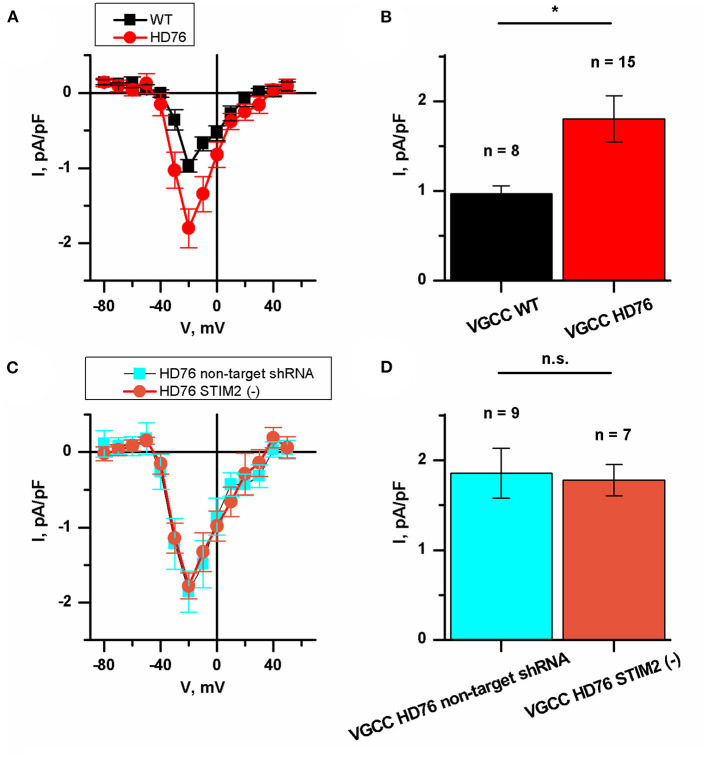
Huntington's disease (HD) is a severe autosomal-dominant neurodegenerative disorder caused by a mutation within a gene, encoding huntingtin protein. Here we have used the induced pluripotent stem cell technology to produce patient-specific terminally differentiated GABA-ergic medium spiny neurons modeling a juvenile form of HD (HD76). We have shown that calcium signaling is dramatically disturbed in HD76 neurons, specifically demonstrating higher levels of store-operated and voltage-gated calcium uptakes. However, comparing the HD76 neurons with the previously described low-repeat HD models, we have demonstrated that the severity of calcium signaling alterations does not depend on the length of the polyglutamine tract of the mutant huntingtin. Here we have also observed greater expression of huntingtin and an activator of store-operated calcium channels STIM2 in HD76 neurons. Since shRNA-mediated suppression of STIM2 decreased store-operated calcium uptake, we have speculated that high expression of STIM2 underlies the excessive entry through store-operated calcium channels in HD pathology. Moreover, a previously described potential anti-HD drug EVP4593 has been found to attenuate high levels of both huntingtin and STIM2 that may contribute to its neuroprotective effect. Our results are fully supportive in favor of the crucial role of calcium signaling deregulation in the HD pathogenesis and indicate that the cornerstone of excessive calcium uptake in HD-specific neurons is a calcium sensor and store-operated calcium channels activator STIM2, which should become a molecular target for medical treatment and novel neuroprotective drug development.

Keywords: EVP4593; Huntington's disease; STIM2; calcium; induced pluripotent stem cells; neurodegeneration; store-operated calcium channels.


Conflict of interest statement

The authors declare that the research was conducted in the absence of any commercial or financial relationships that could be construed as a potential conflict of interest.

Figures

Figure 1
Figure 1
HD76 and WT iPSCs-derived neurons analysis. Representative images of neurons in the bright field (photo of the cells in culture) and immunostained for MAP2 (red), DARPP-32 (green) and merge of MAP2 and DARPP32 counterstained with DAPI (blue). HD76L and HD76S – juvenile HD-specific neuronal cell lines differentiated from iPSCs obtained by lentivirus and Sendai virus approaches, respectively; WT1L and WT1S – wild type neuronal cell lines differentiated from iPSCs obtained by Lentivirus and Sendai virus approaches, respectively. The cell lines are also represented in Supplementary Table 1. Scale bar 100 μm.
Figure 2
Figure 2
Disturbance of SOCE in HD76 neurons. (A) Normalized SOC currents evoked by application of thapsigargin (1 μM) and plotted as a function of time in HD76 (red circles), and WT (black squares) GABA MSNs. SOC currents were measured every 5 s at a test potential of −80 mV. Each trace shows mean ± SEM. (B) Average Current-Voltage relationships (I–V curves) of normalized currents evoked by passive depletion of calcium stores with thapsigargin (1 μM) in HD76 (red line), and WT (black line) GABA MSNs. The I–V curves were plotted after the full development of the SOC currents. The number of experiments is depicted at the panel (C). (C) Average amplitude or the normalized SOC currents determined at a test potential of −80 mV for HD76 (red), and WT (black) GABA MSNs. The amplitudes are plotted as the mean ± SEM (n = number of single cell experiments). The asterisks indicate that differences in amplitudes are statistically significant (p < 0.05) (D) Correlation between the amplitude of SOC currents and the length of the polyglutamine tract of mutant huntingtin. The correlation coefficient (r) and the p-value are indicated above the plot. The cell lines are represented in Supplementary Table 1.
Figure 3
Figure 3
EVP4593 reduces the excessively increased level of mutant huntingtin. (A) Representative Western blot showing the expression level of total HTT in HD76, HD76 incubated with 300 nM EVP4593 for 24 h and WT GABA MSNs. Band intensities were quantified and values normalized to the α-tubulin housekeeping protein. (B) Relative HTT levels in WT (black), HD76 (red) and HD76 incubated with 300 nM EVP4593 for 24 h (green). Biological replicates are indicated above the bars. (C) Representative Western blot showing the expression level of normal and mutant HTT in HD76 and WT GABA MSNs. The asterisk indicates that differences in protein levels are statistically significant (p < 0.05).
Figure 4
Figure 4
STIM2 as the cornerstone of significantly increased SOCE in HD76 GABA MSNs. (A) Representative Western blot showing the expression level of STIM2 in HD76, HD76 incubated with 300 nM EVP4593 for 24 h and WT GABA MSNs. Band intensities were quantified and values normalized to the α-tubulin housekeeping protein. (B) Relative STIM2 levels in HD76 (red), HD76 incubated with 300 nM EVP4593 (green) and WT GABA MSNs (black). Biological replicates are mentioned above the bars. (C) Average Current-Voltage relationships (I–V curves) of normalized currents evoked by passive depletion of calcium stores with thapsigargin (1 μM) in HD76 expressing non-target shRNA (HD76 non-target shRNA, cyan line), HD76 expressing shRNA against STIM2 (HD76 STIM2(–), orange line), intact HD76 (red line) and HD76 pre-incubated with 300 nM EVP4593 for 24 h (green line). The number of experiments is depicted at the panel (D). (D) Average amplitude or the normalized SOC currents determined at a test potential of −80 mV for HD76 expressing non-target shRNA (cyan), HD76 expressing shRNA against STIM2 (orange), intact HD76 (red) and HD76 pre-incubated with 300 nM EVP4593 for 24 h (green). The amplitudes are plotted as the mean ± SEM (n = number of single cell experiments). The asterisk indicates that differences in amplitudes are statistically significant (p < 0.05).
Figure 5
Figure 5
Disturbance of VGCC in HD76 neurons. (A) Average I–V curves of normalized voltage-gated calcium currents for HD76 (red circles) and WT (black squares) GABA MSNs. The number of experiments is depicted at the panel (B). (B) Average amplitude of VGCC currents at the potential of −20 mV for HD76 (red), and WT (black) GABA MSNs. The amplitudes are plotted as the mean ± SEM (n = number of single cell experiments). The asterisk indicates that differences in amplitudes are statistically significant (p < 0.05). (C) Average I–V curves of normalized voltage-gated calcium currents in HD76 expressing non-target shRNA (HD76 non-target shRNA, cyan squares) and HD76 expressing shRNA against STIM2 (HD76 STIM2(–), orange circles). The number of experiments is depicted at the panel (D). (D) Average amplitude of VGCC currents at the potential of −20 mV for HD76 expressing non-target shRNA (HD76 non-target shRNA, cyan) and HD76 expressing shRNA against STIM2 (HD76 STIM2(–), orange). The amplitudes are plotted as the mean ± SEM (n = number of single cell experiments). n.s. indicates the absence of statistically significant differences (p > 0.05).

Similar articles

Cited by

References

    1. Andrew S., Theilmann J., Almqvist E., Norremolle A., Lucotte G., Anvret M., et al. . (1993). DNA analysis of distinct populations suggests multiple origins for the mutation causing Huntington disease. Clin. Genet. 43, 286–294. 10.1111/j.1399-0004.1993.tb03820.x - DOI - PubMed
    1. Aslesh T., Yokota T. (2020). Development of antisense oligonucleotide gapmers for the treatment of Huntington's disease. Methods Mol. Biol. 2176, 57–67. 10.1007/978-1-0716-0771-8_4 - DOI - PubMed
    1. Bao J., Sharp A. H., Wagster M. V., Becher M., Schilling G., Ross C. A., et al. . (1996). Expansion of polyglutamine repeat in huntingtin leads to abnormal protein interactions involving calmodulin. Proc. Natl. Acad. Sci. U. S. A. 93, 5037–5042. 10.1073/pnas.93.10.5037 - DOI - PMC - PubMed
    1. Bečanović K., Nørremølle A., Neal S. J., Kay C., Collins J. A., Arenillas D., et al. . (2015). A SNP in the HTT promoter alters NF-κB binding and is a bidirectional genetic modifier of Huntington disease. Nat. Neurosci. 18, 807–816. 10.1038/nn.4014 - DOI - PubMed
    1. Bezprozvanny I. (2009). Calcium signaling and neurodegenerative diseases. Trends Mol. Med. 15, 89–100. 10.1016/j.molmed.2009.01.001 - DOI - PMC - PubMed