. 2020 Dec 8;7(12):916-922.
doi: 10.1021/acs.estlett.0c00672. Epub 2020 Sep 30.

Aquifer-Scale Observations of Iron Redox Transformations in Arsenic-Impacted Environments to Predict Future Contamination

Affiliations

Aquifer-Scale Observations of Iron Redox Transformations in Arsenic-Impacted Environments to Predict Future Contamination

Athena A Nghiem et al. Environ Sci Technol Lett. .

Abstract

Iron oxides control the mobility of a host of contaminants in aquifer systems, and the microbial reduction of iron oxides in the subsurface is linked to high levels of arsenic in groundwater that affects greater than 150 million people globally. Paired observations of groundwater and solid-phase aquifer composition are critical to understand spatial and temporal trends in contamination and effectively manage changing water resources, yet field-representative mineralogical data are sparse across redox gradients relevant to arsenic contamination. We characterize iron mineralogy using X-ray absorption spectroscopy across a natural gradient of groundwater arsenic contamination in Vietnam. Hierarchical cluster analysis classifies sediments into meaningful groups delineating weathering and redox changes, diagnostic of depositional history, in this first direct characterization of redox transformations in the field. Notably, these groupings reveal a signature of iron minerals undergoing active reduction before the onset of arsenic contamination in groundwater. Pleistocene sediments undergoing postdepositional reduction may be more extensive than previously recognized due to previous misclassification. By upscaling to similar environments in South and Southeast Asia via multinomial logistic regression modeling, we show that active iron reduction, and therefore susceptibility to future arsenic contamination, is more widely distributed in presumably pristine aquifers than anticipated.


Figures

Figure 1.
Figure 1.
(A) Dendrogram shows clusters identified by hierarchical cluster analysis match with and expand on field classification of sediment redox state and depositional history. The clusters that naturally arise from the branching of the dendrogram are labeled by highlighted color (cluster 1 in green, cluster 2 in red, cluster 3 in blue, cluster 4 in black); the cluster number is also denoted on each branch of the dendrogram. Each sample name on the dendrogram includes the well name and sediment depth and is colored by field-identified classifications, where an orange sample name represents orange Pleistocene sediment, a gray sample name represents orange Pleistocene sediment that is turning gray (known as part of the “orange to gray” transition zone), and a black sample name represents gray Holocene sediment per field classification. (B) Heat map shows higher fraction of oxidized Fe(III) minerals in more oxidized clusters and higher fraction of reduced Fe(II) minerals in clusters undergoing reduction. From top to bottom on the y-axis, Fe minerals are listed from more oxidized Fe(III) minerals (ferrihydrite, goethite, hematite) to mixed Fe(III)/Fe(II) minerals (green rust, magnetite, mixed Fe(III)/Fe(II) silicates) to more reduced Fe(II) minerals (siderite, a secondary Fe(II) carbonate; biotite, a primary Fe(II) silicate; pyrite; mackinawite). From left to right, the clusters are listed from more oxidized (orange Pleistocene) to more reduced (gray Holocene). The gradient from yellow (lower fraction) to purple (higher fraction) indicates the mean fraction of Fe mineral of each cluster from linear combination fitting.
Figure 2.
Figure 2.
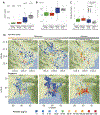
Aqueous (A) arsenic, (B) iron, and (C) manganese from the field site are used to train a supervised classification model to classify sediment redox and depositional age by clusters (D). Boxplot of measured and interpolated aqueous (A) arsenic, (B) iron, and (C) manganese concentrations as grouped by sediment clusters in Van Phuc. (D) Map of classified sediment distribution results in Red River Delta, Vietnam, and Bangladesh by cluster as colored by aqueous arsenic concentrations. Note that clusters 1 and 2 are grouped together as orange sediments in the classification model, and clusters 1, 2, and 3 represent Pleistocene sediments. Base map is from Google Maps imagery.

References

    1. Fendorf S; Michael HA; van Geen A Spatial and Temporal Variations of Groundwater Arsenic in South and Southeast Asia. Science (Washington, DC, U. S.) 2010, 328 (5982), 1123–1127. - PubMed
    1. Podgorski J; Berg M Global Threat of Arsenic in Groundwater. Science (Washington, DC, U. S.) 2020, 368 (6493), 845–850. - PubMed
    1. Wasserman GA; Liu X; Parvez F; Ahsan H; Factor-Litvak P; van Geen A; Slavkovich V; Lolacono NJ; Cheng Z; Hussain I; Momotaj H; Graziano JH Water Arsenic Exposure and Children’s Intellectual Function in Araihazar, Bangladesh. Environ. Health Perspect 2004, 112 (13), 1329–1333. - PMC - PubMed
    1. Quansah R; Armah FA; Essumang DK; Luginaah I; Clarke E; Marfoh K; Cobbina SJ; Nketiah-Amponsah E; Namujju PB; Obiri S; Dzodzomenyo M Association of Arsenic with Adverse Pregnancy Outcomes/Infant Mortality. Environ. Health Perspect 2015, 123 (5), 412–421. - PMC - PubMed
    1. Michael HA; Voss CI Evaluation of the Sustainability of Deep Groundwater as an Arsenic-Safe Resource in the Bengal Basin. Proc. Natl. Acad. Sci. U. S. A 2008, 105 (25), 8531–8536. - PMC - PubMed

LinkOut - more resources