

Automatic segmentation and tracking of biological prosthetic heart valves
- PMID: 33604410
- PMCID: PMC7880245
- DOI: 10.1117/1.JMI.8.1.015501
Automatic segmentation and tracking of biological prosthetic heart valves
Abstract
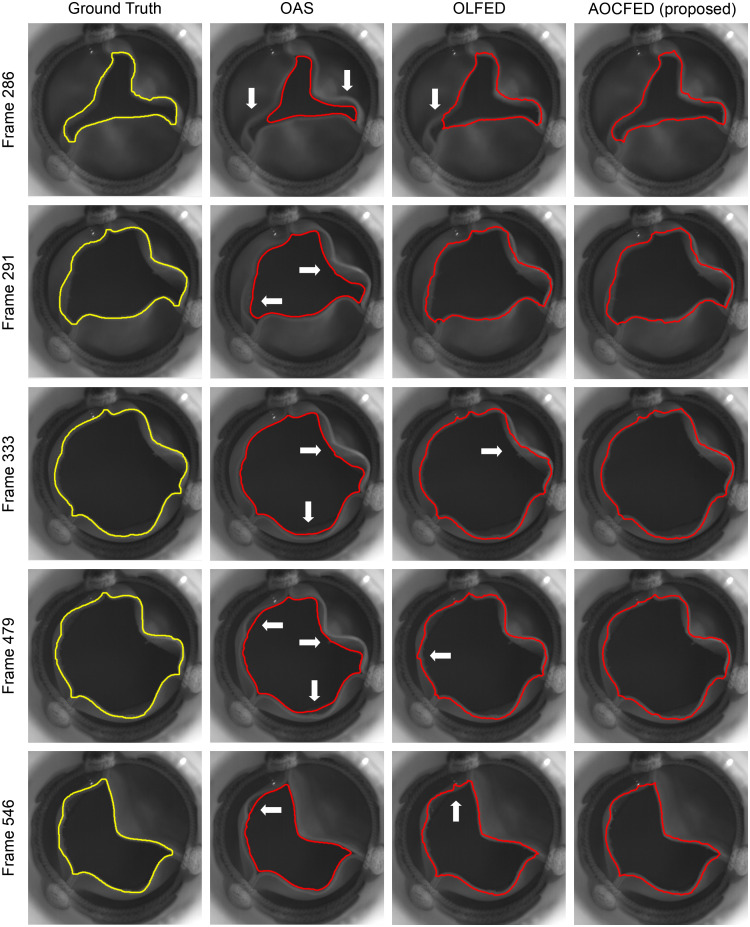
Purpose: Prosthetic heart valve designs must be rigorously tested using cardiovascular equipment. The valve orifice area over time constitutes a key quality metric which is typically assessed manually, thus a tedious and error-prone task. From a computer vision viewpoint, a major unsolved issue lies in the orifice being partly occluded by the leaflets' inner side or inaccurately depicted due to its transparency. Here, we address this issue, which allows us to focus on the accurate and automatic computation of valve orifice areas. Approach: We propose a segmentation approach based on the detection of the leaflets' free edges. Using video frames recorded with a high-speed digital camera during in vitro simulations, an initial estimation of the orifice area is first obtained via active contouring and thresholding and then refined to capture the leaflet free edges via a curve transformation mechanism. Results: Experiments on video data from pulsatile flow testing demonstrate the effectiveness of our approach: a root-mean-square error (RMSE) on the temporal extracted orifice areas between 0.8% and 1.2%, an average Jaccard similarity coefficient between 0.933 and 0.956, and an average Hausdorff distance between 7.2 and 11.9 pixels. Conclusions: Our approach significantly outperformed a state-of-the-art algorithm in terms of evaluation metrics related to valve design (RMSE) and computer vision (accuracy of the orifice shape). It can also cope with lower quality videos and is better at processing frames showing an almost closed valve, a crucial quality for assessing valve design malfunctions related to their improper closing.
Keywords: active contours; leaflet edge detection; motion pattern; orifice area segmentation; prosthetic heart valves; video analysis.
© 2021 Society of Photo-Optical Instrumentation Engineers (SPIE).
Figures


Similar articles
-
Doppler assessment of prosthetic valve orifice area. An in vitro study.Circulation. 1992 Jun;85(6):2275-83. doi: 10.1161/01.cir.85.6.2275. Circulation. 1992. PMID: 1591841
-
Hydrodynamic function of the second-generation mitroflow pericardial bioprosthesis.Ann Thorac Surg. 2002 Jul;74(1):63-8. doi: 10.1016/s0003-4975(02)03617-2. Ann Thorac Surg. 2002. PMID: 12118805
-
Evaluation technique for bileaflet mechanical valves.J Heart Valve Dis. 2002 Mar;11(2):275-82. J Heart Valve Dis. 2002. PMID: 12000172
-
Flow in prosthetic heart valves: state-of-the-art and future directions.Ann Biomed Eng. 2005 Dec;33(12):1689-94. doi: 10.1007/s10439-005-8759-z. Ann Biomed Eng. 2005. PMID: 16389514 Review.
-
Ineffective Orifice Area: Practical Limitations of Accurate EOA Assessment for Low-Gradient Heart Valve Prostheses.Cardiovasc Eng Technol. 2021 Dec;12(6):598-605. doi: 10.1007/s13239-021-00548-5. Epub 2021 May 24. Cardiovasc Eng Technol. 2021. PMID: 34031861 Review.
References
-
- WHO, “Cardiovascular diseases (CVDs),” http://www.who.int/cardiovascular_diseases/en/ (accessed 27 November 2020).
-
- Alizadeh M., Cote M., Branzan Albu A., “Leaflet free edge detection for the automatic analysis of prosthetic heart valve opening and closing motion patterns from high speed video recordings,” in Scand. Conf. Image Anal., Springer, pp. 15–27 (2017).10.1007/978-3-319-59129-2_2 - DOI
LinkOut - more resources
Full Text Sources
Other Literature Sources
