

PECAM-1 supports leukocyte diapedesis by tension-dependent dephosphorylation of VE-cadherin
- PMID: 33604918
- PMCID: PMC8090850
- DOI: 10.15252/embj.2020106113
PECAM-1 supports leukocyte diapedesis by tension-dependent dephosphorylation of VE-cadherin
Abstract
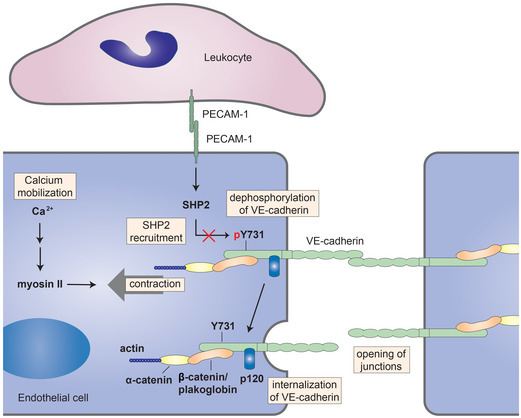
Leukocyte extravasation is an essential step during the immune response and requires the destabilization of endothelial junctions. We have shown previously that this process depends in vivo on the dephosphorylation of VE-cadherin-Y731. Here, we reveal the underlying mechanism. Leukocyte-induced stimulation of PECAM-1 triggers dissociation of the phosphatase SHP2 which then directly targets VE-cadherin-Y731. The binding site of PECAM-1 for SHP2 is needed for VE-cadherin dephosphorylation and subsequent endocytosis. Importantly, the contribution of PECAM-1 to leukocyte diapedesis in vitro and in vivo was strictly dependent on the presence of Y731 of VE-cadherin. In addition to SHP2, dephosphorylation of Y731 required Ca2+ -signaling, non-muscle myosin II activation, and endothelial cell tension. Since we found that β-catenin/plakoglobin mask VE-cadherin-Y731 and leukocyte docking to endothelial cells exert force on the VE-cadherin-catenin complex, we propose that leukocytes destabilize junctions by PECAM-1-SHP2-triggered dephosphorylation of VE-cadherin-Y731 which becomes accessible by actomyosin-mediated mechanical force exerted on the VE-cadherin-catenin complex.
Keywords: VE-cadherin; cell adhesion; endothelial junctions; leukocyte extravasation; mechanical tension.
© 2021 The Authors. Published under the terms of the CC BY NC ND 4.0 license.
Conflict of interest statement
The authors declare that they have no conflict of interest.
Figures
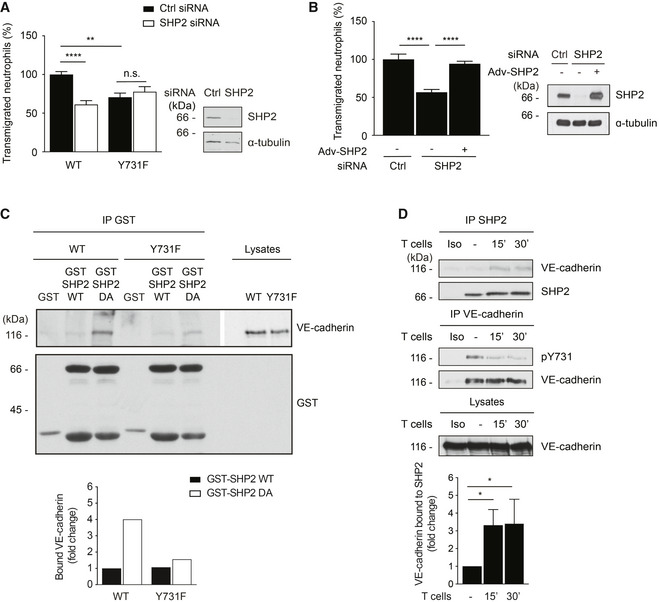
Transmigration of mouse neutrophils toward the chemokine CXCL‐1 through TNF‐α‐stimulated VE‐cadherin WT (WT) or VE‐cadherin Y731F (Y731F) primary endothelial cells, each transfected with control or SHP2‐specific siRNA. The transmigration rate is presented relative to that of WT cells transfected with control siRNA, set as 100%. On the right, Western blot analysis of lysates from cells used in transmigration assays for the expression of SHP2 and α‐tubulin.
Transmigration of human neutrophils toward the chemokine IL‐8 through TNF‐α‐stimulated human endothelial cells (HUVEC), transfected with control or SHP2‐specific siRNA, and were either not transduced (−) or transduced (+) with adenoviruses expressing human SHP2 (Adv‐SHP2). The transmigration rate is presented relative to that of cells transfected with control siRNA, set as 100%. On the right, Western blot analysis of lysates from cells used in transmigration assays for the expression of SHP2 and α‐tubulin.
Lysates of WT or Y731F primary endothelial cells were submitted to pulldowns with GST, GST‐SHP2‐WT, or GST‐SHP2‐DA. Pulldowns and total cell lysates were analyzed by Western blotting for VE‐cadherin and GST. Graph below represents quantification of two independent experiments, presented as fold change of bound VE‐cadherin.
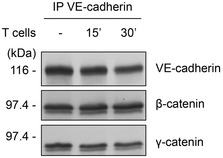
TNF‐α‐activated bEnd.5 cells were incubated with mouse T cells for 0–30 min. SHP2 (above) or VE‐cadherin (below) were immunoprecipitated (IP) from cell lysates and precipitates as well as total cell lysates were analyzed by immunoblotting for indicated antigens. Molecular weight markers are indicated in kDa. Graph below represents quantification of five independent experiments, presented as fold change of bound VE‐cadherin.
- A–E
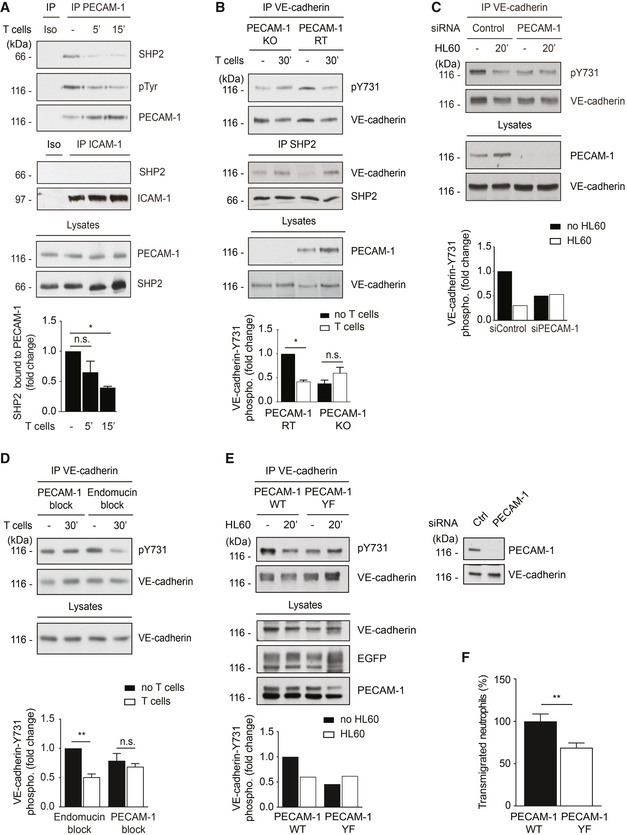
Different endothelial cells were stimulated with TNF‐α for 17 h prior to adding leukocytes for indicated time points followed by immunoprecipitations (antigens indicated above) and immunoblots (antigens indicated on the right) of precipitates and endothelial cell lysates (Iso = isotype control). (A) bEnd.5 cells were incubated with antigen‐stimulated mouse T cells for 0–15 min. (B) luEnd cells devoid of PECAM‐1 (KO) or re‐transfected with PECAM‐1 (RT) were incubated with T cells for 30 min. (C) HUVEC transfected with control or PECAM‐1‐specific siRNA were incubated with differentiated HL60 cells for 20 min. (D) bEnd.5 cells were pre‐treated with anti‐PECAM‐1 (Mec13.3) or anti‐endomucin antibodies for 30 min prior to incubation with T cells for 30 min. (E) HUVEC, siRNA depleted for endogenous PECAM‐1, were transduced with wild‐type PECAM‐1 (PECAM‐1 WT) or Y663,686F PECAM‐1 double mutant (PECAM‐1 YF) and incubated with HL60‐derived neutrophils for 20 min. On the right, immunoblot analysis of lysates from siRNA‐treated cells before PECAM‐1 re‐expression.
- F
Transmigration of human neutrophils toward IL‐8 through TNF‐α‐stimulated HUVEC expressing PECAM‐1 WT or PECAM‐1‐Y663,686F. The transmigration rate is presented relative to that of PECAM‐1 WT expressing cells, set as 100%.
- A, B
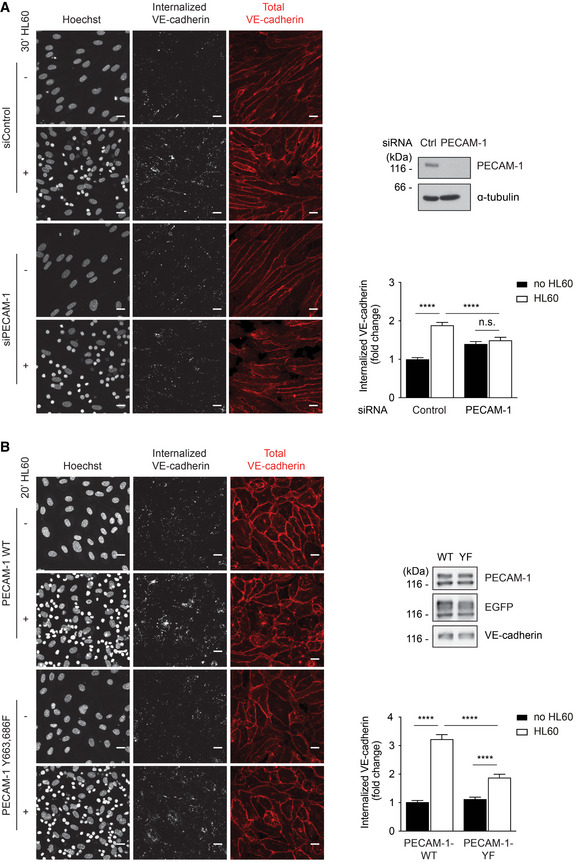
Endocytosis of VE‐cadherin in 17 h TNF‐α‐treated HUVEC was induced by adding HL60‐derived neutrophils for 20–30 min at 37°C and monitored by the internalization of pre‐incubated mAb BV6, which was visualized in fixed cells with a secondary fluorescent antibody (white). Total VE‐cadherin was stained with another mAb (red), nuclei stained with Hoechst (white). (A) HUVEC had been transfected prior to the experiment with control or PECAM‐1‐specific siRNA. Cell lysates were analyzed for expression levels of PECAM‐1 and tubulin (below). (B) Similar as A, except that PECAM‐1 siRNA‐treated HUVEC were transduced with WT PECAM‐1‐EGFP or PECAM‐1‐Y663,686F‐EGFP. Expression levels of transduced PECAM‐1 forms and of EGFP and VE‐cadherin are shown in immunoblots (on the right). Relative VE‐cadherin internalization efficiency is given on the right.
- A
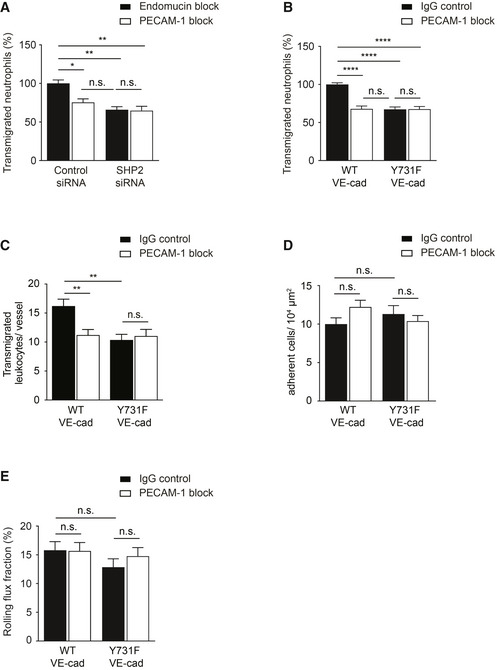
Transmigration of mouse neutrophils toward CXCL‐1 through TNF‐α‐stimulated bEnd.5 cells transfected with control or SHP2‐specific siRNA and pre‐treated with anti‐endomucin (7C7.1) or anti‐PECAM‐1 (Mec13.3) antibodies for 30 min at 37°C before addition of neutrophils. The transmigration rate is presented relative to that of control cells, set as 100%.
- B
Transmigration of mouse neutrophils toward CXCL‐1 through TNF‐α‐stimulated WT or Y731F primary mouse endothelial cells pre‐treated with isotype control or anti‐PECAM‐1 (2H8) antibodies for 30 min at 37°C prior to addition of neutrophils. The transmigration rate is presented relative to that of control cells, set as 100%.
- C–E
Extravasated leukocytes (C), adherent leukocytes (D), and rolling flux fraction of leukocytes (E) in cremaster tissue from WT or Y731F VE‐cadherin mice stimulated intrascrotally with IL‐1β and treated i.v. with isotype control or anti‐PECAM‐1 (2H8) antibodies for 4 h before intravital microscopy.
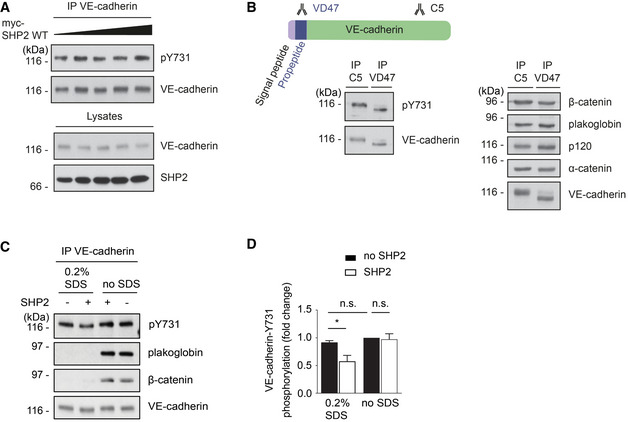
HUVEC were transduced with increasing titers of adenovirus expressing human SHP2. VE‐cadherin was immunoprecipitated from cell lysates and precipitates as well as total cell lysates were analyzed by immunoblots for indicated antigens.
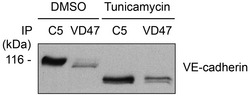
bEnd.3 cells were lysed, and VE‐cadherin or immature VE‐cadherin was immunoprecipitated, respectively, with C5 or VD47 antibodies. Precipitates were blotted against pY731‐VE‐cadherin, β‐catenin, plakoglobin, p120, α‐catenin, and VE‐cadherin.
VE‐cadherin–catenin complex was immunoprecipitated from HUVEC lysates and was either left untreated (no SDS) or treated with 0.2% SDS for 30 min at room temperature, followed by removal of SDS and addition of 2 μg recombinant human SHP2 for 30 min at 30°C. Precipitates were analyzed in immunoblots for pY731‐VE‐cadherin, plakoglobin, β‐catenin, and VE‐cadherin.
Quantification of pY731 blot signals of three independent experiments (from C), with the signal intensity for untreated VE‐cadherin set as 1. Molecular weight markers are indicated in kDa.
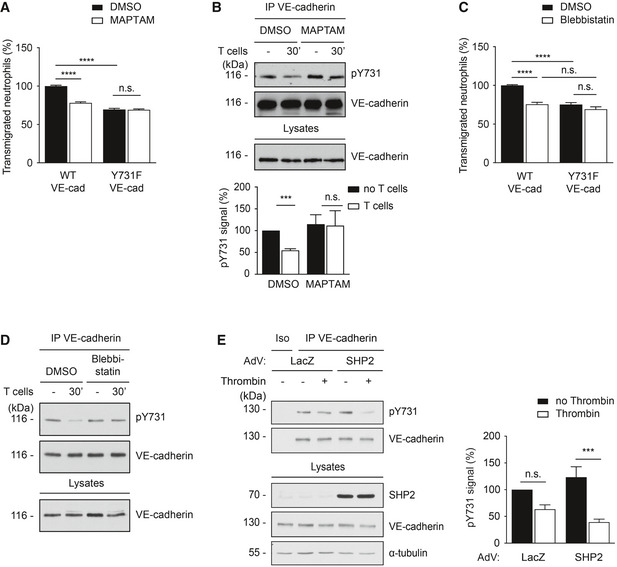
Transmigration of mouse neutrophils toward the chemokine CXCL‐1 through TNF‐α‐stimulated WT or Y731F primary endothelial cells, either pre‐treated with vehicle control (DMSO) or Ca2+ chelator (MAPTAM) for 30 min at 37°C prior to addition of neutrophils. The transmigration rate is presented relative to DMSO‐treated endothelial cells expressing WT VE‐cadherin.
TNF‐α‐activated bEnd.5 cells were treated with DMSO or MAPTAM, prior to incubation with antigen‐stimulated mouse T cells for 30 min. VE‐cadherin was immunoprecipitated from cell lysates and precipitates as well as total cell lysates were analyzed by immunoblots for indicated antigens. Quantification of pY731 blot signals of five independent experiments is shown below, with the signal intensity for the control sample (no T cells, vehicle control) set as 100%.
Transmigration assays as in (A), except for replacing MAPTAM treatment with Blebbistatin.
Similar as for (B), except for replacing MAPTAM treatment with Blebbistatin.
HUVEC transduced with lacZ or with SHP2 were either untreated (−) or treated (+) with thrombin for 30 min followed by immunoblotting either VE‐cadherin immunoprecipitates or cell lysates for the indicated antigens on the right. A quantification of four independent experiments is shown on the right. Molecular weight markers are indicated in kDa.
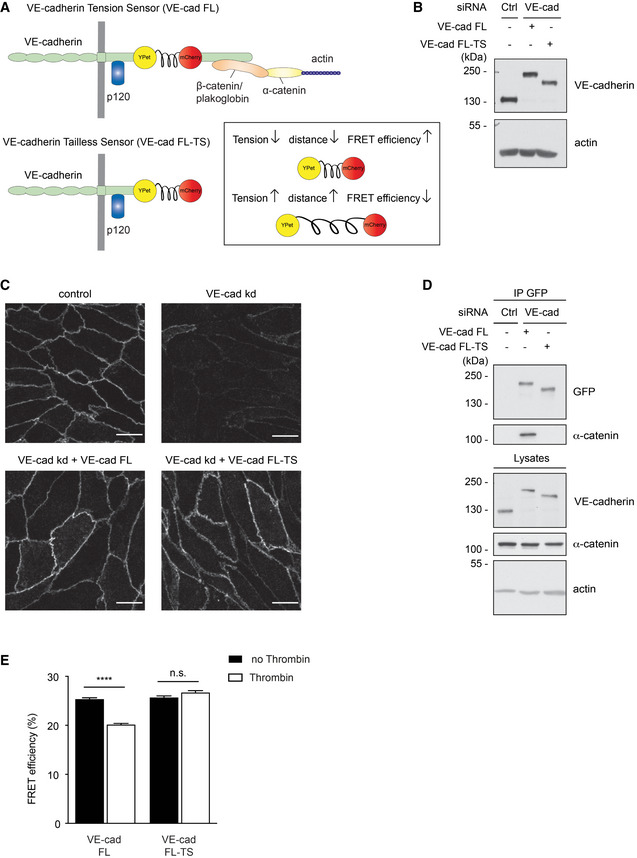
Schematic representation of VE‐cadherin tension sensor (VE‐cad FL) and VE‐cadherin tailless sensor (VE‐cad FL‐TS). VE‐cadherin tension sensor has a ferredoxin‐like (FL) linker‐based FRET module inserted within VE‐cadherin between the p120 and the β‐catenin‐binding site, whereas VE‐cadherin tailless sensor lacks the catenin‐binding region of VE‐cadherin. The FRET module (depicted in box) consists of two fluorophores, YPet and mCherry separated by an elastic domain. When the module is under tension, FRET from YPet to mCherry decreases.
HUVEC were transfected with control or VE‐cadherin‐specific siRNA and transduced with VE‐cad FL or VE‐cad FL‐TS. Cell lysates were immunoblotted for VE‐cadherin and actin.
Immunofluorescence staining for VE‐cadherin of HUVEC transfected with control or VE‐cadherin‐specific siRNA (VE‐cad kd) and transduced with VE‐cad FL or VE‐cad FL‐TS.
HUVEC were either transfected with control or VE‐cadherin targeting siRNA and transduced with VE‐cad FL or VE‐cad FL‐TS. The tension sensor was immunoprecipitated from cell lysates using an anti‐GFP antibody. Precipitates as well as total cell lysates were analyzed by immunoblotting for indicated antigens. Molecular weight markers are indicated in kDa.
Quantification of FRET efficiency (percentage) in junctions of HUVEC expressing VE‐cad FL or VE‐cad FL‐TS, after thrombin stimulation (1 U/ml) or under control conditions.
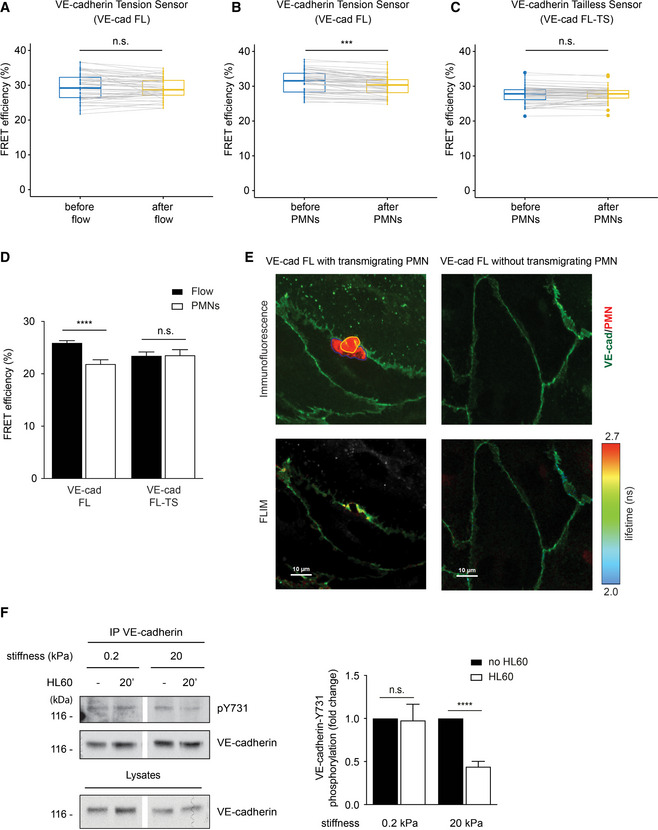
- A–C
Quantification of FRET efficiency (percentage) in junctions of HUVEC expressing VE‐cad FL (A, B) or VE‐cad FL‐TS (C). HUVEC were stimulated 4 h with TNF‐α prior to adding IL‐8 for 4 min, followed by flow with buffer alone (A) or together with PMNs (B, C). The connected data points represent FRET efficiency of same junctions compared before and after addition of flow/PMNs.
- D
Quantification of FRET efficiency (percentage) in junctions of HUVEC expressing VE‐cad FL or VE‐cad FL‐TS. Cells were either exposed to flow and PMNs or to flow alone, fixed using 4% PFA, and washed with PBS. FLIM measurements were performed at sites of transmigration (PMNs) or at junctions without PMNs (Flow).
- E
Representative images of HUVEC expressing VE‐cad FL at a site of PMN transmigration (left micrographs) or without PMN (right micrographs). Maximum intensity projection of a Z‐stack of YPet fluorescence (VE‐cadherin in green) and CellTracker DeepRed (PMN in red) is shown for the upper micrographs. The part of the PMN above the HUVEC monolayer is encircled in yellow and the part underneath in blue. The amplitude averaged lifetime of YPet per pixel (FLIM measurement) of the same cells is shown in the bottom micrographs.
- F
HUVEC were grown on collagen‐coated polyacrylamide gels of varying physiologic stiffness of 0.2 and 20 kPa and stimulated with TNF‐α for 17 h prior to adding HL60‐derived neutrophils for 20 min. VE‐cadherin was immunoprecipitated and precipitates as well as total cell lysates were analyzed by Western blotting for indicated antigens. Relative quantifications of pY731 blot signals adjusted to the amount of precipitated VE‐cadherin are shown on the right (from seven independent experiments).
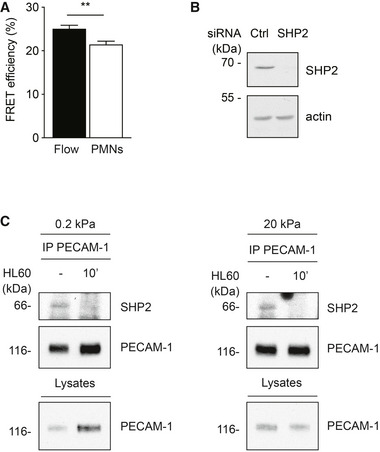
Quantification of FRET efficiency (percentage) at junctions of HUVEC treated with siRNAs for SHP2 and VE‐cadherin prior to transducing VE‐cadherin‐FL. Cells were exposed either to flow alone or to flow in the presence of PMNs and then fixed with 4% PFA followed by FLIM measurements at sites of PMN transmigration (PMN) or at junctions without PMNs (Flow).
Representative immunoblot for SHP2 and actin expression of HUVEC used for the experiments in (A).
HUVEC were grown on collagen‐coated polyacrylamide gels of varying physiologic stiffness of 0.2 kPa (left) and 20 kPa (right) and stimulated with TNF‐α for 17 h prior to adding HL60‐derived neutrophils for 20 min. PECAM‐1 immunoprecipitates and cell lysates were immunoblotted for the indicated antigens. Note that leukocytes triggered SHP2 dissociation from PECAM‐1 independent of substrate stiffness.
References
-
- Allingham MJ, van Buul JD, Burridge K (2007) ICAM‐1‐mediated, Src‐ and Pyk2‐dependent vascular endothelial cadherin tyrosine phosphorylation is required for leukocyte transendothelial migration. J Immunol 179: 4053–4064 - PubMed
-
- Aurrand‐Lions M, Johnson‐Leger C, Lamagna C, Ozaki H, Kita T, Imhof BA (2002) Junctional adhesion molecules and interendothelial junctions. Cells Tissues Organs 172: 152–160 - PubMed
-
- Barzilai S, Yadav SK, Morrell S, Roncato F, Klein E, Stoler‐Barak L, Golani O, Feigelson SW, Zemel A, Nourshargh S et al (2017) Leukocytes breach endothelial barriers by insertion of nuclear lobes and disassembly of endothelial actin filaments. Cell Rep 18: 685–699 - PubMed
-
- Bixel G, Kloep S, Butz S, Petri B, Engelhardt B, Vestweber D (2004) Mouse CD99 participates in T cell recruitment into inflamed skin. Blood 104: 3205–3213 - PubMed
Publication types
MeSH terms
Substances
LinkOut - more resources
Full Text Sources
Other Literature Sources
Miscellaneous
