. 2021 Apr;15(4):1069-1087.
doi: 10.1002/1878-0261.12929. Epub 2021 Mar 8.

Regulation of MRE11A by UBQLN4 leads to cisplatin resistance in patients with esophageal squamous cell carcinoma

Affiliations

Regulation of MRE11A by UBQLN4 leads to cisplatin resistance in patients with esophageal squamous cell carcinoma

Tomohiro Murakami et al. Mol Oncol. 2021 Apr.

Abstract

Resistance to standard cisplatin-based chemotherapies leads to worse survival outcomes for patients with esophageal squamous cell carcinoma (ESCC). Therefore, there is an urgent need to understand the aberrant mechanisms driving resistance in ESCC tumors. We hypothesized that ubiquilin-4 (UBQLN4), a protein that targets ubiquitinated proteins to the proteasome, regulates the expression of Meiotic Recombination 11 Homolog A (MRE11A), a critical component of the MRN complex and DNA damage repair pathways. Initially, immunohistochemistry analysis was conducted in specimens from patients with ESCC (n = 120). In endoscopic core ESCC biopsies taken from 61 patients who underwent neoadjuvant chemotherapy (NAC) (5-fluorouracil and cisplatin), low MRE11A and high UBQLN4 protein levels were associated with reduced pathological response to NAC (P < 0.001 and P < 0.001, respectively). Multivariable analysis of surgically resected ESCC tissues from 59 patients revealed low MRE11A and high UBLQN4 expression as independent factors that can predict shorter overall survival [P = 0.01, hazard ratio (HR) = 5.11, 95% confidence interval (CI), 1.45-18.03; P = 0.02, HR = 3.74, 95% CI, 1.19-11.76, respectively]. Suppression of MRE11A expression was associated with cisplatin resistance in ESCC cell lines. Additionally, MRE11A was found to be ubiquitinated after cisplatin treatment. We observed an amplification of UBQLN4 gene copy numbers and an increase in UBQLN4 protein levels in ESCC tissues. Binding of UBQLN4 to ubiquitinated-MRE11A increased MRE11A degradation, thereby regulating MRE11A protein levels following DNA damage and promoting cisplatin resistance. In summary, MRE11A and UBQLN4 protein levels can serve as predictors for NAC response and as prognostic markers in ESCC patients.

Keywords: MRE11; chemoresistance; esophageal cancer; neoadjuvant chemotherapy; ubiquilin-4.


Conflict of interest statement

The authors declare no conflict of interest.

Figures

Fig. 1
Fig. 1
Loss of MRE11A leads to chemotherapy resistance. (A) Scheme of the study design. (B) Pie chart showing the proportion of ESCC cases with high or low MRE11A in the TCGA ESCA database. ESCC patients were divided according to the z‐score values into 1) ≥ 1.5, 2) ≤ −1.5, or 3) < 1.5 and > −1.5 for MRE11A mRNA expression levels. (C) MRE11A mRNA expression levels in normal adjacent esophageal epithelia (n = 11) and primary ESCC tumors (n = 95) in the TCGA ESCA database (*P = 0.05). (D) Representative images of normal adjacent esophageal epithelia and primary ESCC tumors showing MRE11A protein levels stained for MRE11A using IHC. Scale bars = 50 µm. Right top insets on each picture show a magnification of MRE11A staining. Scale bars = 10 µm. (E) Comparison of H‐scores for MRE11A protein levels for normal adjacent esophageal epithelia (n = 7) and primary ESCC tumor tissues (n = 59) (***P < 0.001). (F) Kaplan–Meier curves comparing OS in ESCC patients with low (n = 34) versus high (n = 25) MRE11A protein levels (P < 0.01). (G) Representative images of core biopsy tissues from nonresponders (Patients 1 and 2) and responders (Patients 1 and 2) ESCC patients to NAC that were stained for MRE11A using IHC. Scale bars = 50 µm. Right top insets on each picture show a magnification of MRE11A staining. Scale bars = 10 µm. (H) Comparison of H‐scores for MRE11A protein levels in core biopsy tissues from nonresponders (n = 53) or responders (n = 8) ESCC patients to NAC (***P < 0.001). Error bars represent the mean ± SD. Statistical differences were tested using Mann–Whitney test (C), an unpaired two‐tailed t‐test with Welch’s correction (E and H) and log‐rank test (F).
Fig. 2
Fig. 2
MRE11A expression determines cisplatin resistance in ESCC cell lines. (A, B) Western blot analysis for MRE11A, UBQLN4, and β‐actin (loading control) comparing si‐Ctrl and si‐MRE11A in TE‐10 (A) and TE‐8 (B) parental cell lines. (C, D) Drug sensitivity assays comparing si‐Ctrl or si‐MRE11A in TE‐10 (C) and TE‐8 (D) parental cell lines treated with different cisplatin concentrations (**P < 0.01, ***P < 0.001). (E, F) MRE11A, UBQLN4, and β‐actin (loading control) comparing EV and MRE11A‐OV in TE‐10 (E) or TE‐8 (F) parental cell lines. (G, H) Drug sensitivity assays for TE‐10 (G) and TE‐8 (H), EV or MRE11A‐OV parental cell lines treated with different cisplatin concentrations (**P < 0.01, ***P < 0.001). (I, J) Drug sensitivity assays for TE‐10 (I) and TE‐8 (J) parental or established cisplatin‐resistant (Cis‐Res) cell lines treated with different cisplatin concentrations (*P < 0.05, ***P < 0.001). (K, L) Western blot analysis for MRE11A, UBQLN4, and β‐actin (loading control) comparing parental and cisplatin‐resistant (Cis‐Res) TE‐10 (K) or TE‐8 (L) ESCC cell lines. (M, N) Quantification of MRE11A protein levels analyzed by western blot comparing parental and cisplatin‐resistant (Cis‐Res) TE‐10 (M) or TE‐8 (N) ESCC cell lines (**P < 0.01, ***P < 0.001). Error bars represent the mean ± SD from n = 3 replicates. Statistical differences were tested using two‐way ANOVA test and post hoc Bonferroni test (C, D, G, H, I, and J) and unpaired two‐tailed t‐test (M and N).
Fig. 3
Fig. 3
UBQLN4 binds to ubiquitinated‐MRE11A and promotes MRE11A degradation. (A) TE‐4, TE‐8, and TE‐10 cell lines were profiled for UBQLN4, MRE11A, and α/β‐tubulin (loading control). (B) TE‐8 and TE‐10 clones with EV or UBQLN4‐OV were analyzed by western blot for UBQLN4 and β‐actin (loading control) (***P < 0.001). (C) Co‐IP assay in TE‐10 UBQLN4‐OV cell lines that were treated with cisplatin (5 μm) and MG‐132 (5 μm) using anti‐MRE11A IgG Ab or control IgG Ab. UBQLN4, MRE11A, and β‐actin (loading control) protein levels were assessed in WC lysates, SN, or Co‐IP fractions (Co‐IP). (D) Quantification of UBQLN4 and MRE11A in the Co‐IP fractions (**P < 0.01). (E) Co‐IP assay in TE‐4 cell lines overexpressing MRE11A and UBB that were treated with cisplatin (5 μm) and MG‐132 (5 μm) using anti‐UBQLN4 IgG Ab or control IgG Ab. MRE11A, DDK tag, and β‐actin (loading control) protein levels were assessed in WC lysates and Co‐IP fractions (Co‐IP). (F) Co‐IP assay in TE‐10 UBQLN4‐OV and UBB‐OV cell lines that were treated with cisplatin (5 μm) and MG‐132 (5 μm) using anti‐DDK IgG Ab or control IgG Ab. UBQLN4, DDK tag, and MRE11A protein levels were assessed in WC lysates and Co‐IP fractions (Co‐IP). (G) Cycloheximide chase assay in TE‐10 EV and UBQLN4‐OV cell lines. Western blot analysis was performed for MRE11A and β‐actin (loading control). (H) Quantification for MRE11A protein levels on the cycloheximide chase assay (*P < 0.05, **P < 0.01). (I) Cycloheximide chase assay in TE‐10 UBQLN4‐OV cell lines with or without MG‐132 (5 μm). Western blot analysis was performed for MRE11A and β‐actin (loading control). (J) Quantification for MRE11A protein levels on the cycloheximide chase assay (NS, not significant, **P < 0.01). Error bars represent the mean ± SD from n = 3 replicates. Statistical differences were tested using unpaired two‐tailed t‐test (B and D) and two‐way ANOVA test and post hoc Bonferroni test (H and J).
Fig. 4
Fig. 4
High UBQLN4 leads to worse postoperative survival in ESCC patients. (A) Pie chart showing the proportion ESCC cases with high and low UBQLN4 mRNA expression levels in the TCGA ESCA database. ESCC patients were divided according to the z‐score values into 1) ≥ 1.5, 2) ≤ −1.5, or 3) < 1.5 and > −1.5 for UBQLN4 mRNA expression levels. (B) Comparison of UBQLN4 mRNA expression levels in normal adjacent esophageal epithelia (n = 11) and primary ESCC tumors (n = 95) in the TCGA ESCA database (*P < 0.05). (C) The relationship between CNV and UBQLN4 mRNA expression levels was assessed in primary ESCC tumors using the TCGA ESCA database (n = 95) (NS, not significant, *P < 0.05, ***P < 0.001). (D) Correlation between linear CNV and UBQLN4 mRNA expression levels (Spearman r = 0.579, P < 0.001). (E) Representative images of UBQLN4 protein levels in normal adjacent esophageal epithelia and primary ESCC tumors stained for UBQLN4 by IHC. Scale bars = 50 µm. Right top insets on each picture show a magnification of MRE11A staining. Scale bars = 10 µm. (F) Comparison of H‐scores for UBQLN4 protein levels in normal adjacent esophageal epithelia (n = 10) and primary ESCC tumors tissues (n = 59) (***P < 0.001). (G) H‐scores for UBQLN4 protein levels in normal adjacent esophageal epithelia tissue (n = 10), nonrecurrent primary ESCC (n = 36), and recurrent primary ESCC tumors (n = 23) (NS, not significant, ***P < 0.001). (H) Kaplan–Meier curves comparing OS in ESCC patients with low (n = 39) versus high (n = 20) UBQLN4 protein levels (P < 0.01). (I) Kaplan–Meier curves comparing OS in ESCC patients with concurrent low UBQLN4 and high MRE11A (n = 14) versus high UBQLN4 and low MRE11A (n = 10) protein levels (P < 0.001). (J) Representative images of core biopsy tissues from nonresponders (Patients 1 and 2) or responders (Patients 1 and 2) ESCC patients to NAC that were stained for UBQLN4 using IHC. Scale bars = 50 µm. Right top insets on each picture show a magnification of MRE11A staining Scale bars = 10 µm. (K) Comparison of H‐scores for UBQLN4 protein levels in core biopsy tissues from nonresponders (n = 53) and responders (n = 8) ESCC patients to NAC (***P < 0.001). Error bars represent the mean ± SD. Statistical differences were tested using Mann–Whitney test (B), an unpaired two‐tailed t‐test with Welch’s correction (F and K), ordinary one‐way ANOVA test and Bonferroni post hoc test (C and G), spearman correlation (D), and log‐rank test (H and I).
Fig. 5
Fig. 5
UBQLN4 expression determines the sensitivity to cisplatin in ESCC cell lines. (A) Western blot analysis for UBQLN4 and β‐actin (loading control) in TE‐4 cell lines treated with si‐Ctrl or si‐UBQLN4 (pool siRNA). (B) TE‐4 cell lines were treated with si‐Ctrl or si‐UBQLN4 and cell proliferation was analyzed at indicated time points (***P < 0.001). (C) TE‐4 cell lines were treated with si‐Ctrl or si‐UBQLN4 and analyzed for colony formation. The bar graph showed the quantification of colonies after 12 days of incubation (***P < 0.001). (D) Drug sensitivity assays comparing si‐Ctrl and si‐UBQLN4 in TE‐4 cell lines treated with different cisplatin concentrations (*P < 0.05). (E, F) Cell proliferation assays were performed at indicated time points in TE‐8 (E) and TE‐10 (F) cell lines with EV or UBQLN4‐OV (*P < 0.05, ***P < 0.001). (G, H) Drug sensitivity assays comparing EV and UBQLN4‐OV in TE‐8 (G) and TE‐10 (H) cell lines treated with different cisplatin concentrations (***P < 0.001). Error bars represent the mean ± SD from n = 3 replicates. Statistical differences were tested using two‐way ANOVA test and post hoc Bonferroni test (B, D, E, F, G, and H) and unpaired two‐tailed t‐test (C).
Fig. 6
Fig. 6
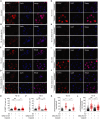
UBQLN4‐OV alleviated DNA damage induced by cisplatin in ESCC cell lines. (A–D) IF staining for 53BP1 was performed in cisplatin‐treated (5 μm, 12 h) or untreated TE‐10 EV (A), TE‐10 UBQLN4‐OV (B), TE‐8 EV (C), and TE‐8 UBQLN4‐OV (D) cell lines. Shown are 53BP1 (red), DAPI (blue), and the merged images. Scale bars: 10 µm. (E, F) Quantification of the number (#) of 53BP1 foci per cell for TE‐10 (E) and TE‐8 (F) cell lines (NS, not significant, ***P < 0.001). (G‐J) IF staining for γ‐H2AX was performed in cisplatin‐treated (5 μm, 12 h) or untreated TE‐10 EV (G), TE‐10 UBQLN4‐OV (H), TE‐8 EV (I), and TE‐8 UBQLN4‐OV (J) cell lines. Shown are γ‐H2AX (red), DAPI (blue), and the merged images. Scale bars = 10 µm. (K‐L) Quantification of γ‐H2AX fluorescence intensity per cell for TE‐10 (K) and TE‐8 (L) cell lines (NS, not significant, **P < 0.01, ***P < 0.001). Error bars represent the mean ± SD from n = 3 replicates. Statistical differences were tested using ordinary one‐way ANOVA test and Bonferroni post hoc test (E, F, K, and L).

Similar articles

Cited by

References

    1. Bray F, Ferlay J, Soerjomataram I, Siegel RL, Torre LA & Jemal A (2018) Global cancer statistics 2018: GLOBOCAN estimates of incidence and mortality worldwide for 36 cancers in 185 countries. CA Cancer J Clin 68, 394–424. - PubMed
    1. Enzinger PC & Mayer RJ (2003) Esophageal cancer. N Engl J Med 349, 2241–2252. - PubMed
    1. Arnold M, Soerjomataram I, Ferlay J & Forman D (2015) Global incidence of oesophageal cancer by histological subtype in 2012. Gut 64, 381–387. - PubMed
    1. Smyth EC, Lagergren J, Fitzgerald RC, Lordick F, Shah MA, Lagergren P & Cunningham D (2017) Oesophageal cancer. Nat Rev Dis Primers 3, 17048. - PMC - PubMed
    1. Abnet CC, Arnold M & Wei WQ (2018) Epidemiology of esophageal squamous cell carcinoma. Gastroenterology 154, 360–373. - PMC - PubMed

Publication types