. 2021 Feb 19;16(2):e0247445.
doi: 10.1371/journal.pone.0247445. eCollection 2021.

A control theory approach to optimal pandemic mitigation

Affiliations

A control theory approach to optimal pandemic mitigation

Prakhar Godara et al. PLoS One. .

Erratum in

Abstract

In the framework of homogeneous susceptible-infected-recovered (SIR) models, we use a control theory approach to identify optimal pandemic mitigation strategies. We derive rather general conditions for reaching herd immunity while minimizing the costs incurred by the introduction of societal control measures (such as closing schools, social distancing, lockdowns, etc.), under the constraint that the infected fraction of the population does never exceed a certain maximum corresponding to public health system capacity. Optimality is derived and verified by variational and numerical methods for a number of model cost functions. The effects of immune response decay after recovery are taken into account and discussed in terms of the feasibility of strategies based on herd immunity.


Conflict of interest statement

The authors have declared that no competing interests exist.

Figures

Fig 1
Fig 1. Space of mitigation measures.
Sketch of the space of possible mitigation measures (grey shade), spanned by their effect on the infection rate, α, and their socio-economic cost, f(α). Normal societal life is at the origin, while the upper right corner corresponds to total mutual isolation of all citizens, which is the strongest possible intervention. The dashed and dotted curves depict possible choices for mitigation measures. Such curves correspond to the cost functions referred to in the manuscript (see Eq (7).
Fig 2
Fig 2. Trajectories in the (S, I)-plane.
Dashed curve: trajectory with no mitigation starting at (S, I) = (1, 0), R0 = 3. Horizontal dashed line: maximum load of the HSS, Ih (here we have set Ih = 0.1 for clarity, although this is unrealistically large). Solid curve: trajectory, (S*(t), I*(t)), for an optimal choice of α(t) (see Eq 16). The corresponding characteristic of α(S) follows the dash-dotted curve in phase II, the mitigation phase. There is no mitigation in phases I and III (α = 0).
Fig 3
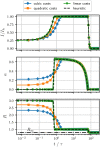
Fig 3. Numerical solutions for optimal control.
Optimal control trajectories for different cost functions fi(α(t)) ∈ {α(t), α2(t), α3(t)}. The corresponding optimal terminal times, te*, are determined as {65.99τ, 66.13τ, 66.31τ}. I0 = 0.0025, Ih = 0.01, R0 = 3, S(te*)=R01. R is the asymptotic reproduction number for t → ∞, given by R = −W(exp(−1 − R0 Ih)), with the Lambert W function.
Fig 4
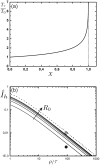
Fig 4. Duration of the pandemic and minimum health system capacity.
(a) The normalized duration of the pandemic, Tr/T0, as a function of the variable X = T0/(τ + ρ) (Eq 29). (b) Solid curves: The minimum required health system capacity I^h to reach herd immunity (Eq 30) as a function of the duration of immunity after recovery, for different values of R0 (from 1.5 to 4.0 in steps of 0.5). Dotted curve: limit R0 → ∞. Circles represent the scenario for ρ = 93τ. Open: Ih = 0.01. Closed: Ih = 0.0025.
Fig 5
Fig 5. Phase portrait of the uncontrolled SIR model.
Phase portrait, (I˙(S,I),S˙(S,I)), for the uncontrolled SIR model (α = 0) with finite immune response (Eq 24). The solid green curve shows a trajectory in phase III, with initial conditions (circle) I0 = Ih (capacity limit) and S0 = 1/R0 (herd immunity), The dashed curves (orange) show the nullclines, I˙=0 (for S = 1/R0 or I = 0), and S˙=0 (for S = (1 − I)/(IR0 ρ/τ + 1)). The stable fixed point (diamond) is given by I=I^h, S = 1/R0. Parameters: R0 = 3, ρ/τ = 93, Ih = 0.01.
Fig 6
Fig 6. Typical pandemic scenarios for different average immunity loss times, ρ/τ ∈ {50, 93, 200, ∞}, corresponding to curves from right to left (or see color code), and different values for Ih, namely 0.01 in the top (a) graph and 0.0025 in the bottom (b) graph.
Solid curves: S(t). Dashed curves: α(t). The fraction of acutely infected citizens is kept at Ih in phase II until herd immunity is reached (S = 1/R0, horizontal dashed line). If this is successful (if Ih>I^h, see Eq 30) phase III begins: Mitigation measures are being released (α = 0) and S(t) oscillates around its limiting value S = 1/R0. Other parameters: R0 = 3, τ = 10 days.

References

    1. World Health Organization. Report of the who-china joint mission on coronavirus disease 2019 (covid-19); 2020. Available from: https://www.who.int/docs/default-source/coronaviruse/who-china-joint-mis....
    1. Enserink M, Kupferschmidt K. With COVID-19, modeling takes on life and death importance. Science. 2020;367:1414 10.1126/science.367.6485.1414-b - DOI - PubMed
    1. Dehning J, Zierenberg J, Spitzner FP, Wibral M, Neto JP, Wilczek M, et al. Inferring change points in the spread of COVID-19 reveals the effectiveness of interventions. Science. 2020;369 (6500). 10.1126/science.abb9789 - DOI - PMC - PubMed
    1. Hethcote HW. The mathematics of infectiuous diseases. SIAM Review. 2000;42:599–653. 10.1137/S0036144500371907 - DOI
    1. Harko T, Lobo FSN, Mak MK. Exact analytical solutions of the Susceptible-Infected-Recovered (SIR) epidemic model and of the SIR model with equal death and birth rates. Applied Mathematics and Computation. 2014;236:184–194. 10.1016/j.amc.2014.03.030 - DOI

Publication types

LinkOut - more resources