. 2021 Feb 18;184(4):1098-1109.e9.
doi: 10.1016/j.cell.2021.01.029.

Massive expansion of human gut bacteriophage diversity

Affiliations

Massive expansion of human gut bacteriophage diversity

Luis F Camarillo-Guerrero et al. Cell. .

Abstract

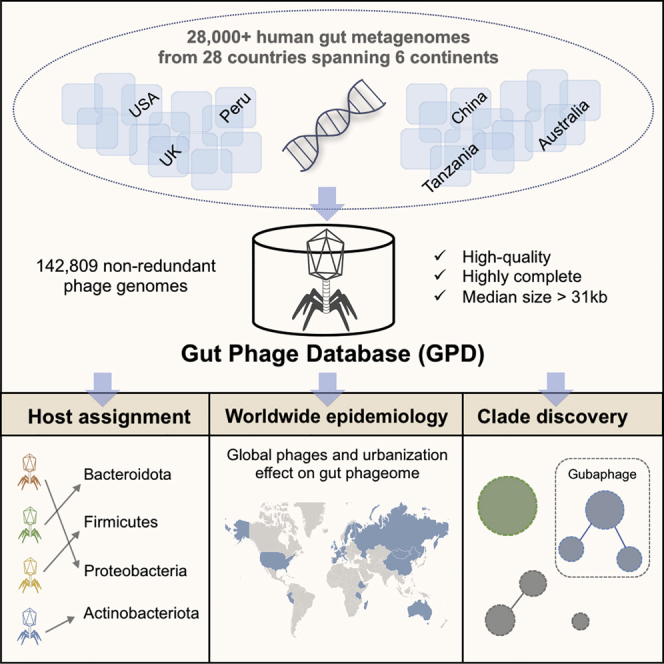
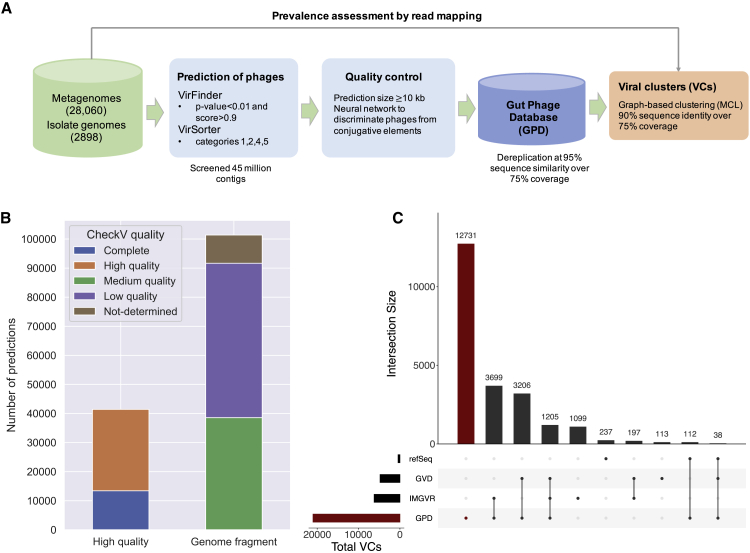
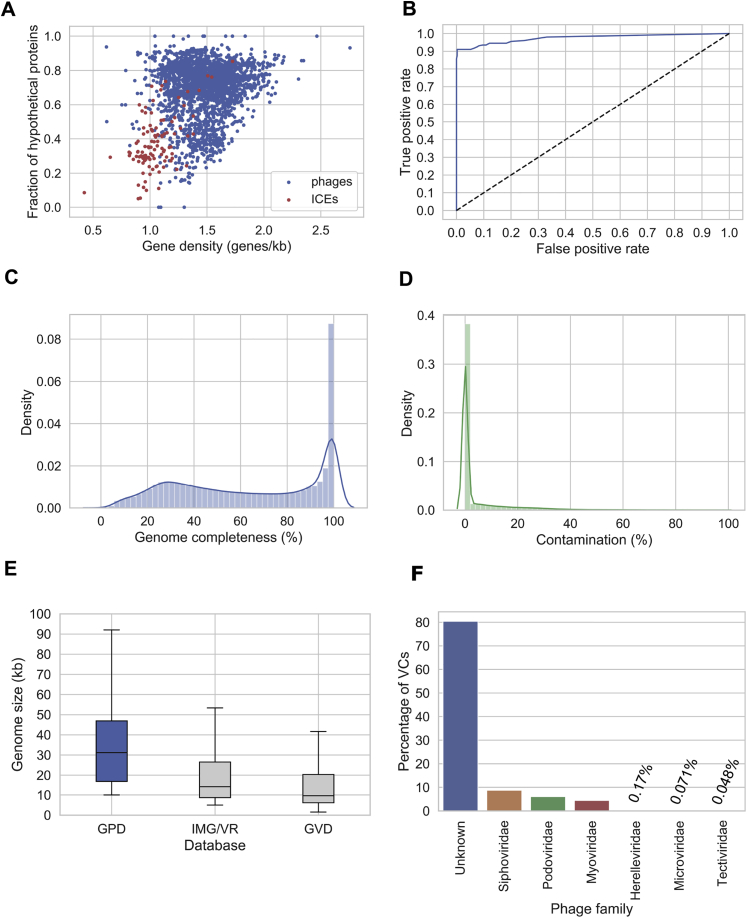
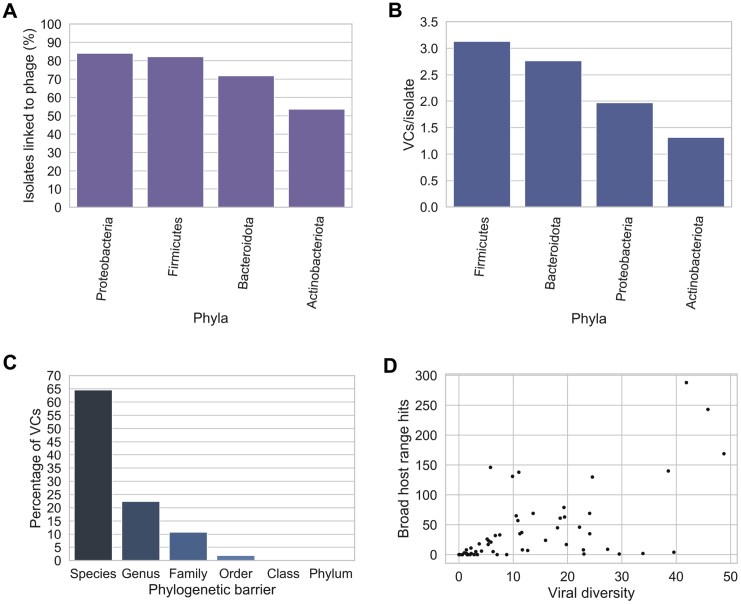
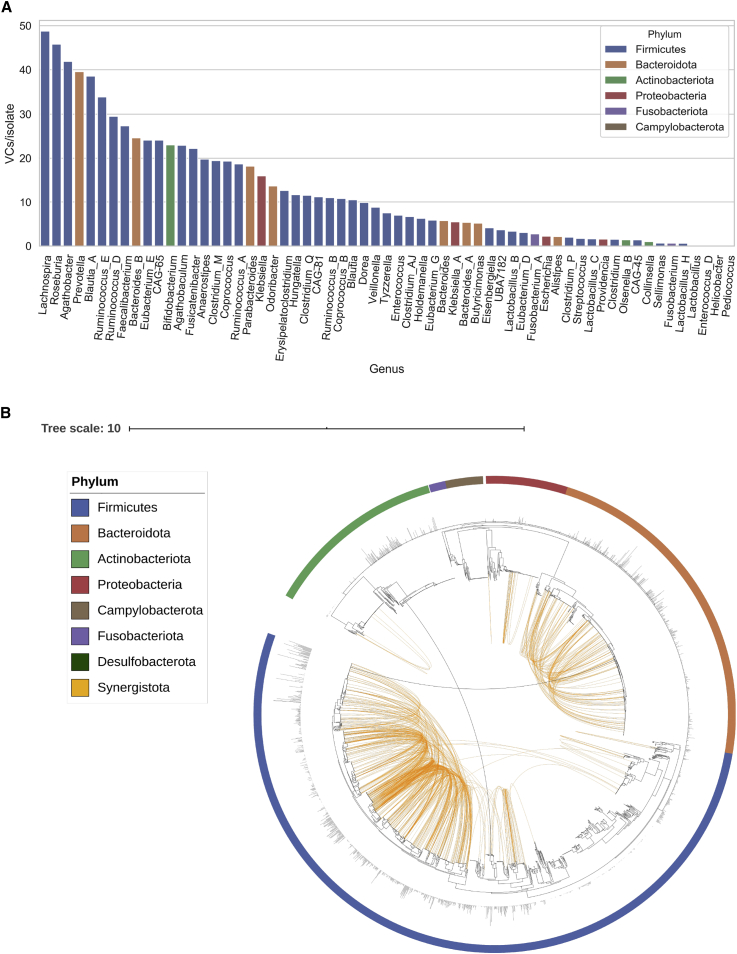
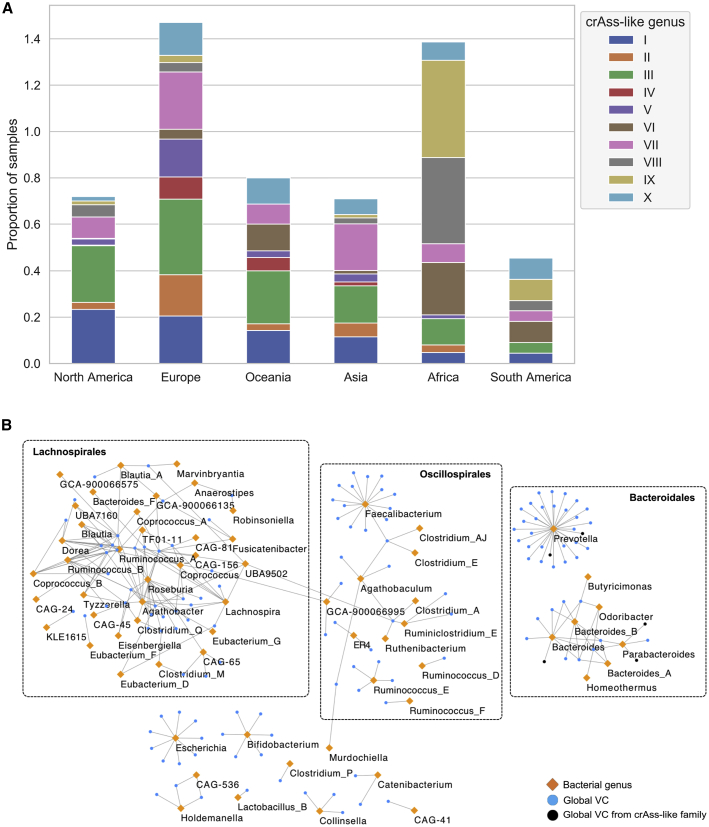
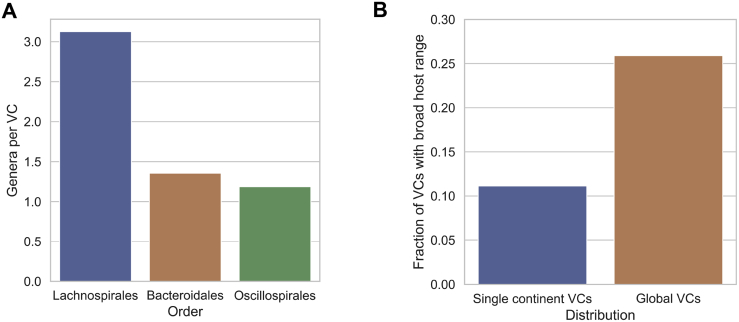
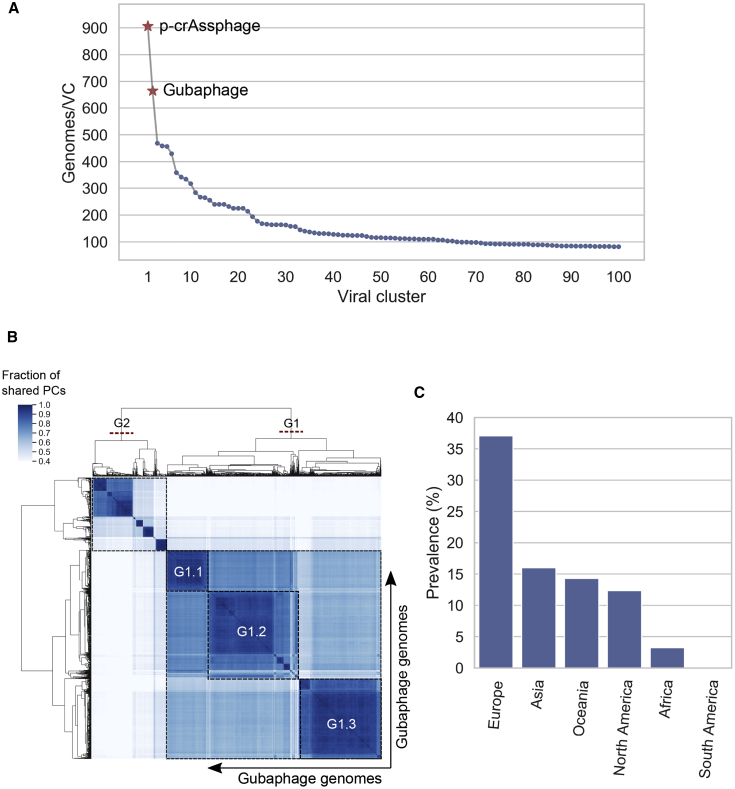
Bacteriophages drive evolutionary change in bacterial communities by creating gene flow networks that fuel ecological adaptions. However, the extent of viral diversity and its prevalence in the human gut remains largely unknown. Here, we introduce the Gut Phage Database, a collection of ∼142,000 non-redundant viral genomes (>10 kb) obtained by mining a dataset of 28,060 globally distributed human gut metagenomes and 2,898 reference genomes of cultured gut bacteria. Host assignment revealed that viral diversity is highest in the Firmicutes phyla and that ∼36% of viral clusters (VCs) are not restricted to a single species, creating gene flow networks across phylogenetically distinct bacterial species. Epidemiological analysis uncovered 280 globally distributed VCs found in at least 5 continents and a highly prevalent phage clade with features reminiscent of p-crAssphage. This high-quality, large-scale catalog of phage genomes will improve future virome studies and enable ecological and evolutionary analysis of human gut bacteriophages.

Keywords: database; gut bacteria; human gut; metagenomics; microbiome; phage; virus.


Conflict of interest statement

Declaration of Interests T.D.L. is the co-founder and Chief Scientific Officer of Microbiotica Pty Ltd

Figures

None
Graphical abstract
Figure 1
Figure 1
Generating the most complete sequence database of human gut bacteriophages (A) Massive prediction of phage genomes from 28,060 human gut metagenomes and 2,898 isolate genomes was carried out by using VirFinder and VirSorter with conservative settings. A machine learning approach (see STAR methods) was used to increase the quality of predictions and redundancy was removed by clustering the sequences at a 95% sequence identity. Diversity was further analyzed by generating VCs of predictions with a graph-based approach. (B) Quality estimation of GPD genomes by CheckV. Over 40,000 predictions are categorized as high-quality. (C) UpSet plot comparing GPD against other public gut phage databases. GPD captures the greatest unique diversity of phage genomes that inhabit the human gut.
Figure S1
Figure S1
Generating the most complete sequence database of human gut bacteriophages, related to Figure 1 A) Gene density and fraction of hypothetical proteins are features that can be harnessed discriminate phages from ICEs. B) ROC curve showing the high performance (AUC > 0.97) of the neural network developed to decontaminate ICEs from phages. C) Genome completeness distribution as estimated by CheckV on GPD. D) GPD contamination distribution according to CheckV. E) Size distribution of GPD against other public databases. F) Assignment of viral taxonomy to GPD predictions.
Figure S2
Figure S2
Bacterial host assignment and host range for gut phage, related to Figure 2 A) Percentage of isolates of each phylum linked to phage by CRISPR spacers and prophage assignment. Actinobacteria had the lowest percentage of isolates predicted to be a phage host. Actinobacteria versus Bacteroidota (p = 0.007, test), Actinobacteria versus Proteobacteria (p = 0.0025, test), Actinobacteria versus Firmicutes (p = 1.01 × 10−5, test). B) The Firmicutes hosted the highest viral diversity (highest number of VCs/isolate). Firmicutes versus Bacteroidota (p = 0.021, test), Firmicutes versus Proteobacteria (p = 4.41 × 10-6, test), Firmicutes versus Actinobacteriota (p = 1.1 × 10−31, test) C) The majority of VCs were found to be restricted to infect a single species. However, a considerable number of VCs (~36%) had a broader host range (p = 0.0, binomial test). D) In general, the higher the viral diversity per bacterial genus, the higher the number of phages with broad host range (Spearman’s Rho = 0.6685, p = 3.91x10⁻⁹).
Figure 2
Figure 2
Bacterial host assignment and host range for gut phage (A) Bacterial genera with the highest viral diversity were Lachnospira, Roseburia, Agathobacter, Prevotella, and Blautia A. On the other hand, the lowest viral diversity was harbored by Helicobacter and the lactic acid bacteria Lactobacillus, Lactobacillus H, Enterococcus D, and Pediococcus. (B) Phylogenetic tree of 2,898 gut bacteria isolates showing phage host range. Host assignment was carried out by linking prophages with their assemblies and CRISPR spacer matching. Orange connections represent VCs with a very broad host range (not restricted to a single genus). Black connections represent VCs able to infect 2 phyla. Outer bars show phage diversity (VCs/isolate).
Figure S3
Figure S3
Relationship between sample sequencing depth and phage richness, related to Figure 3 Samples exhibit a positive correlation between sequencing depth and number of phage genomes detected. In order to reduce this bias, we analyzed only samples with a sequencing depth > 50 million reads/sample. Correlation of samples with sequencing depth < 50 million (Pearson’s r: 0.6825, p = 0.0). Correlation of samples with sequencing depth > 50 million (Pearson’s r: 0.3681, p = 2.79x10−97).
Figure 3
Figure 3
Global phylogeography of gut phages (A) Principal-component analysis (PCA) plot of inter-sample Jaccard distance. Lifestyle is associated with differences in the gut phageome across human populations. Samples from Peru, Madagascar, Tanzania, and Fiji are found in the rural cluster, whereas those samples with a more Westernized lifestyle (mainly from North America, Europe, and Asia) are found in the urban cluster (p = 0.001, R2 = 0.36, PERMANOVA test). Ellipses enclose samples within 2 standard deviations for each lifestyle. (B) The proportion of viral sequences (at 95% sequence identity dereplicated) that target Prevotellaceae hosts in traditional societies is higher than that of industrialized populations. Conversely, Bacteroides hosts are more common in industrialized populations than in traditional societies. This result suggests that the composition of the gut phageome at a global scale is driven by the bacterial composition.
Figure 4
Figure 4
Global gut phage clades and their bacterial hosts (A) The crAss-like family is a globally distributed phage. Genera VI, VIII, and IX—which are predicted to infect a Prevotella host—are more common in Africa and South America than are genus I, which infects a Bacteroides host. (B) Host-phage network of globally distributed VCs (orange) reveals that Prevotella, Faecalibacterium, and Roseburia are the most targeted bacterial genera. In contrast to the Bacteroidales and Oscillospirales, the VCs from the Lachnospirales are highly shared. VCs that belong to the crAss-like family are highlighted in black; these were predicted to infect Prevotella, Bacteroides, and Parabacteroides.
Figure S4
Figure S4
Global gut phage clades and their bacterial hosts, related to Figure 4 A) When analyzing globally distributed VCs, the VCs from the order of Lachnospirales were shared across a wider range of genera than those within Oscillospirales and Bacteroidales. Lachnospirales versus Bacteroidales (p = 9.99 × 10−6, test). Lachnospirales versus Oscillospirales (p = 6.55 × 10−6, test). B) We observed that globally distributed phages had a significantly broader range (above genus) than phages found in single continents (p = 1.63 × 10−5, test).
Figure 5
Figure 5
The Gubaphage is a highly prevalent clade in the gut (A) VCs composed of only GPD predictions ranked by number of genomes. VC_3, which belongs to the Gubaphage clade, was the second biggest cluster after VC_1 (composed of p-crAssphage genomes). (B) Analysis of Gubaphage phylogenetic structure revealed 2 genera infecting members of the Bacteroides (G1) and Parabacteroides (G2). (C) The Gubaphage clade was found in 5 continents, with Europe harboring the highest number of infected samples (38%), as opposed to South America, with none detected.
Figure S5
Figure S5
The Gubaphage is a highly prevalent clade in the human gut, related to Figure 5 A) Unrooted phylogenetic tree of the large terminase gene from 226 crAss-like genomes and 44 Gubaphage sequences with complete (non-truncated) terminases. Roman numerals correspond to the 10 crass-like genera. The Gubaphage significantly diverged from other crAss-like phages forming a distant clade of its own (red). B) Genome wide comparison across Gubaphage clades. The three main regions in which the Gubaphage genome is divided can be appreciated (segment with a run of hypothetical proteins, DNA processing and structural proteins). There is a high protein sequence similarity among members of the G1 clade compared to those of G2.

References

    1. Abadi M., Barham P., Chen J., Chen Z., Davis A., Dean J., Devin M., Ghemawat S., Irving G., Isard M. Proceedings of the 12th USENIX Conference on Operating Systems Design and Implementation. USENIX Association; 2016. TensorFlow: a system for large-scale machine learning; pp. 265–283.
    1. Ackermann H.W. Tailed bacteriophages: the order caudovirales. Adv. Virus Res. 1998;51:135–201. - PMC - PubMed
    1. Al-Shayeb B., Sachdeva R., Chen L.-X., Ward F., Munk P., Devoto A., Castelle C.J., Olm M.R., Bouma-Gregson K., Amano Y. Clades of huge phages from across Earth’s ecosystems. Nature. 2020;578:425–431. - PMC - PubMed
    1. Almeida A., Nayfach S., Boland M., Strozzi F., Beracochea M., Shi Z.J., Pollard K.S., Sakharova E., Parks D.H., Hugenholtz P. A unified catalog of 204,938 reference genomes from the human gut microbiome. Nat. Biotechnol. 2021;39:105–114. - PMC - PubMed
    1. Altschul S.F., Gish W., Miller W., Myers E.W., Lipman D.J. Basic local alignment search tool. J. Mol. Biol. 1990;215:403–410. - PubMed

Publication types