

Novel Lineage-Tracing System to Identify Site-Specific Ectopic Bone Precursor Cells
- PMID: 33606989
- PMCID: PMC7940250
- DOI: 10.1016/j.stemcr.2021.01.011
Novel Lineage-Tracing System to Identify Site-Specific Ectopic Bone Precursor Cells
Abstract
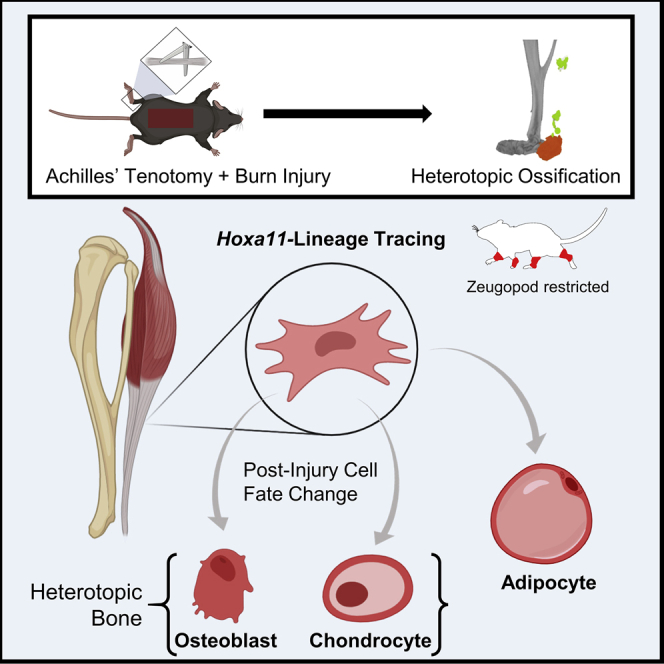
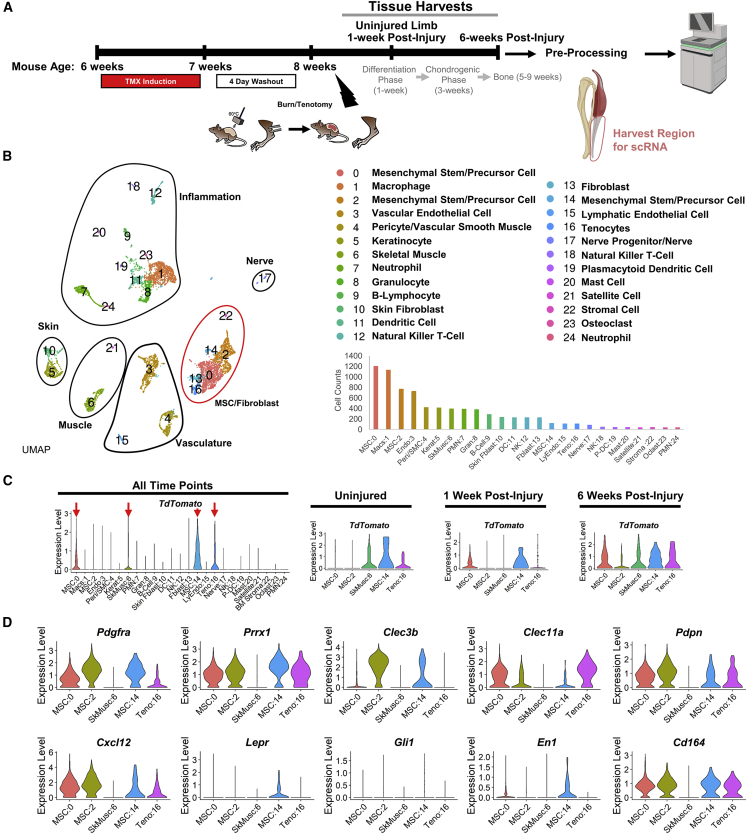
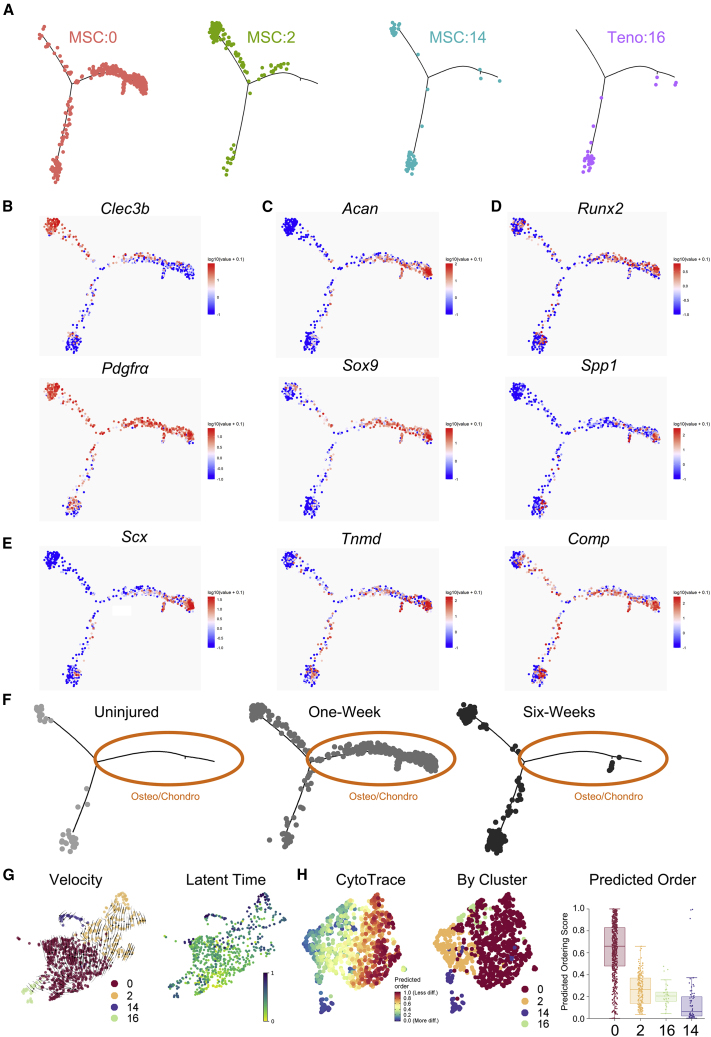
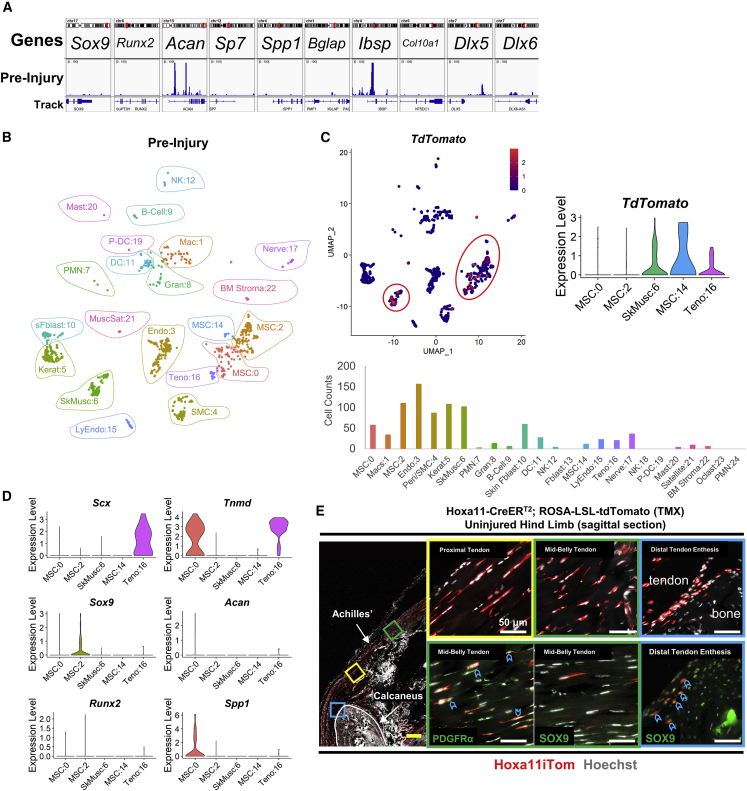
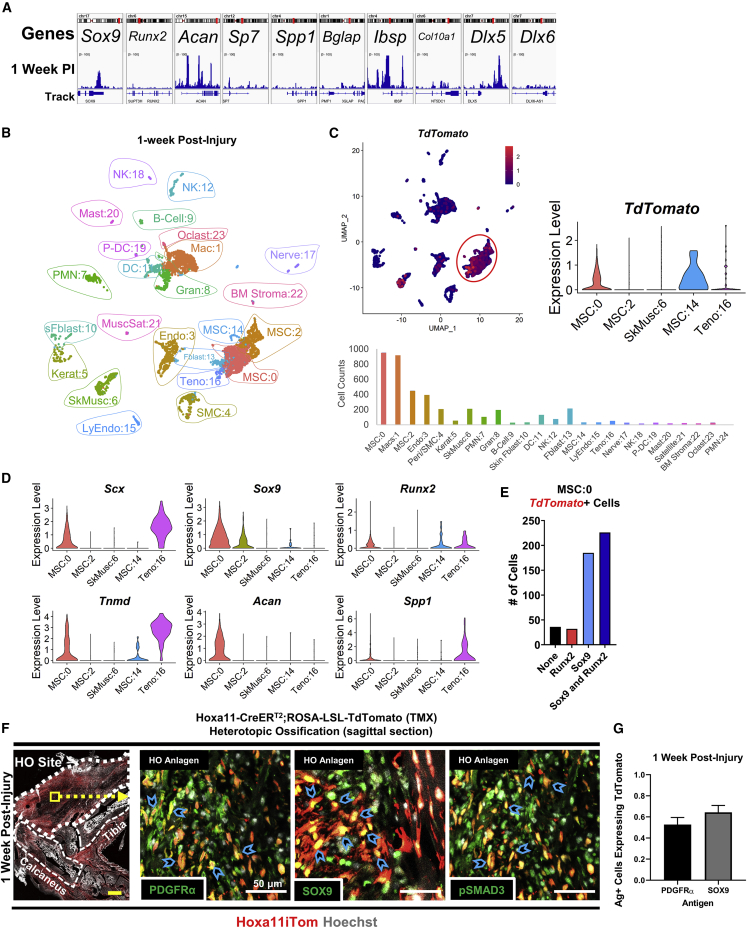
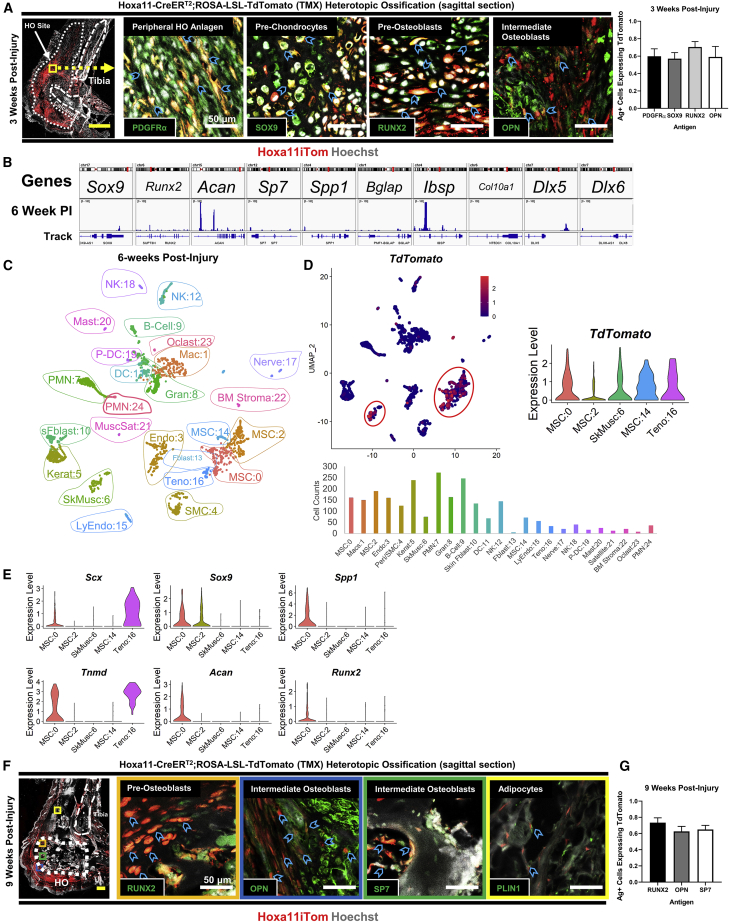
Heterotopic ossification (HO) is a form of pathological cell-fate change of mesenchymal stem/precursor cells (MSCs) that occurs following traumatic injury, limiting range of motion in extremities and causing pain. MSCs have been shown to differentiate to form bone; however, their lineage and aberrant processes after trauma are not well understood. Utilizing a well-established mouse HO model and inducible lineage-tracing mouse (Hoxa11-CreERT2;ROSA26-LSL-TdTomato), we found that Hoxa11-lineage cells represent HO progenitors specifically in the zeugopod. Bioinformatic single-cell transcriptomic and epigenomic analyses showed Hoxa11-lineage cells are regionally restricted mesenchymal cells that, after injury, gain the potential to undergo differentiation toward chondrocytes, osteoblasts, and adipocytes. This study identifies Hoxa11-lineage cells as zeugopod-specific ectopic bone progenitors and elucidates the fate specification and multipotency that mesenchymal cells acquire after injury. Furthermore, this highlights homeobox patterning genes as useful tools to trace region-specific progenitors and enable location-specific gene deletion.
Keywords: Hoxa11; aberrant differentiation; heterotopic ossification; mesenchymal progenitors; tendon.
Copyright © 2021 The Authors. Published by Elsevier Inc. All rights reserved.
Figures
Similar articles
-
Hox11 expressing regional skeletal stem cells are progenitors for osteoblasts, chondrocytes and adipocytes throughout life.Nat Commun. 2019 Jul 18;10(1):3168. doi: 10.1038/s41467-019-11100-4. Nat Commun. 2019. PMID: 31320650 Free PMC article.
-
Polycystin-1 regulates tendon-derived mesenchymal stem cells fate and matrix organization in heterotopic ossification.Bone Res. 2025 Jan 20;13(1):11. doi: 10.1038/s41413-024-00392-y. Bone Res. 2025. PMID: 39833160 Free PMC article.
-
Single-Cell Integration Analysis of Heterotopic Ossification and Fibrocartilage Developmental Lineage: Endoplasmic Reticulum Stress Effector Xbp1 Transcriptionally Regulates the Notch Signaling Pathway to Mediate Fibrocartilage Differentiation.Oxid Med Cell Longev. 2021 Oct 26;2021:7663366. doi: 10.1155/2021/7663366. eCollection 2021. Oxid Med Cell Longev. 2021. PMID: 34737845 Free PMC article.
-
Heterotopic ossification of tendon and ligament.J Cell Mol Med. 2020 May;24(10):5428-5437. doi: 10.1111/jcmm.15240. Epub 2020 Apr 15. J Cell Mol Med. 2020. PMID: 32293797 Free PMC article. Review.
-
Skeletal morphogenesis during embryonic development.Crit Rev Eukaryot Gene Expr. 2009;19(3):197-218. doi: 10.1615/critreveukargeneexpr.v19.i3.30. Crit Rev Eukaryot Gene Expr. 2009. PMID: 19883365 Review.
Cited by
-
A new mouse model of post-traumatic joint injury allows to identify the contribution of Gli1+ mesenchymal progenitors in arthrofibrosis and acquired heterotopic endochondral ossification.Front Cell Dev Biol. 2022 Aug 24;10:954028. doi: 10.3389/fcell.2022.954028. eCollection 2022. Front Cell Dev Biol. 2022. PMID: 36092701 Free PMC article.
-
CTR9 drives osteochondral lineage differentiation of human mesenchymal stem cells via epigenetic regulation of BMP-2 signaling.Sci Adv. 2022 Nov 18;8(46):eadc9222. doi: 10.1126/sciadv.adc9222. Epub 2022 Nov 16. Sci Adv. 2022. PMID: 36383652 Free PMC article.
-
Single-cell mapping of regenerative and fibrotic healing responses after musculoskeletal injury.Stem Cell Reports. 2022 Oct 11;17(10):2334-2348. doi: 10.1016/j.stemcr.2022.08.011. Epub 2022 Sep 22. Stem Cell Reports. 2022. PMID: 36150381 Free PMC article.
-
PI3K-Akt signalling regulates Scx-lineage tenocytes and Tppp3-lineage paratenon sheath cells in neonatal tendon regeneration.Nat Commun. 2025 Apr 20;16(1):3734. doi: 10.1038/s41467-025-59010-y. Nat Commun. 2025. PMID: 40254618 Free PMC article.
-
Itaconate-producing neutrophils regulate local and systemic inflammation following trauma.JCI Insight. 2023 Oct 23;8(20):e169208. doi: 10.1172/jci.insight.169208. JCI Insight. 2023. PMID: 37707952 Free PMC article.
References
-
- Bergen V., Lange M., Peidli S., Wolf F.A., Theis F.J. Generalizing RNA velocity to transient cell states through dynamical modeling. Nat. Biotechnol. 2020;38:1408–1414. - PubMed
Publication types
MeSH terms
Substances
Grants and funding
LinkOut - more resources
Full Text Sources
Other Literature Sources
Molecular Biology Databases
Research Materials
