

Review
doi: 10.1016/S2214-109X(20)30488-5.
Epub 2021 Feb 16.
The Lancet Global Health Commission on Global Eye Health: vision beyond 2020
Affiliations
- PMID: 33607016
- PMCID: PMC7966694
- DOI: 10.1016/S2214-109X(20)30488-5
Item in Clipboard
Review
The Lancet Global Health Commission on Global Eye Health: vision beyond 2020
Lancet Glob Health.
2021 Apr.
No abstract available
Figures
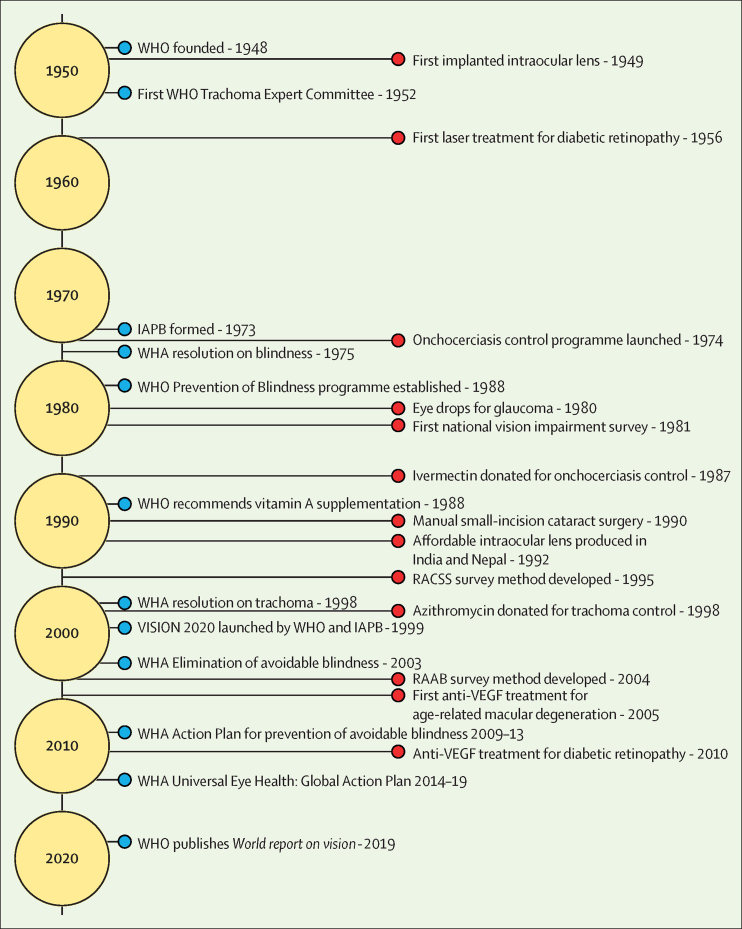
The development of global eye health Blue circles indicate major global developments. Red circles indicate major treatments and programmatic developments. WHA=World Health Assembly. IAPB=International Agency for the Prevention of Blindness. RAAB=Rapid Assessment of Avoidable Blindness. RACSS=Rapid Assessment of Cataract Surgical Services.
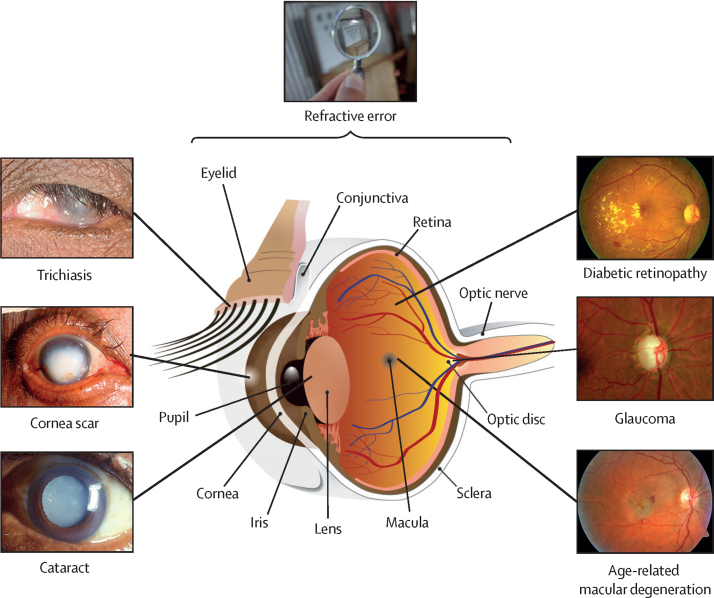
The human eye and common conditions The location and clinical appearance of common causes of vision impairment.
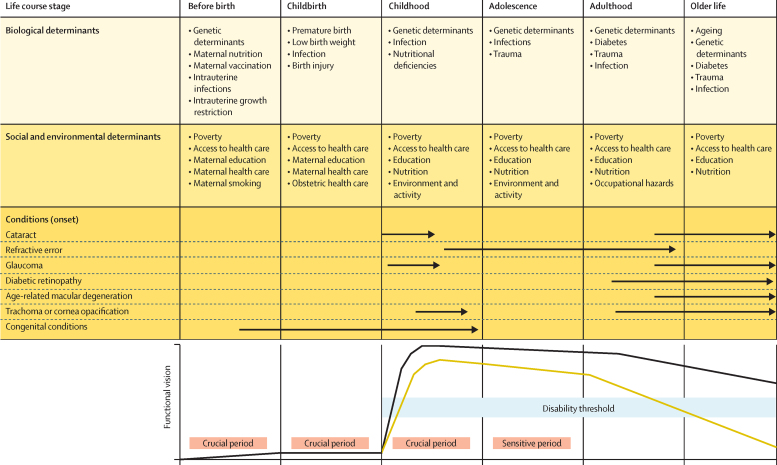
Life course perspective on eye health Arrows indicate the period in the life course in which different conditions typically present. The yellow line indicates a hypothetical functional vision trajectory of someone with a condition leading to increased vision impairment. The black line represents the functional vision trajectory of someone who does not have a condition leading to vision impairment. This figure is partly based on the concept of functional trajectories illustrated in WHO, 2001. The disability threshold represents the level of functional vision below which there is functional vision impairment.
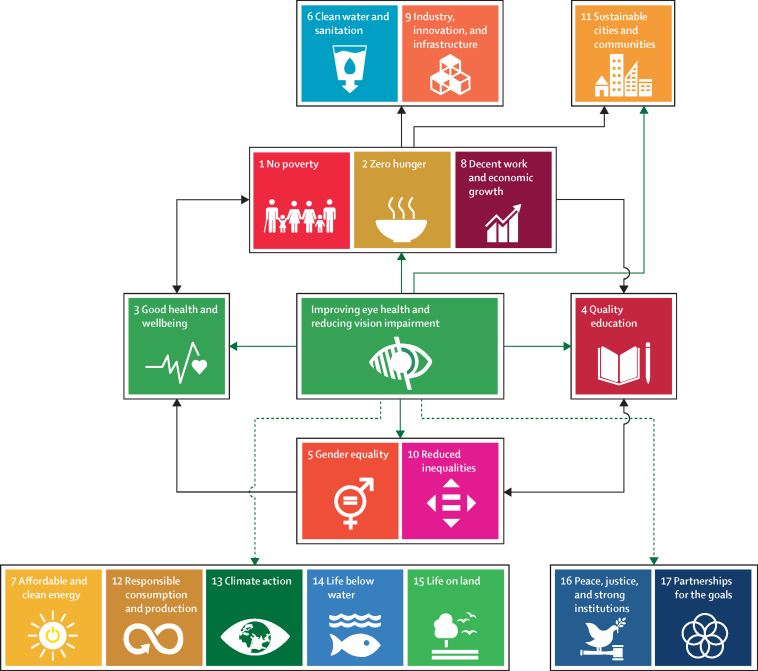
Improving eye health and Sustainable Development Goals Green arrows indicate relationships with direct evidence of a beneficial effect from improving eye health on Sustainable Development Goals. Dashed green arrows represent hypothesised direct beneficial effects. Black arrows represent possible indirect beneficial effects.
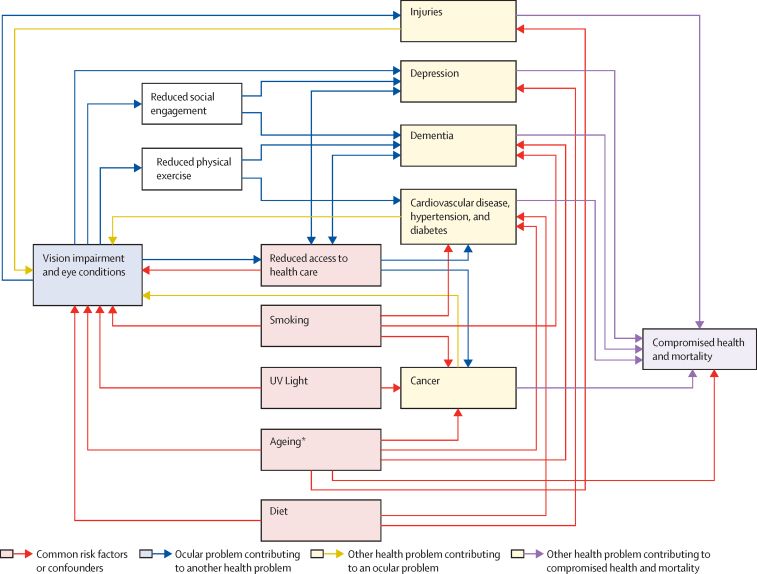
Relationships between vision impairment and general health These associations are derived from multiple literature reviews done by this Commission. *Hypothetical common degenerative pathways.
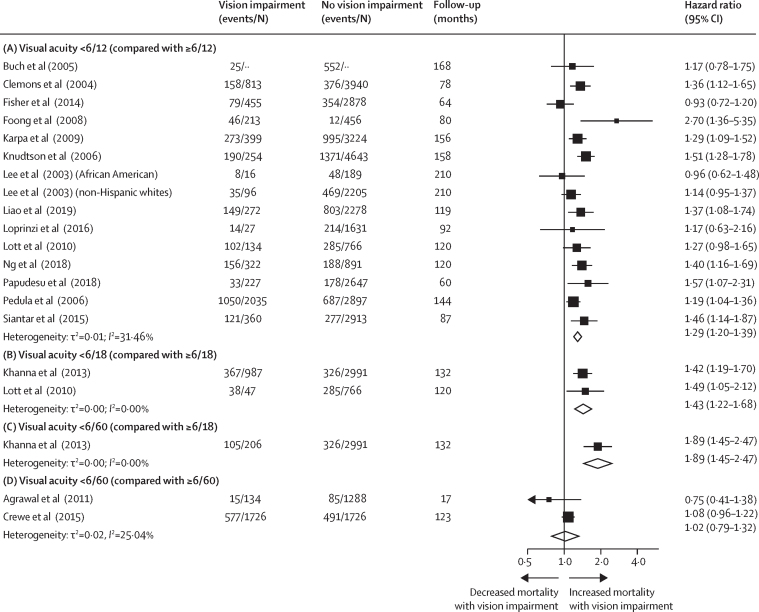
Vision impairment and mortality Random-effects meta-analysis results showing the maximally adjusted pooled hazard of mortality in adults with (A) mild vision impairment or worse (<6/12 compared with ≥6/12); (B) moderate vision impairment or worse (<6/18 compared with ≥6/18); (C) severe vision impairment or worse (<6/60 compared with ≥6/18); and (D) severe vision impairment or worse (<6/60 compared with ≥6/60). Events are defined as the number of participants in the study who died, and N is the total number of participants in the study. 12 cohorts that were included in the systematic review are not depicted in this figure for the following reasons: they used other vision impairment thresholds that could not be aggregated with these studies; they reported results per unit difference in visual acuity; they reported odds ratios or risk ratios that could not be pooled with HRs; or they compared a reference category of participants with good vision to participants with various vision impairment categories. References can be found in appendix 1 (p 100).
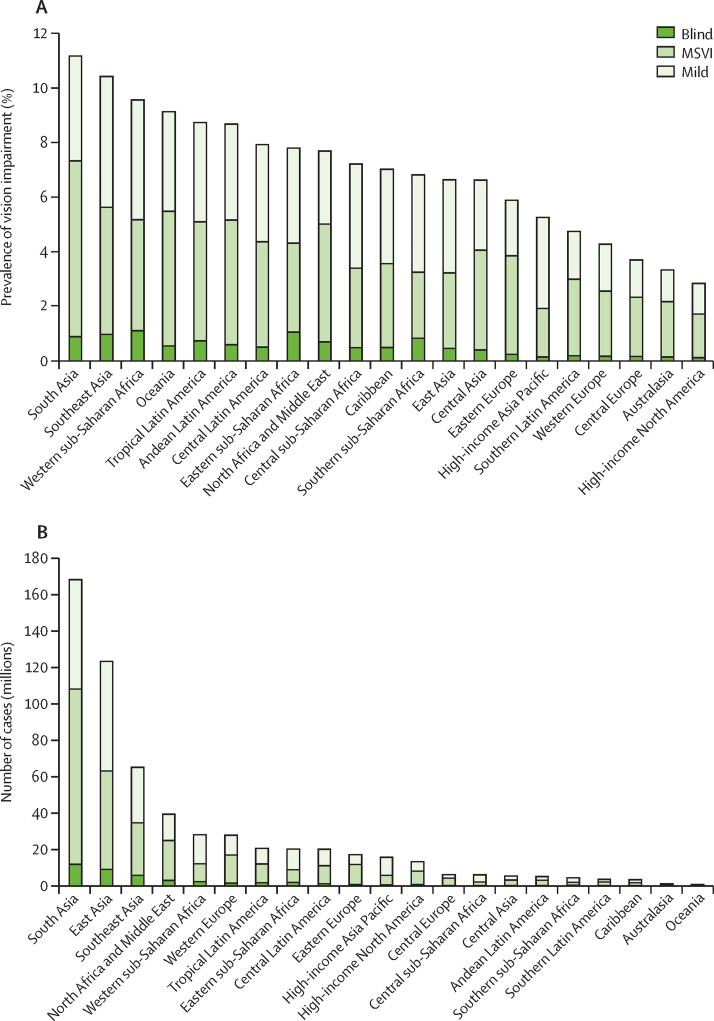
Vision impairment by Global Burden of Disease region (A) Age-standardised prevalence of vision impairment and (B) number of people with vision impairment. Data from VLEG–GBD. MSVI=moderate and severe vision impairment.
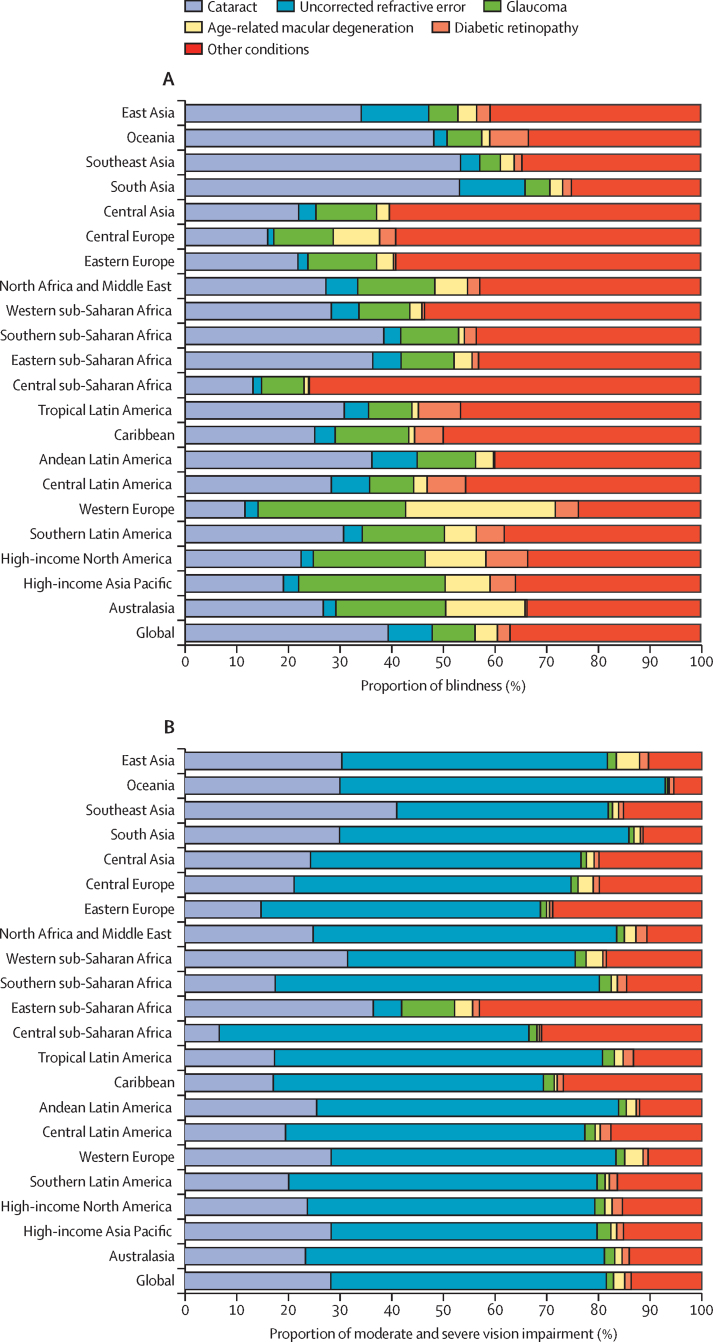
Causes of vision impairment by Global Burden of Disease region (A) Blindness and (B) moderate and severe vision impairment attributable to the five leading causes of vision impairment and other conditions (combined), all ages. Data are presented for the 21 Global Burden of Disease regions. Data from VLEG–GBD.
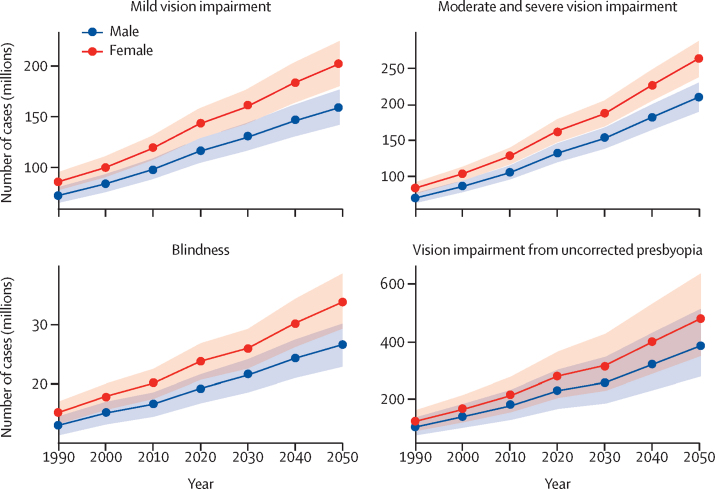
Forecast to 2050 of global cases of blindness and vision impairment by sex Reproduced from VLEG–GBD, 2020.
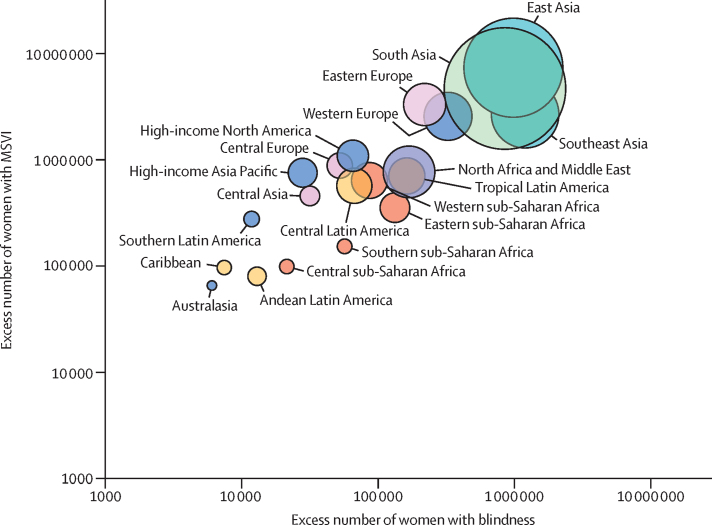
Women with blindness and MSVI Excess number of women over men, in adults (≥50 years). Data are plotted for the 21 Global Burden of Disease regions using a log scale. Size of the circle represents the total number of adults with blindness and MSVI in that region. Oceania has less than 1000 excess women with MSVI and was not plotted on this figure. Data available in appendix 1 (p 33), from VLEG–GBD. MSVI=moderate and severe vision impairment.
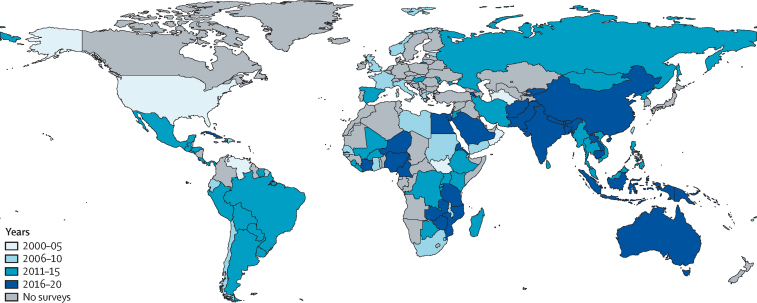
Most recent population-based eye health surveys globally All surveys (rapid and comprehensive, national or subnational) done since 2000. Not applicable indicates that no surveys were done. Data from VLEG–GBD, and the Rapid Assessment of Avoidable Blindness Repository .
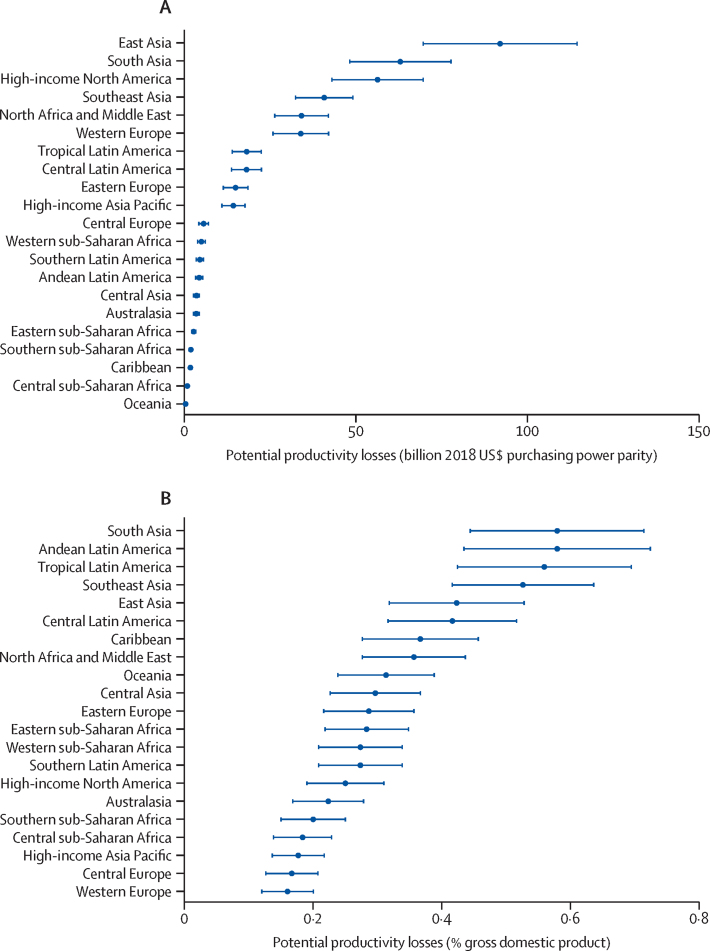
Productivity losses resulting from vision impairment Estimates made for 2020 using the number of people who were blind or had moderate and severe vision impairment, an employment gap of 30·2%, 2018 employment rates, and gross domestic product for (A) productivity loss, and (B) as a percentage of gross domestic product.
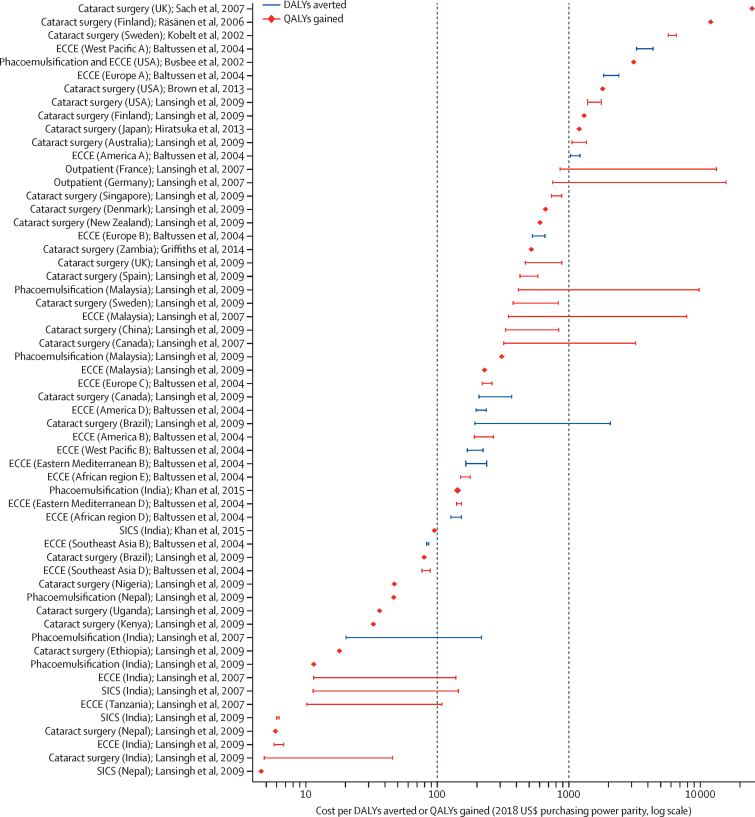
Cost-effectiveness ratios for cataract surgery Studies reporting either DALYs averted or QALYs gained. Costs have been inflated to 2018 levels and converted to US$ purchasing power parity. Studies which provide only a single estimate are plotted as a diamond. For studies reporting more than one estimation the highest and lowest values are plotted as a range (appendix 1 pp 56–57). Letters shown next to some regions are related to the WHO regional coding labels. References for this figure can be found in appendix 1 (p 101). DALYs=disability-adjusted life-years. ECCE=extracapsular cataract surgery. QALYs=quality-adjusted life-years. SICS=small-incision cataract surgery.
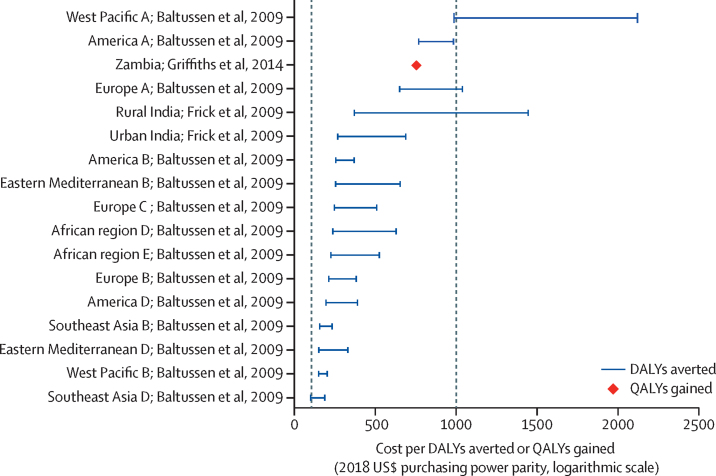
Cost-effectiveness ratios for refractive error services Cost-effectiveness of screening and treating refractive error in schoolchildren, and for facility-based refractive error services for all ages. Studies reported either DALYs averted or QALYs gained. Costs have been inflated to 2018 levels and converted to US$ purchasing power parity. For studies reporting more than one estimation, the highest and lowest values are plotted as a range (appendix 1 p 57). References for this figure can be found in appendix 1 (p 101).
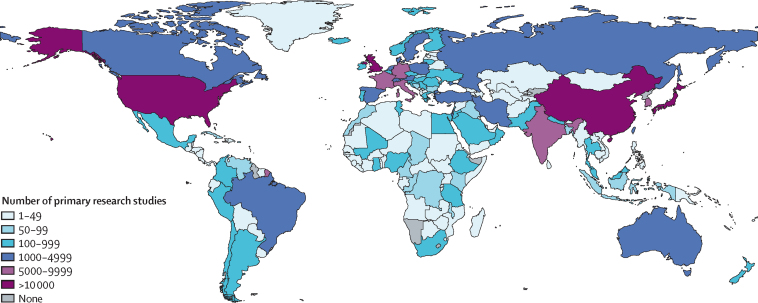
Global distribution of research Number of primary research studies on vision and eye health, by country, done between 2000 and 2019 (studies identified by “explode eye disease” on MEDLINE, July 10, 2020; n=156 954; appendix 1 pp 58–59).
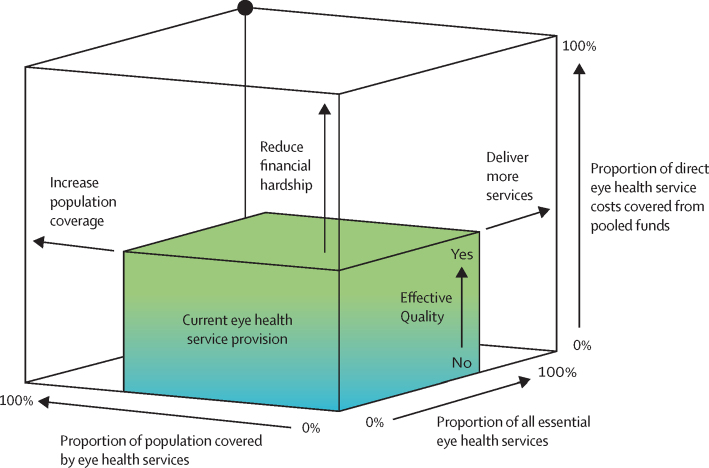
Considerations for universal eye health coverage Adapted from WHO 2015, to contextualise to eye health services and include the quality component. The inner cube has a colour gradation representing a range in the quality of delivered services; green represents effective quality services and blue represents ineffective services.
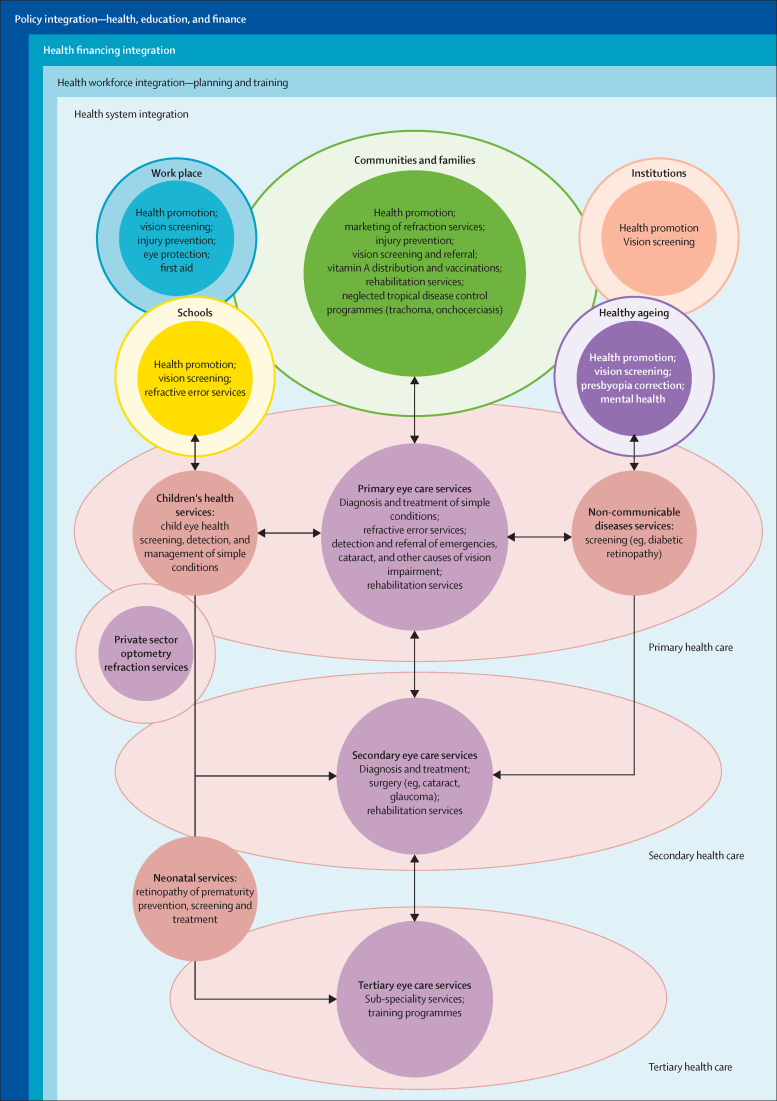
Integration of eye health services within the health-care system
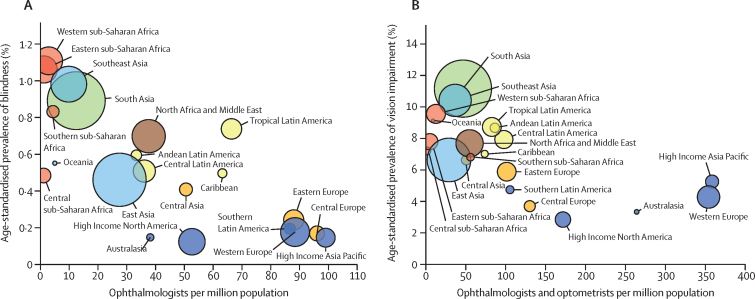
Vision impairment and eye health workforce Shown for the Global Burden of Disease regions. (A) Age-standardised prevalence of blindness (all ages) by the number of ophthalmologists per million population. The circle area is proportional to the number of people who are blind. (B) Age-standardised prevalence of vision impairment (mild, moderate, severe, and blind; all ages) by the number of ophthalmologists and optometrists per million population. The circle area is proportional to the number of people who have vision impairment. Data from Resnikoff et al, VLEG–GBD, and World Council of Optometry.
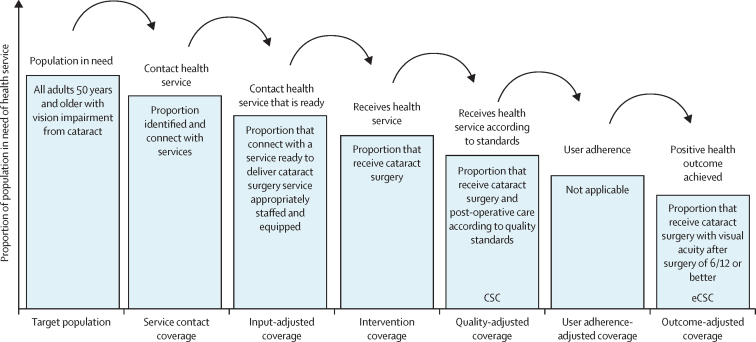
Effective coverage cascade for cataract surgical services CSC=cataract surgical coverage. eCSC=effective cataract surgical coverage.
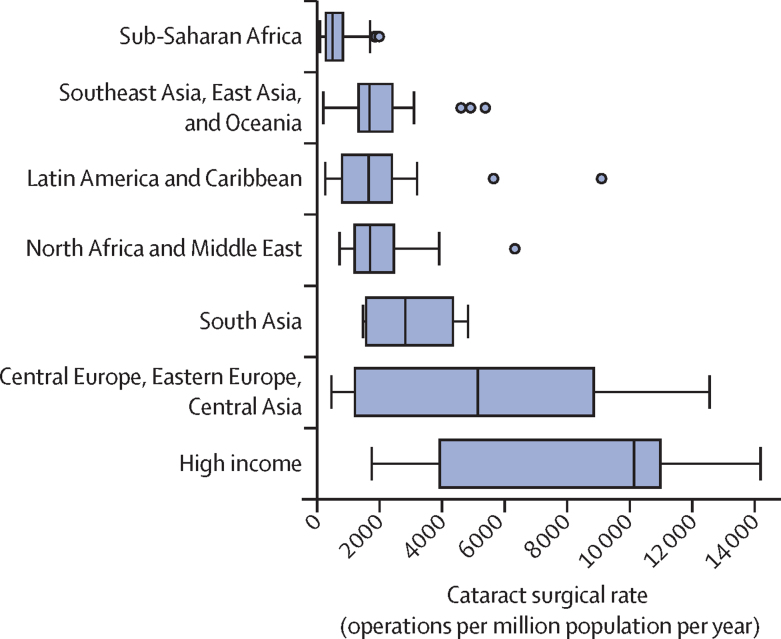
Cataract surgical rate by Global Burden of Disease super region Box and whisker plots; midlines are the median, boxes represent IQR, whiskers are upper and lower adjacent values. Outliers are plotted as individual dots.
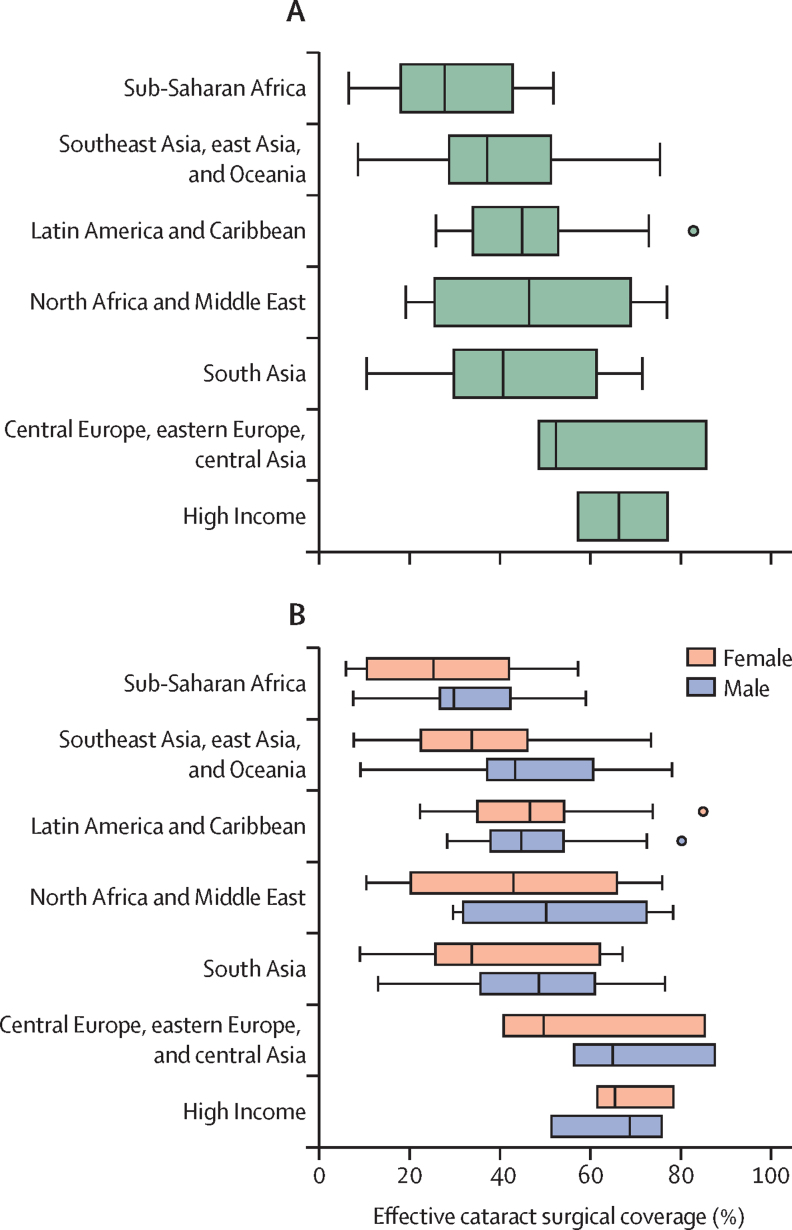
Effective cataract surgical coverage by Global Burden of Disease super region (A) Cluster-adjusted, age-adjusted, and sex-adjusted estimates. (B) Cluster-adjusted, age-adjusted, and sex-disaggregated estimates. Box and whisker plots; midlines are the median, boxes represent IQR, whiskers are upper and lower adjacent values. Outliers are plotted as individual dots. Countries within regions are represented by the most recent national or subnational Rapid Assessment of Avoidable Blindness survey and if two or more assessments occurred within 2 years, the median of estimates was used (appendix 1 pp 84–85).
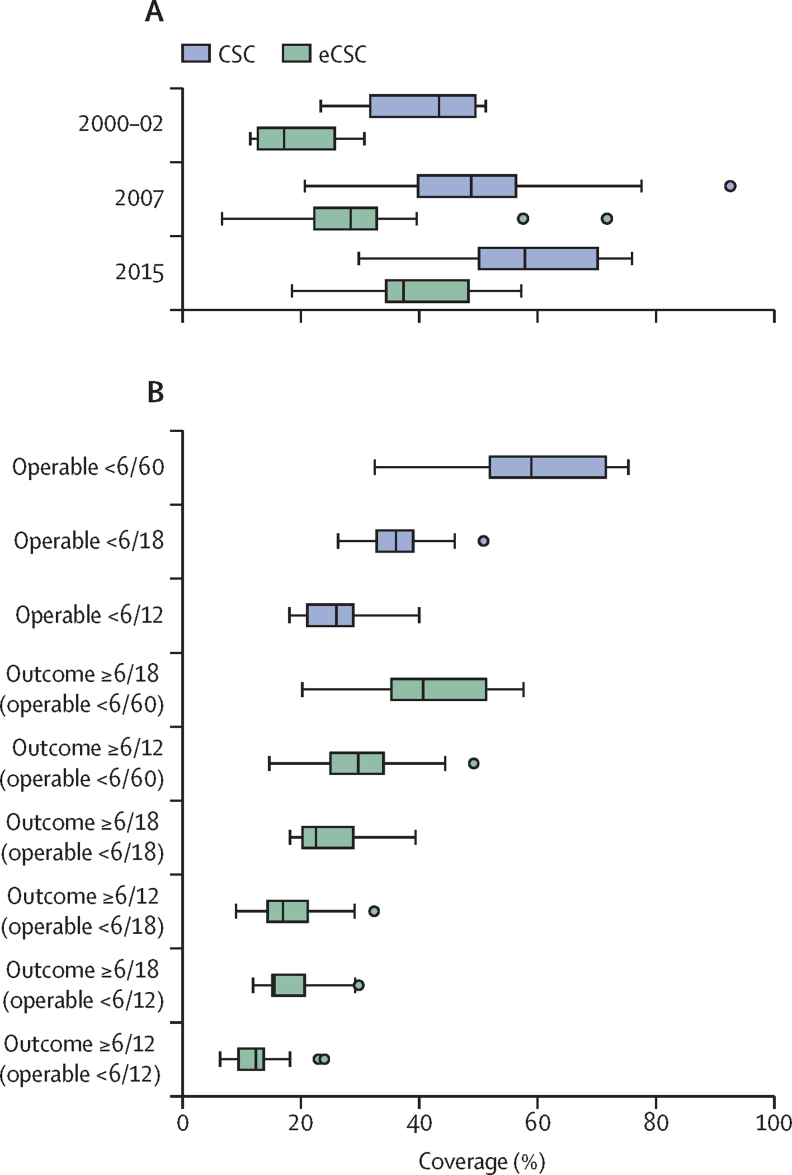
Cataract surgical coverage in Vietnam (A) Cluster-adjusted, age-adjusted, and gender-adjusted data from subnational Rapid Assessment of Avoidable Blindness surveys done in Vietnam in 2000–02 (n=8), 2007 (n=16), and 2015 (n=14), estimated for an operable cataract threshold of worse than 6/60 and a good clinical outcome of 6/18 or greater. (B) Data from 14 subnational surveys done in Vietnam in 2015. Data are plotted for three thresholds of operable cataract and two different levels of vision outcome: 6/18 or better and 6/12 or better. Box and whisker plots; midlines are the median, boxes represent IQR, whiskers are upper and lower adjacent values. Outliers are plotted as individual dots. CSC=cataract surgical coverage. eCSC=effective cataract surgical coverage.
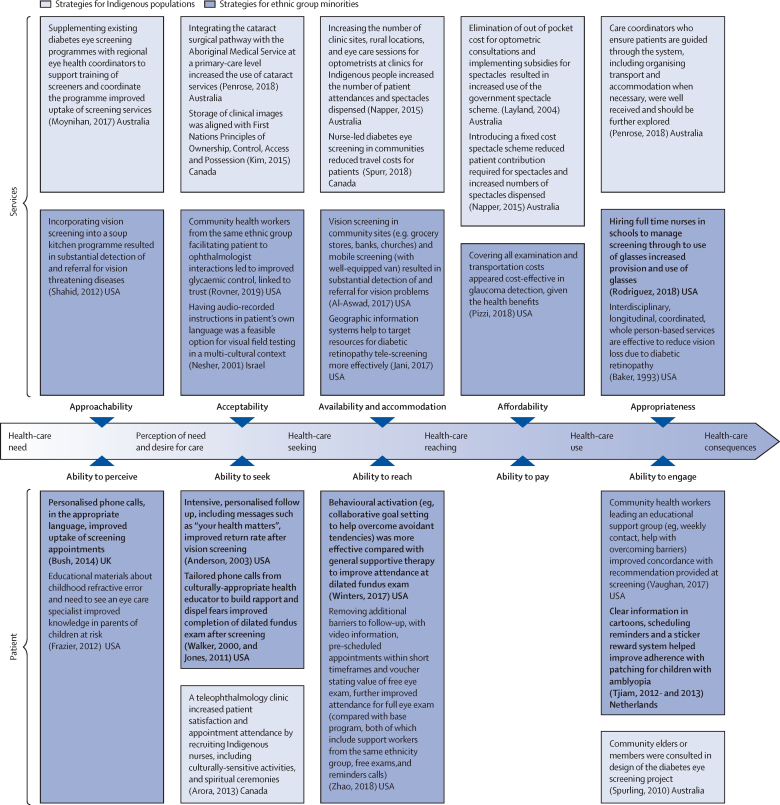
Strategies to improve access to eye care for Indigenous and other minority ethnic groups Identified from scoping reviews for Indigenous people and other non-dominant ethnic groups in high-income countries, mapped to the patient-centred access framework by Levesque et al. Randomised controlled trials are shown in bold. References can be found in appendix 1 (p 102).
Comment in
-
Ageing and vision loss: looking to the future.Lancet Glob Health. 2021 Apr;9(4):e385-e386. doi: 10.1016/S2214-109X(21)00031-0. Epub 2021 Feb 16. Lancet Glob Health. 2021. PMID: 33607013 No abstract available.
-
Eye health and the Decade of Action for the Sustainable Development Goals.Lancet Glob Health. 2021 Apr;9(4):e383-e384. doi: 10.1016/S2214-109X(21)00035-8. Epub 2021 Feb 16. Lancet Glob Health. 2021. PMID: 33607014 No abstract available.
-
Lessons from 2020 for equity in global eye health.Lancet Glob Health. 2021 Apr;9(4):e387-e388. doi: 10.1016/S2214-109X(21)00036-X. Epub 2021 Feb 16. Lancet Glob Health. 2021. PMID: 33607017 No abstract available.
-
Visual function rather than visual acuity.Lancet Glob Health. 2021 Jul;9(7):e913. doi: 10.1016/S2214-109X(21)00225-4. Lancet Glob Health. 2021. PMID: 34143992 No abstract available.
-
Visual function rather than visual acuity - Authors' reply.Lancet Glob Health. 2021 Jul;9(7):e914. doi: 10.1016/S2214-109X(21)00246-1. Lancet Glob Health. 2021. PMID: 34143993 No abstract available.
-
Madras eye outbreak in India: Why should we foster a better understanding of acute conjunctivitis?Indian J Ophthalmol. 2023 May;71(5):2298-2299. doi: 10.4103/IJO.IJO_3317_22. Indian J Ophthalmol. 2023. PMID: 37202982 Free PMC article. No abstract available.
References
-
- GBD 2019 Blindness and Vision Impairment Collaborators. on behalf of the Vision Loss Expert Group of the Global Burden of Disease Study (VLEG–GBD) Trends in prevalence of blindness and distance and near vision impairment over 30 years: an analysis for the Global Burden of Disease Study. Lancet Glob Health. 2021;9:e130–e143. - PMC - PubMed
-
- WHO World report on vision. 2019. https://www.who.int/publications/i/item/world-report-on-vision
-
- WHO Framework on integrated people-centred health services. 2016. https://apps.who.int/gb/ebwha/pdf_files/WHA69/A69_39-en.pdf?ua=1&ua=1
-
- WHO ICD-11 for mortality and morbidity statistics (version: 04/2019)—9D90 vision impairment including blindness. 2019. https://icd.who.int/browse11/l-m/en#/http%3a%2f%2fid.who.int%2ficd%2fent...
Publication types
MeSH terms
Grants and funding
LinkOut - more resources
Full Text Sources
Other Literature Sources
Medical
