. 2021 Apr 26;31(8):1653-1665.e5.
doi: 10.1016/j.cub.2021.01.074. Epub 2021 Feb 18.

A genome-scale phylogeny of the kingdom Fungi

Affiliations

A genome-scale phylogeny of the kingdom Fungi

Yuanning Li et al. Curr Biol. .

Abstract

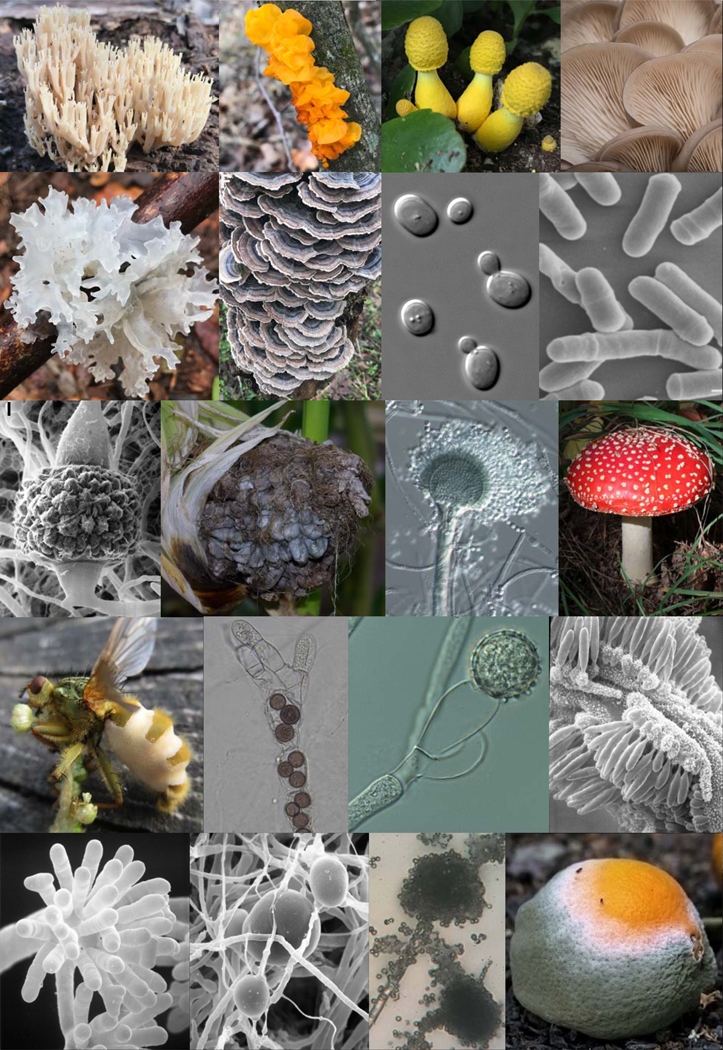
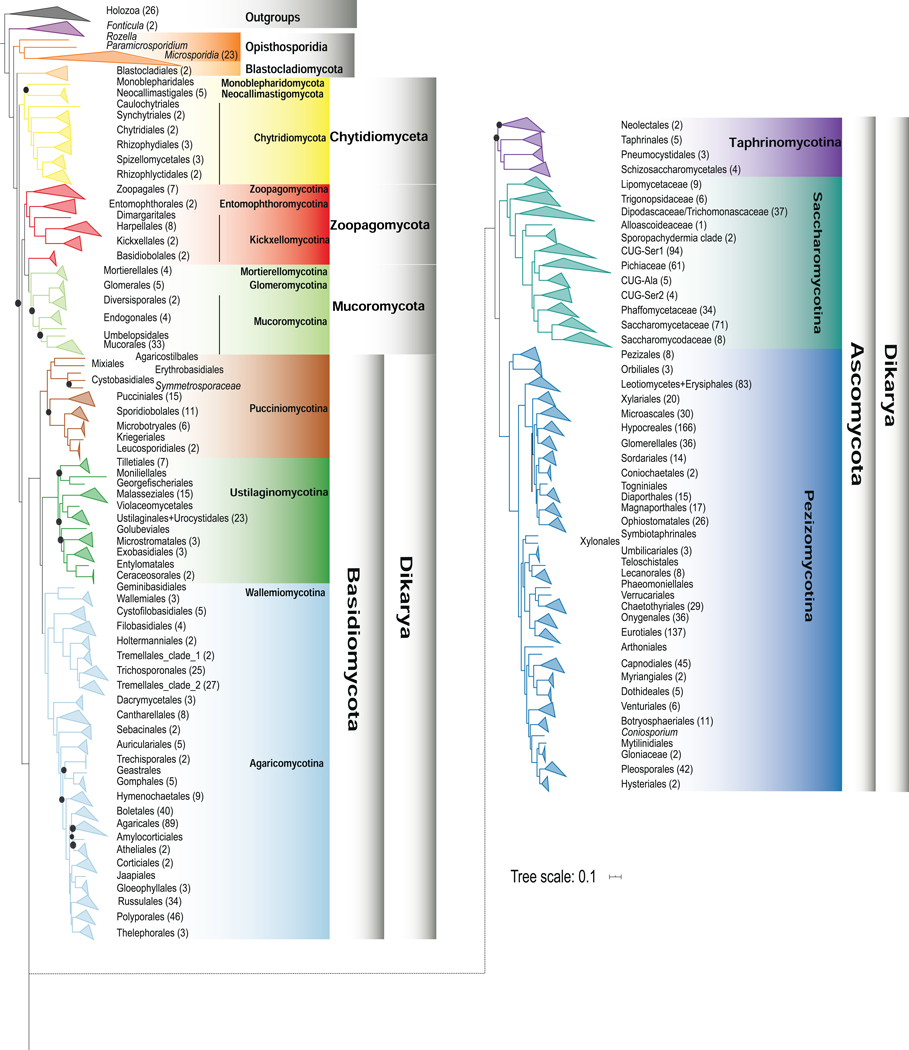
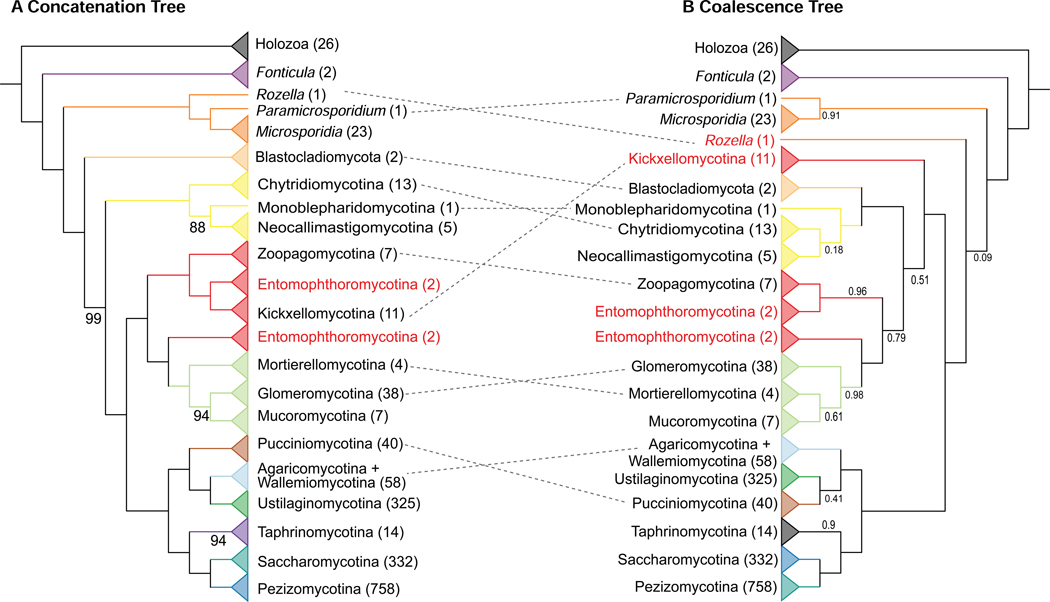
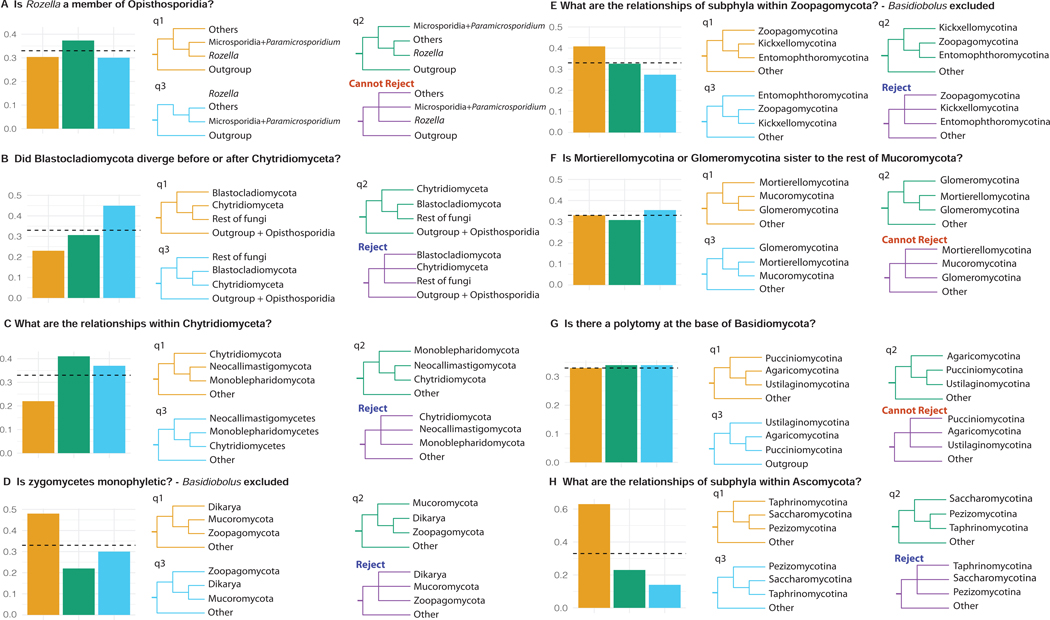
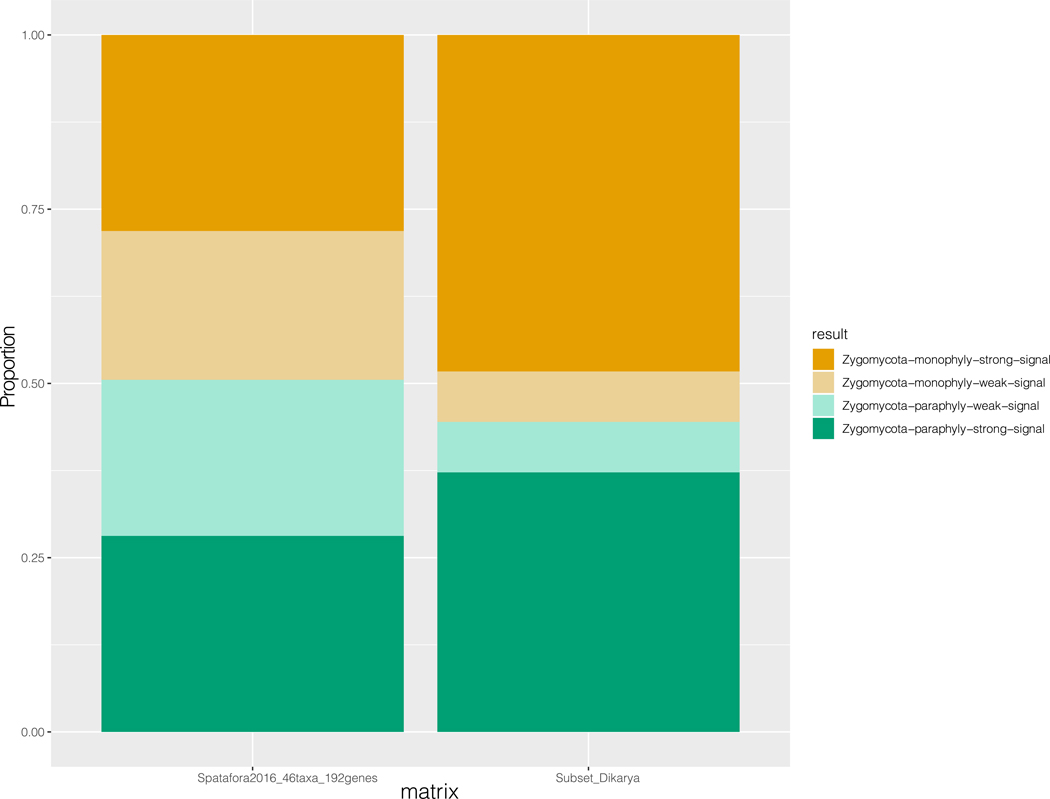
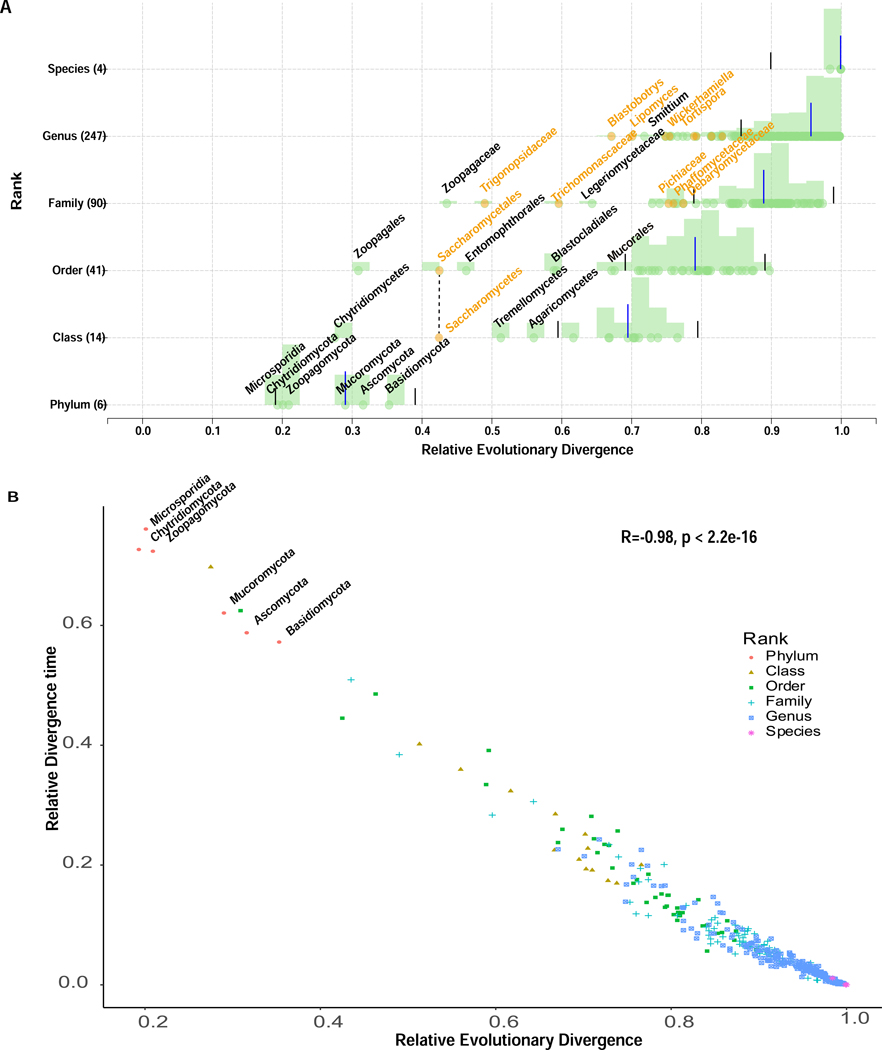
Phylogenomic studies using genome-scale amounts of data have greatly improved understanding of the tree of life. Despite the diversity, ecological significance, and biomedical and industrial importance of fungi, evolutionary relationships among several major lineages remain poorly resolved, especially those near the base of the fungal phylogeny. To examine poorly resolved relationships and assess progress toward a genome-scale phylogeny of the fungal kingdom, we compiled a phylogenomic data matrix of 290 genes from the genomes of 1,644 species that includes representatives from most major fungal lineages. We also compiled 11 data matrices by subsampling genes or taxa from the full data matrix based on filtering criteria previously shown to improve phylogenomic inference. Analyses of these 12 data matrices using concatenation- and coalescent-based approaches yielded a robust phylogeny of the fungal kingdom, in which ∼85% of internal branches were congruent across data matrices and approaches used. We found support for several historically poorly resolved relationships as well as evidence for polytomies likely stemming from episodes of ancient diversification. By examining the relative evolutionary divergence of taxonomic groups of equivalent rank, we found that fungal taxonomy is broadly aligned with both genome sequence divergence and divergence time but also identified lineages where current taxonomic circumscription does not reflect their levels of evolutionary divergence. Our results provide a robust phylogenomic framework to explore the tempo and mode of fungal evolution and offer directions for future fungal phylogenetic and taxonomic studies.

Keywords: ancient diversification; coalescence; concatenation; phylogenetic signal; phylogenomics; polytomy test; relative evolutionary divergence; taxonomy; zygomycetes.


Conflict of interest statement

Declaration of interests The authors declare no competing interests.

Figures

Figure 1.
Figure 1.. Diversity of Major Fungal Lineages
Representative species for major fungal lineages. (A) Crown coral Artomyces pyxidata (Agaricomycotina, Basidiomycota). (B) witch’s butter Tremella mesenterica (Pucciniomycotina, Basidiomycota). (C) Flowerpot parasol, Leucocoprinus birnbaumii (Agaricomycotina, Basidiomycota). (D) Pearl oyster mushroom, Pleurotus ostreatus (Agaricomycotina, Basidiomycota). (E) Snow fungus, Tremella fuciformis (Agaricomycotina, Basidiomycota). (F) Turkey tail, Trametes versicolor (Agaricomycotina, Basidiomycota). (G) Baker’s yeast Saccharomyces cerevisiae (Saccharomycotina, Ascomycota). (H) Fission yeast Schizosaccharomyces pombe (Taphrinomycotina, Ascomycota). (I) Mucor mucedo (Mucoromycotina, Mucoromycota). (J) Corn smut Ustilago maydis (Ustilaginomycotina, Basidiomycota). (K) Aspergillus oerlinghausenensis (Pezizomycotina, Ascomycota). (L) Fly agaric Amanita muscaria (Agaricomycotina, Basidiomycota). (M) Entomophthora muscae (Entomophthoromycotina, Zoopagomycota). (N) Rozella allomycis parasitizing the chytrid Allomyces. (O) Monoblepharis macrandra (Monoblepharidomycetes, Chytridiomycota). (P) Coemansia braziliensis (Kickxellomycotina, Zoopagomycota). (Q) Piptocephalis repens (Zoopagomycotina, Zoopagomycota). (R) Mortierella elongata (Mortierellomycotina, Mucoromycota). (S) Rhizopus spp. (Mucoromycotina, Mucoromycota). (T) Penicillium digitatum (Pezizomycotina, Ascomycota). A-C, E, and F Photograph courtesy of Jacob L. Steenwyk. D, G, J, L, M, S, and T Images are available to the public domain through https://commons.wikimedia.org/wiki/. H, Photograph reproduced with permission of David O. Morgan. K, Photograph courtesy of Jos Houbraken. I, Photograph courtesy of Kerry O’Donnell. N, O, Photographs courtesy of Kensuke Seto and Timothy James. P-R, Photographs courtesy of Jason Stajich. Related to Figure S1 and Data S1.
Figure 2.
Figure 2.. Genome-scale Phylogeny of 1,644 Species Spanning the Diversity of Fungi
The topology shown is derived from maximum likelihood analysis using a concatenation single-model (LG+G4) approach on the full data matrix (1,672 taxa (1,644 fungi and 28 outgroups) and 290 genes; lnL = −78287339.984). Internal branches supported with 100% ultrafast bootstrap values are not shown; those with values lower than 100% are denoted by purple dots. Termini are labeled using order-level taxonomic names from NCBI, except for in Saccharomycotina, where informal and family-level names reflecting the 12 major clades comprising this group are used . Related to Figures S3, S6 and Data S2.
Figure 3.
Figure 3.. Incongruence between Concatenation- and Coalescent-based Phylogenies of Fungi
Topologies derived from maximum likelihood analysis using (A) a concatenation single model (LG+G4) approach and (B) a coalescence approach. Numerical values below branches represent (A) ultrafast bootstrap (BS) values and (B) local posterior probabilities (LPP); unlabeled branches received 100% BS or 1.0 PP support. Termini are labeled using major lineages of fungi. Taxa in red correspond to groups inferred to be paraphyletic by the topology shown. The dashed line indicated the incongruent placements between topologies from concatenation and coalescence. Related to Figure S5 and Data S3.
Figure 4.
Figure 4.. Examination of Support among Individual Gene Tees for Alternative Hypotheses for Contentious Relationships in the Fungal Phylogeny
The gene-tree quartet frequencies (bar graphs) for alternative branching orders for contentious relationships in the fungal phylogeny. (A) Is Rozella a member of Opisthosporidia? (B) Did Blastocladiomycota diverge before or after Chytridiomyceta? (C) What are the relationships within Chytridiomyceta? (D) Is zygomycetes monophyletic? (E) What are the relationships of subphyla within Zoopagomycota? (F) Is Mortierellomycotina or Glomeromycotina sister to the rest of Mucoromycota? (G) Is there a polytomy at the base of Basidiomycota? (H) What are the relationships of subphyla within Ascomycota? Orange bars and topologies reflect the relationships inferred using a concatenation-based single model approach on the full data matrix; blue and green bars and trees correspond to the two alternative hypotheses (supported by the two alternative resolutions of each quartet). The purple tree shows whether a polytomy scenario can be rejected by the quartet analysis or not. Dashed horizontal lines mark expectation for a hard polytomy. Related to Figures S1 and S2.
Figure 5.
Figure 5.. Distribution of Phylogenetic Signal for two Alternative Hypotheses on the Zygomycetes Lineage
The two alternative hypotheses are: Mucoromycota is sister to Zoopagomycota (zygomycetes-monophyly; T1 Orange), Mucoromycota is sister to Dikarya (zygomycetes-paraphyly; T2 Green). Proportions of genes supporting each of two alternative hypotheses in the Spatafora2016_46taxa_192genes and Subset_Dikaya data matrices are shown. The GLS values for each gene in each data matrix are provided in Data S4. We considered a gene with an absolute value of log-likelihood difference of two as a gene with strong (|∆lnL| > 2) or weak (|∆lnL| < 2) phylogenetic signal. Related to Data S4.
Figure 6.
Figure 6.. Higher Level Taxonomic Ranks Generally Reflect Levels of Evolutionary Divergence across the Fungal Kingdom
(A) Relative evolutionary divergence (RED) of taxa defined by the NCBI taxonomy based on the topology inferred from the concatenation-based single model approach. Each data point (green or orange circle) represents a taxon distributed according to its RED value (x-axis) and its taxonomic rank (y-axis). Blue bars correspond to median RED values and black bars to the RED intervals (+/− 0.1) for each rank. Orange circles represent taxa belonging to the subphylum Saccharomycotina (Ascomycota), which are the most notable instance of an underclassified lineage in the fungal kingdom. Note that RED values of ranks with a single subordinate rank will be identical to each other (e.g., class Saccharomycetes contains a single order, Saccharomycetales; thus, both ranks have the same RED value). Only a subset of taxon names is shown here; results for all taxa are reported in Data S5. (B) The Pearson correlation coefficient (Pearson’s r) between the RED values and relative divergence time estimated using relaxed-molecular clock approaches for all internal nodes. The data points associated with six fungal phyla are shown for illustration purposes. Related to Data S5.

References

    1. Heitman J, Howlett BJ, Crous PW, Stukenbrock EH, James TY, and Gow NAR (2017). The Fungal Kingdom (John Wiley & Sons; ).
    1. Blackwell M. (2011). The Fungi: 1, 2, 3… 5.1 million species? Am. J. Bot 98, 426–438. - PubMed
    1. Hawksworth DL, and Lücking R. (2017). Fungal Diversity Revisited: 2.2 to 3.8 Million Species. The Fungal Kingdom, 79–95. - PMC - PubMed
    1. Lutzoni F, Nowak MD, Alfaro ME, Reeb V, Miadlikowska J, Krug M, Arnold AE, Lewis LA, Swofford DL, Hibbett D, et al. (2018). Contemporaneous radiations of fungi and plants linked to symbiosis. Nat. Commun 9, 5451. - PMC - PubMed
    1. James TY, Stajich JE, Hittinger CT, and Rokas A. (2020). Toward a Fully Resolved Fungal Tree of Life. Annu. Rev. Microbiol 74, 291–313. - PubMed

Publication types