. 2021 Apr 26;31(8):1726-1736.e4.
doi: 10.1016/j.cub.2021.01.059. Epub 2021 Feb 18.

Distinct actin-dependent nanoscale assemblies underlie the dynamic and hierarchical organization of E-cadherin

Affiliations

Distinct actin-dependent nanoscale assemblies underlie the dynamic and hierarchical organization of E-cadherin

Rumamol Chandran et al. Curr Biol. .

Abstract

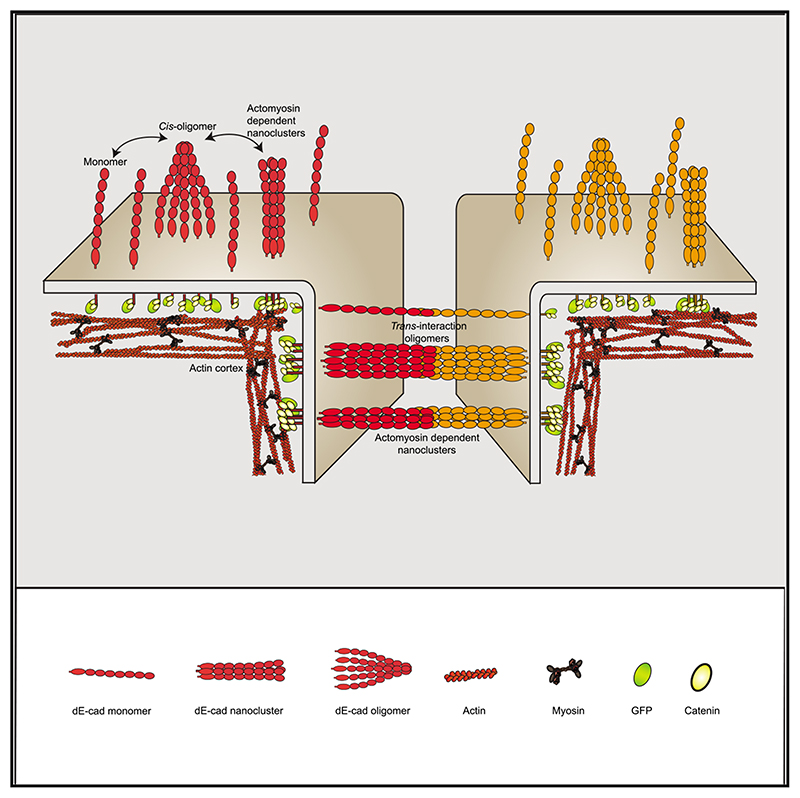
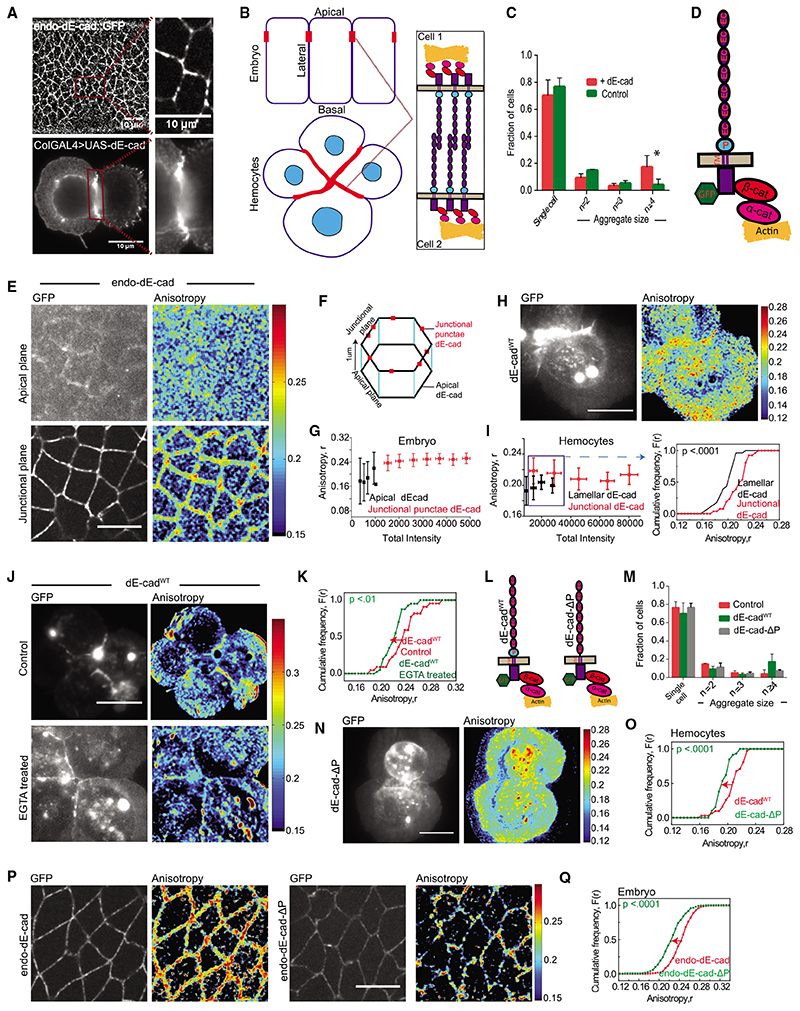
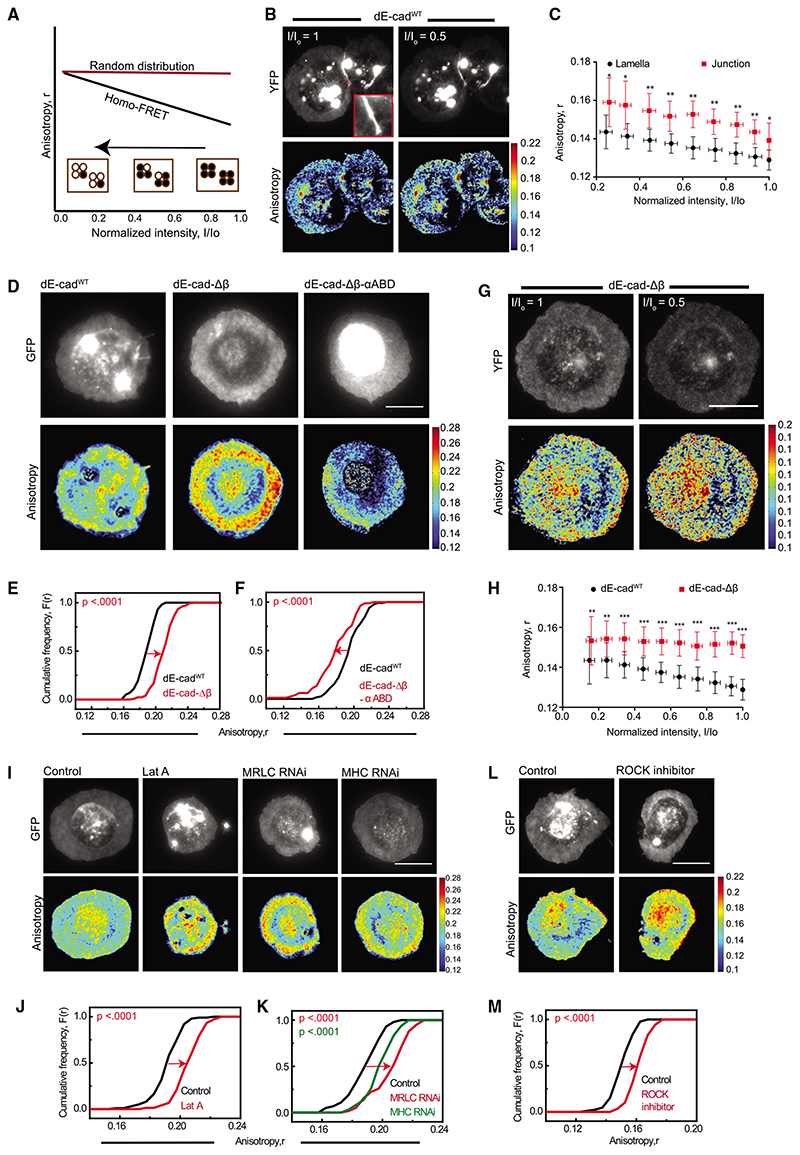
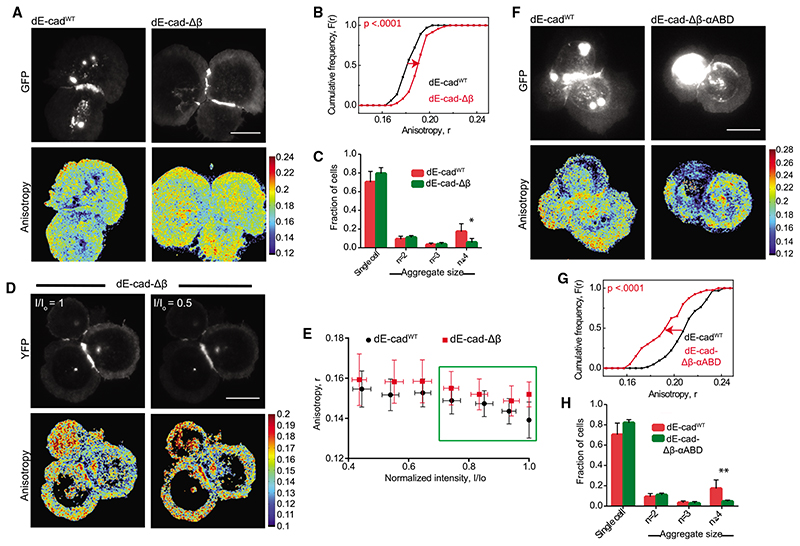
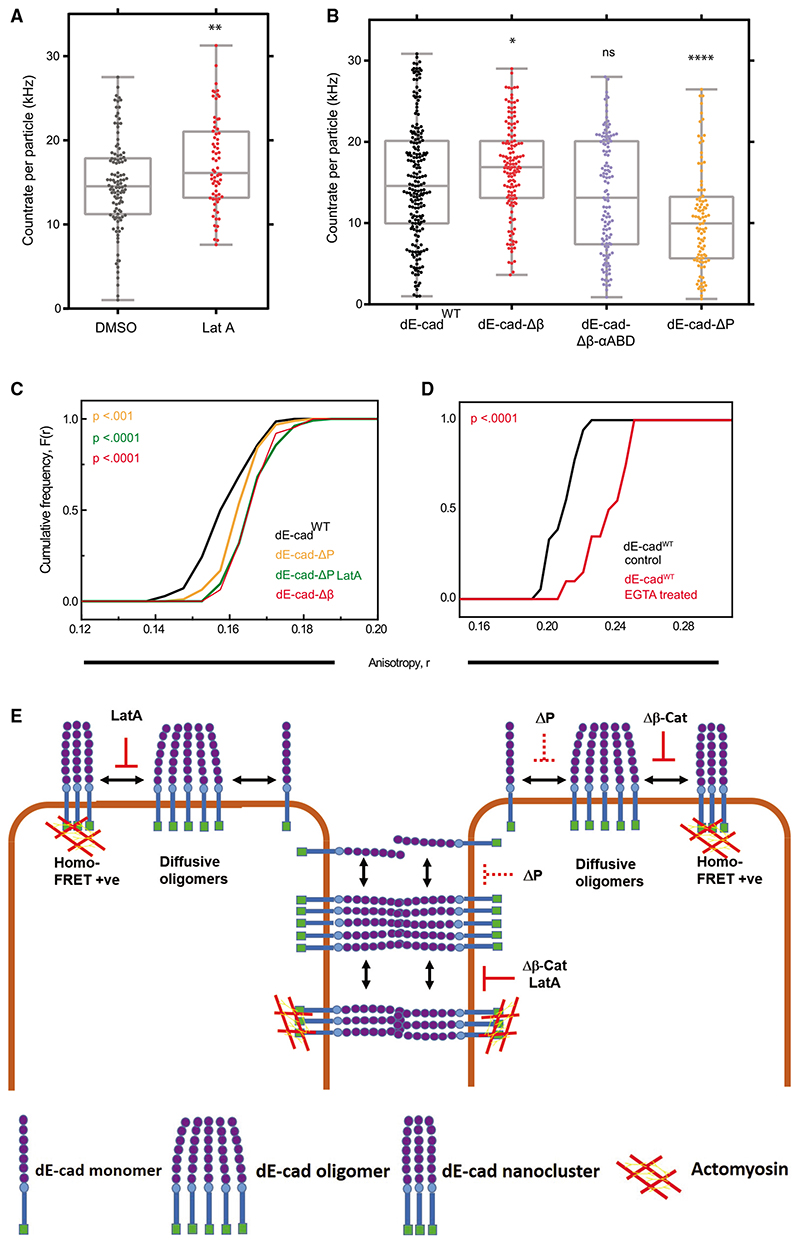
Cadherins are transmembrane adhesion proteins required for the formation of cohesive tissues.1-4 Intracellular interactions of E-cadherin with the Catenin family proteins, α- and β-catenin, facilitate connections with the cortical actomyosin network. This is necessary for maintaining the integrity of cell-cell adhesion in epithelial tissues.5-11 The supra-molecular architecture of E-cadherin is an important feature of its adhesion function; cis and trans interactions of E-cadherin are deployed12-15 to form clusters, both in cis and trans.11,16-21 Studies in Drosophila embryo have also shown that Drosophila E-cadherin (dE-cad) is organized as finite-sized dynamic clusters that localize with actin patches at cell-cell junctions, in continuous exchange with the extra-junctional pool of dE-cad surrounding the clusters.11,19 Here, we use the ectopic expression of dE-cad in larval hemocytes, which lack endogenous dE-cad to recapitulate functional cell-cell junctions in a convenient model system. We find that, while dE-cad at cell-cell junctions in hemocytes exhibits a clustered trans-paired organization similar to that reported previously in embryonic epithelial tissue, extra-junctional dE-cad is also organized as relatively immobile nanoclusters as well as more loosely packed diffusive oligomers. Oligomers are promoted by cis interactions of the ectodomain, and their growth is counteracted by the activity of cortical actomyosin. Oligomers in turn promote assembly of dense nanoclusters that require cortical actomyosin activity. Thus, cortical actin activity remodels oligomers and generates nanoclusters. The requirement for dynamic actin in the organization of dE-cad at the nanoscale may provide a mechanism to dynamically tune junctional strength.

Keywords: E-cadherin; Emmission anisotropy; FCS; actomyosin; adhesion independent nanoscale assembly; cell adhesion; homo-FRET; nanoclusters; oligomers.


Conflict of interest statement

Declaration of interests The authors declare no competing interests.

Figures

None
Graphical abstract
Figure 1
Figure 1. Nanoscale organization of dE-cad in embryo and larval hemocytes probed by homo-FRET microscopy
(A) Confocal images of dE-cad::GFP-expressing epithelial cells in an early developing embryo (left top) and dE-cad labeled using monoclonal DCAD2 in hemocytes from wandering third-instar larvae from dE-cadWT-expressing flies (left bottom); insets show magnified view of dE-cad in embryos (right top) and hemocytes (right bottom). (B) Schematic showing Drosophila embryo epithelial cells and larval hemocytes forming cell-cell junctions with a zoomed view of the trans interactions of dE-cad at the junctions. (C) Histogram showing the percentage of cells as single cells and cell aggregates in control and dE-cadWT::GFP-expressing hemocytes. Dataset contains normalized cell number from 5 control larvae and 6 dE-cadWT larvae, and the bar represents the mean and the standard deviation in each condition. (D) Schematic showing Drosophila E-cadherin and its interaction machinery. (E) Total intensity and EA images of endo-dE-cadWT::GFP in the apical and junctional plane in the early gastrulation stage of the embryo. (F) Representation of epithelial cells of the embryo showing the confocal planes at which apical and junctional EA measurements are taken. (G) Intensity versus EA plots of endo-dE-cad in the apical and junctional plane from similar stage embryos (n = 5). (H and I) Total intensity and anisotropy images (H) of dE-cadWT::GFP-expressing hemocytes from wandering third-instar Drosophila larvae, scatterplot (I; left graph) of intensity versus EA values and cumulative frequency distribution of EA values (I; right graph) of lamellar, and junctional dE-cadWT of similar intensity range in the scatterplot (boxed area). Smooth lines indicate data obtained from the lamellar localized proteins, whereas line with square symbols indicates junctional localization. (J and K)Total intensity and EA images(J) and cumulative frequency distributions of EA values (K) of junctional dE-cadWT::GFP of similar intensity ranges in control and EGTA-treated conditions. (L) Schematic of dE-cadWT::GFP and dE-cad-ΔP::GFP proteins. (M) Histogram showing the percentage of cells as single cells and cell aggregates in control and dE-cadWT::GFP- and dE-cad-ΔP::GFP-expressing hemocytes. Dataset contains normalized cell number from 5 control larvae, 6 dE-cadWT larvae, and 4 dE-cad-DP larvae, and the bar represents the mean and the standard deviation in each condition. (N and O) Total intensity and EA images (N) and cumulative frequency distributions (O) of junctional EA values of dE-cadWT- and dE-cad-DP-expressing hemocytes. (P and Q) Total intensity and EA images (P) and cumulative frequency distributions of EA values (Q) of junctional dE-cad obtained from endo-dE-cad::GFP- and endo-dE-cad-ΔP::GFP-expressing embryos as indicated where 5 embryos each were analyzed for endo-dE-cad endo-dE-cad-DP-expressing animals. Error bars depict standard deviation. p values are calculated using Mann-Whitney U test. ns (not significant), p > 0.05; *p < 0.05; **p < 0.01; ***p < 0.001. Scale bars, 10 μm. Sample size is provided in Table S1. See also Figure S1.
Figure 2
Figure 2. Adaptor complex and actomyosin activity organizes lamellar dE-cad
(A) Schematic of the photobleaching assay shows the effect of photobleaching on EA where there are a fraction of nanoclusters and monomers initially present (black line) versus when there are no nanoclusters present (red line). A typical photobleaching profile of the EA versus normalized intensity of fluorescent molecules is shown where EA values of regions of interest (ROIs) are plotted against the intensity values, normalized to the starting total intensity value of ROI. Filled circles depict molecules that fluoresce and open circles bleached fluorophores. (B) Total intensity and EA images of dE-cadWT::YFP-expressing cells at the beginning of photobleaching and at 50% photobleaching. Inset showed the zoomedin view of the junction marked in the cell. (C) Intensity versus EA plots of lamellar and junctional dE-cad in dE-cadWT-expressing cells show changes in EA values upon photo bleaching. Each data point represents average EA values taken from multiple regions from cells(n = 9 [lamella] and 5 [junction])for the corresponding intensity bins normalized to the starting intensity value. Error bars represent standard deviations. (D–F) Total intensity and EA images (D) of dE-cadWT::GFP-(left), dE-cad-Δβ::GFP-(middle), and dE-cad-Δβ-αABD::GFP (right)-expressing hemocytes and cumulative frequency distributions of lamellar EA values of dE-cadWT-compared to dE-cad-Δβ- (E) and to dE-cad-Δβ-αABD (F)-expressing hemocytes. (G and H) Total intensity and EA images (G) of dE-cad-Δβ::YFP-expressing cells at the beginning of photobleaching and at 50% photobleaching and intensity versus EA plots (H) of dE-cadWT::YFP- (as shown in C, lamella above) and dE-cad-Δβ::YFP-expressing cells depicting changes in EA values upon photobleaching. Error bars represent standard deviations. (I–K) Total intensity and EA images (I) of dE-cadWT::GFP in control, Lat-A-treated, and MRLC RNAi- and MHC RNAi-expressing cells and corresponding cumulative frequency distributions (J and K) of EA values of lamellar dE-cadWT::GFP. (L and M) Total intensity and EA images (L) of dE-cadWT::GFP in control and ROCK-inhibitor-treated hemocytes and corresponding cumulative frequency distributions of EA values (M). p values are calculated using Mann-Whitney U test. ns, p > 0.05; *p < 0.05; **p < 0.01; ***p < 0.001. Scale bars, 10 μm. Sample size is provided in Table S1. See also Figure S2.
Figure 3
Figure 3. Adaptor protein-dependent clustering of junctional dE-cad
(A and B) Total intensity and EA images (A) of dE-cadWT::GFP- and dE-cad-Db::GFP-expressing hemocytes and corresponding cumulative frequency distributions (B) of EA values of junctional dE-cad. (C) Histogram showing percentage of cell aggregates in dE-cadWT::GFP- and dE-cad-Db::GFP-expressing cells. Data points show average normalized cell number from 6 dE-cadWT larvae and 7 dE-cad-Db larvae. Error bar represents the standard deviation in each condition. (D and E) Total intensity and EA images (D) of dE-cadWT::YFP- and dE-cad-Δβ::YFP-expressing cells at the beginning of photo bleaching and at 50% photobleaching and corresponding normalized intensity versus EA plots (E) of junctional dE-cad obtained upon photobleaching. Each data point represents average EA values taken from multiple regions of different junctions (n = 5 [dE-cadWT and 4 [dE-cad-Δβ]). Error bars show standard deviation for the corresponding intensity bins normalized to the starting intensity value. (F and G) Total intensity and EA images (F) of dE-cadWT::GFP- and dE-cad-Δβ-αABD::GFP-expressing hemocytes and corresponding cumulative frequency distributions (G) of EA values. (H) Histogram showing percentage of cell aggregates in dE-cadWT::GFP- and dE-cad-Δβ-αABD::GFP-expressing cells. Dataset contains average normalized cell number from 6 dE-cadWT larvae and 5 dE-cad-Δβ-αABD larvae. Error bar represents the mean and the standard deviation in each condition. p values are calculated using Mann-Whitney U test. Scale bars, 10 μm. Sample size is provided in Table S1. See also Figure S3.
Figure 4
Figure 4. Analysis of E-cadherin oligomerization
(A) Brightness distribution of dE-cadWT oligomers in the lamella of dE-cadWT::GFP-expressing cells treated with DMSO or Lat A. Parameters, such as the number of diffusing species and diffusion timescales estimated through related FCS analysis, are detailed in Figure S4 and Data S2. (B) Brightness distribution of oligomers of various GFP-tagged constructs of dE-cad in the lamella of cells expressing these constructs. Parameters, such as the number of diffusing species and diffusion timescales estimated via related FCS analysis, are detailed in Figure S4 and Data S3. (C) Cumulative frequency distributions of EA values of lamellar dE-cad in dE-cadWT-, dE-cad-ΔP-, and dE-cad-Δβ-expressing hemocytes. (D) Cumulative frequency distributions of EA values of lamellar dE-cadWT::GFP of similar intensity range in control and EGTA-treated conditions. (E) Schematic model for the formation of cis oligomers and actomyosin-sensitive nanoscale clusters of dE-cad at the lamellar membrane or trans oligomers and nanoclusters at cell-cell junctions under different conditions. Solid red line indicates complete loss, and dashed red line indicates partial loss of nanoclustering or oligomerization. p values are calculated using Mann-Whitney U test. ns, p > 0.05; *p < 0.05; **p < 0.01; ***p < 0.001; ****p < 0.0001. Sample size is provided in Table S1. See also Figure S4 and Data S1, S2, and S3.

References

    1. Oda H, Tsukita S, Takeichi M. Dynamic behavior of the cad-herin-based cell-cell adhesion system during Drosophila gastrulation. Dev Biol. 1998;203:435–450. - PubMed
    1. Tepass U, Gruszynski-DeFeo E, Haag TA, Omatyar L, Török T, Hartenstein V. shotgun encodes Drosophila E-cadherin and is preferentially required during cell rearrangement in the neurectoderm and other morphogenetically active epithelia. Genes Dev. 1996;10:672–685. - PubMed
    1. Niewiadomska P, Godt D, Tepass U. DE-cadherin is required for intercellular motility during Drosophila oogenesis. J Cell Biol. 1999;144:533–547. - PMC - PubMed
    1. Uemura T, Oda H, Kraut R, Hayashi S, Kotaoka Y, Takeichi M. Zygotic Drosophila E-cadherin expression is required for processes of dynamic epithelial cell rearrangement in the Drosophila embryo. Genes Dev. 1996;10:659–671. - PubMed
    1. Halbleib JM, Nelson WJ. Cadherins in development: cell adhesion, sorting, and tissue morphogenesis. Genes Dev. 2006;20:3199–3214. - PubMed

Publication types

LinkOut - more resources