. 2021 Jan-Jun:296:100422.
doi: 10.1016/j.jbc.2021.100422. Epub 2021 Feb 17.

Discovery of a novel lactate dehydrogenase tetramerization domain using epitope mapping and peptides

Affiliations

Discovery of a novel lactate dehydrogenase tetramerization domain using epitope mapping and peptides

Léopold Thabault et al. J Biol Chem. 2021 Jan-Jun.

Abstract

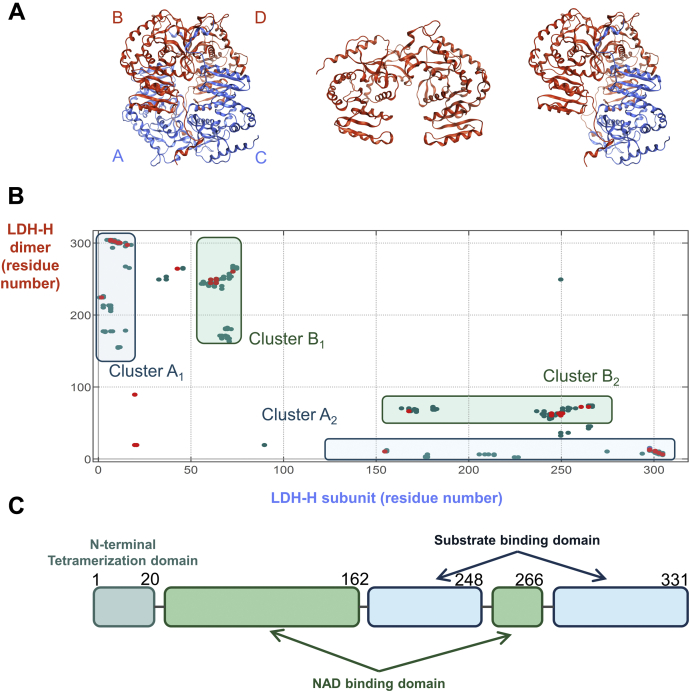
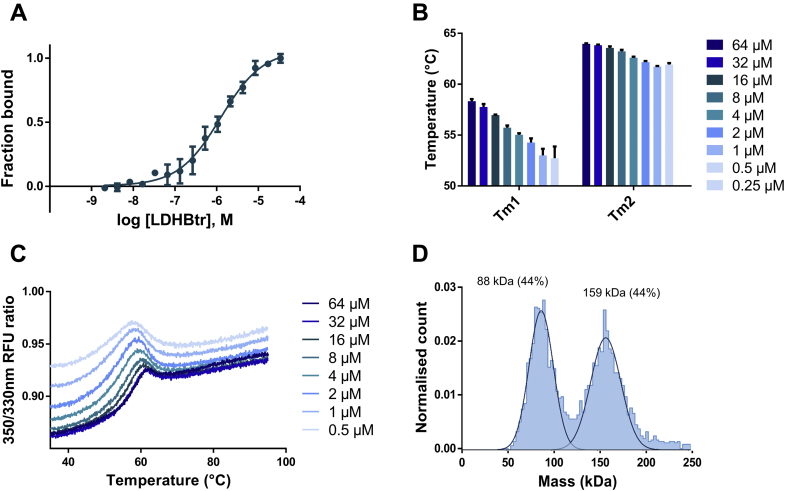
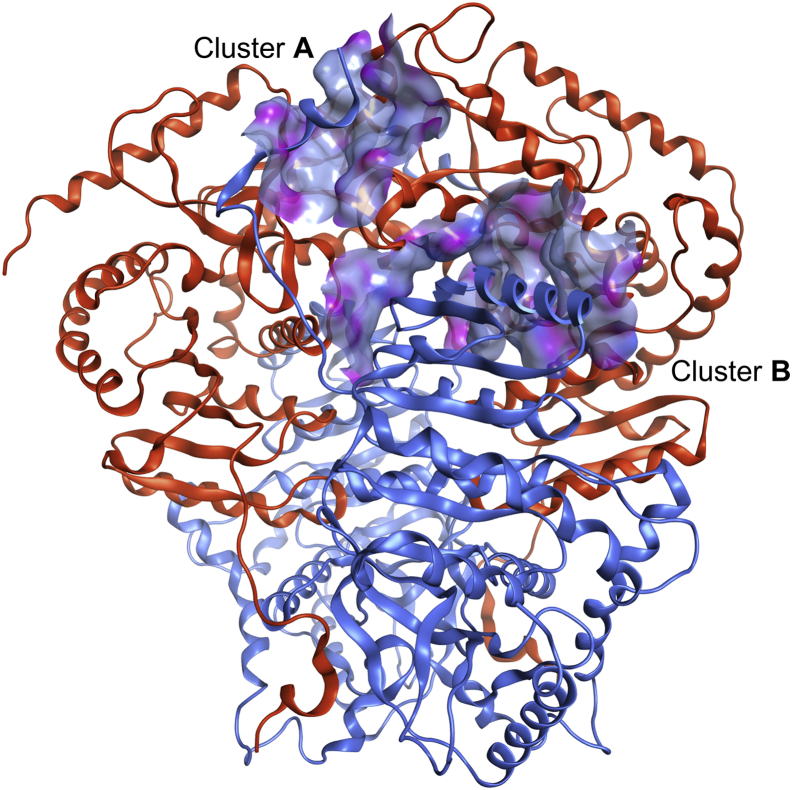
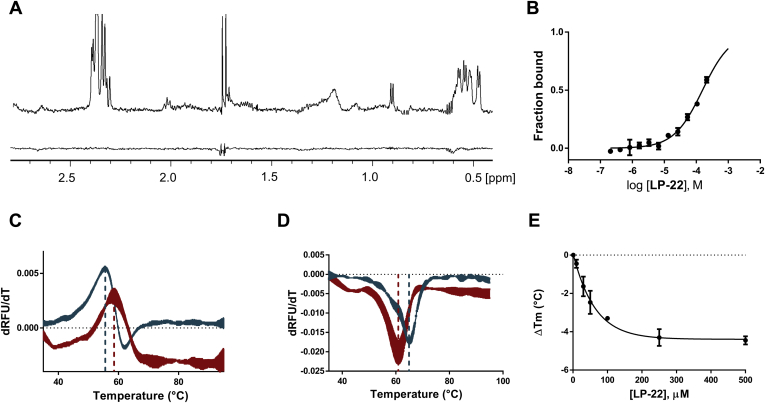
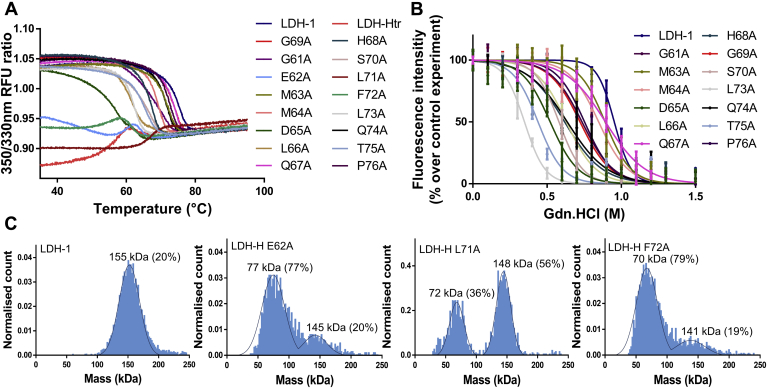
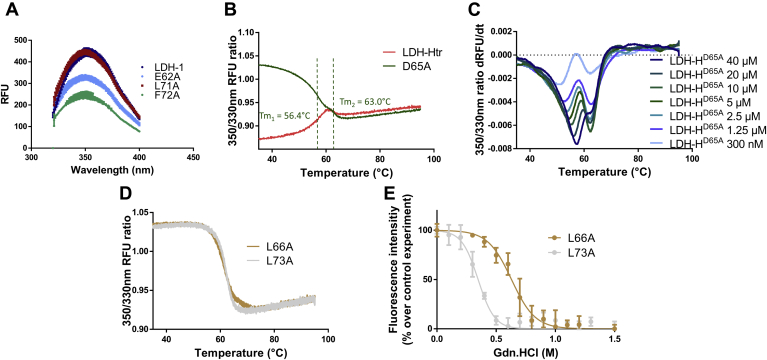
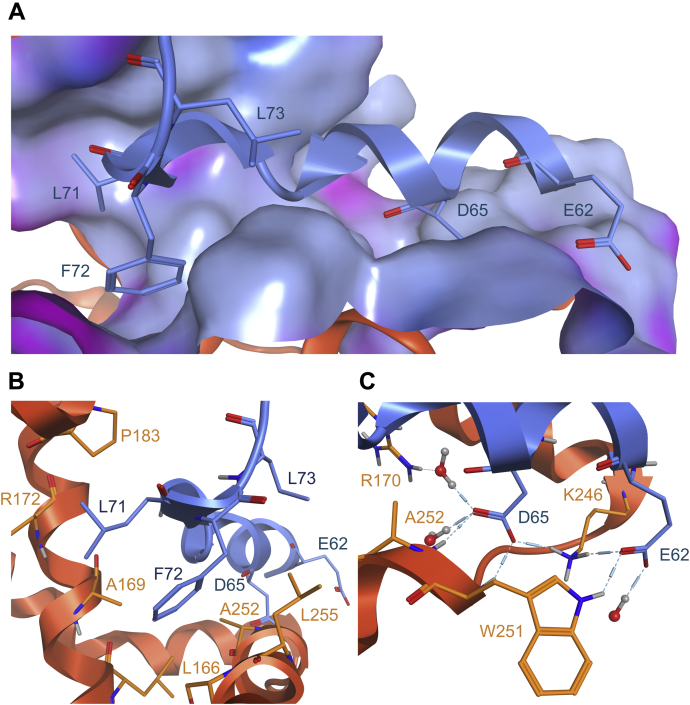
Despite being initially regarded as a metabolic waste product, lactate is now considered to serve as a primary fuel for the tricarboxylic acid cycle in cancer cells. At the core of lactate metabolism, lactate dehydrogenases (LDHs) catalyze the interconversion of lactate to pyruvate and as such represent promising targets in cancer therapy. However, direct inhibition of the LDH active site is challenging from physicochemical and selectivity standpoints. However, LDHs are obligate tetramers. Thus, targeting the LDH tetrameric interface has emerged as an appealing strategy. In this work, we examine a dimeric construct of truncated human LDH to search for new druggable sites. We report the identification and characterization of a new cluster of interactions in the LDH tetrameric interface. Using nanoscale differential scanning fluorimetry, chemical denaturation, and mass photometry, we identified several residues (E62, D65, L71, and F72) essential for LDH tetrameric stability. Moreover, we report a family of peptide ligands based on this cluster of interactions. We next demonstrated these ligands to destabilize tetrameric LDHs through binding to this new tetrameric interface using nanoscale differential scanning fluorimetry, NMR water-ligand observed via gradient spectroscopy, and microscale thermophoresis. Altogether, this work provides new insights on the LDH tetrameric interface as well as valuable pharmacological tools for the development of LDH tetramer disruptors.

Keywords: NMR; WaterLOGSY; biophysics; cancer; disruptors; lactate dehydrogenases; mass photometry; microscale thermophoresis; nanoDSF; oligomerization; protein–protein interaction.


Conflict of interest statement

Conflict of interest The authors declare the following competing financial interest(s): L. T., L. B., P. S., and R. F. are inventors of European Patent Application EP19172347.7, LDH inhibitor polypeptides for use in treatment of cancer; L. T., M. L., P. S., and R. F. are inventors of European Patent Application EP21154636.1, polypeptide inhibitors of LDH activity for use in cancer therapy. The authors declare no other conflicts of interest.

Figures

Figure 1
Figure 1
Interaction mapping of LDH-H tetrameric interface highlights two main clusters.A, Left, X-ray crystallographic structure of LDH-1 (LDH-H4) as a dimer of dimers with the two dimers colored differently (subunits A and C as well as B and D). Middle, model of dimeric LDH-Htr. Right, model of dimeric LDH-H interacting with a single LDH-H subunit used to highlight LDH tetrameric interface (Protein Data Bank ID: 1I0Z). B, mapping of the interaction between an LDH-H subunit (C) and LDH-1 tetrameric interface (dimer B–D) using the Molecular Operating Environment software. The x-axis and y-axis represent the residue numbers of dimers B to D and subunit C, respectively. This mapping identifies two clusters of interaction, clusters A and B. C, representation of the different domains of native LDH-1 (UniProt: P07195). Residue numbers are scaled to x-axis (B). LDH-1, lactate dehydrogenase heart isozyme homotetramer; LDH-H, lactate dehydrogenase heart isozyme; LDH-Htr, lactate dehydrogenase heart isozyme truncated.
Figure 2
Figure 2
LDH-Htr behaves as a weak tetramer.A, evaluation of LDH-Htr self-interaction using microscale thermophoresis at a 20 s “on time” (n = 3) (Kd = 1.25 μM [0.96–1.62 μM]). B, evaluation by nanoscale differential scanning fluorimetry (nanoDSF) of the impact of LDH-Htr melting temperature depending on its subunit concentration (n = 3). Tm1 and Tm2 refer to the two transitions observed for LDH-Htr denaturation pattern. C, nanoDSF profile of LDH-Htr at various concentrations (n = 3). RFU, relative fluorescent unit. D, mass photometry of LDH-Htr with the calculated molecular weights of the complex in solution and their relative intensity indicated above the peaks (theoretical molecular weight of the dimer is 73.2 kDa). LDH-Htr, lactate dehydrogenase heart isozyme truncated.
Figure 3
Figure 3
Structural representation of LDH tetrameric interface shows that cluster B1continuous epitope is a long α-helix. Representation of clusters A1 and B1 (blue, ribbon) interacting with clusters A2 and B2 (orange, surface). The surface corresponds to the molecular surface of LDH-H clusters A2 and B2 colored by lipophilicity (gray blue: lipophilic; pink: hydrophilic). This representation was generated from the LDH-1 crystallographic structure and further minimized using Molecular Operating Environment software (Protein Data Bank ID: 1I0Z). LDH, lactate dehydrogenase; LDH-1, lactate dehydrogenase heart isozyme homotetramer; LDH-H, lactate dehydrogenase heart isozyme.
Figure 4
Figure 4
Peptide LP-22 interacts at the LDH tetrameric interface, destabilizes tetrameric LDH, and stabilizes dimeric LDH.A, WaterLOGSY spectra of the interaction of LP-22 (400 μM) with dimeric LDH-Htr (up) and tetrameric LDH-1 (down) at 15 μM. B, MST binding curves between LP-22 and LDH-Htr. Binding curves were extracted from the MST traces at a 1.5 s MST on time (n = 3). C, nanoDSF denaturation of dimeric LDH-Htr (15 μM) with (red) and without (teal) LP-22 (500 μM) (ΔTm = 2.8 °C; n = 3). D, nanoDSF denaturation of tetrameric LDH-5 (300 nM) with (red) and without (teal) LP-22 (250 μM) (ΔTm = −4.3 °C; n = 3). E, ΔTm (°C) of tetrameric LDH-5 (300 nM) as a function of LP-22 concentration (EC50 = 47 μM [32–68 μM]; n = 3). LDH, lactate dehydrogenase; LDH-1, lactate dehydrogenase heart isozyme homotetramer; LDH-5, lactate dehydrogenase muscle isozyme homotetramer; LDH-Htr, LDH-H truncated; LP-22, cluster B1-derived peptide; MST, microscale thermophoresis; nanoDSF, nanoscale differential scanning fluorimetry; RFU, relative fluorescent unit; WaterLOGSY, water–ligand observed via gradient spectroscopy.
Figure 5
Figure 5
LP-22 N-terminal trimming leads to GP-16 with a similar interaction profile.A, comparison of the difference between LP-22 (up) and GP-16 (bottom) WaterLOGSY (red) and 1H (black) NMR spectra in the presence of 15 μM of LDH-Htr. Signals that appear in the 1H spectra but not in WaterLOGSY correspond to noninteracting residues. LP-22 spectra highlight that some lysine (blue), glutamate (red), aspartate (red), and leucine (green) residues do not interact with LDH-Htr. These noninteracting signals are no longer present on the GP-16 spectra (down). B, peptide sequence of LP-22. Colored residues correspond to the residues that do not interact according to ΔG calculation and WaterLOGSY analysis. C, calculation of LP-22 residue contribution to the overall free energy of binding using the Molecular Operating Environment software. D, differences in melting temperature (ΔTm, °C) of tetrameric LDH-5 (300 nM) as a function of GP-16 concentration (EC50 = 262 μM [142–383 μM]; n = 3). LDH-5, lactate dehydrogenase muscle isozyme homotetramer; LDH-Htr, LDH-H truncated; LP-22, cluster B1-derived peptide; WaterLOGSY, water–ligand observed via gradient spectroscopy.
Figure 6
Figure 6
Mutations of cluster B1unravel key residues for LDH tetramerization.A, screening of LDH-H variants using nanoDSF. Changes in the 350/330 nm fluorescence emission indicate blue or red shifts and are representative of unfolding events (n = 6). B, dissociation of the homotetrameric form of LDH-H and of its variants at 50 μg/ml (1.3 μM) upon addition of guanidinium·hydrochloride. Tryptophan fluorescence intensity was followed at λexc = 286 nm and λem = 350 nm as a direct reporter of LDH-1 tetrameric integrity (n = 6) (49). C, mass photometry was performed for different LDH-H variants with the experimental molecular weights of the complexes in solution and their relative intensities. Theoretical molecular weight of the tetramer = 155 kDa; theoretical molecular weight of the dimer = 78 kDa. Profiles of the other variants can be found in Fig. S4. λem, wavelength of emission; λexc, wavelength of excitation; LDH, lactate dehydrogenase; LDH-1, lactate dehydrogenase heart isozyme homotetramer; LDH-H, lactate dehydrogenase heart isozyme; nanoDSF, nanoscale differential scanning fluorimetry; RFU, relative fluorescent unit.
Figure 7
Figure 7
The exploitation of orthogonal methods highlights the impact of key mutations on LDH-H tetrameric stability.A, tryptophan fluorescence spectra of different LDH-H variants (1.3 μM). λexc = 286 nm (n = 6). B, nanoDSF profiles of LDH-HD65A and LDH-Htr (n = 6). C, nanoDSF profile of LDH-HD65A at different concentrations. Data are represented as the derivative of the 350/330 nm fluorescence ratio to highlight the apparition of the second unfolding event (n = 3). D, nanoDSF profiles of LDH-HL66A and LDH-HL73A (n = 6). E, fluorescence intensity of tetrameric LDH-HL66A and LDH-HL73A at 50 μg/ml (1.3 μM) upon addition of guanidinium·hydrochloride (n = 6). λexc, wavelength of excitation; LDH-H, lactate dehydrogenase heart isozyme; LDH-Htr, LDH-H truncated; nanoDSF, nanoscale differential scanning fluorimetry; RFU, relative fluorescent unit.
Figure 8
Figure 8
Structural model of the interaction between cluster B1hot spots and cluster B2.A, interaction of the sequence corresponding to peptide GP-16 with cluster B2. The surface corresponds to the molecular surface of LDH-H cluster B2 colored for lipophilicity (gray blue: lipophilic; pink: hydrophilic). B, focus on the hydrophobic hot spot of cluster B1 with the interaction made by L71, F72, and L73 (blue) with cluster B2 (orange). C, focus on the hydrophilic hot spot of cluster B1 with the interaction made by D65 and E62 (blue) with cluster B2 (orange). This representation was isolated from the LDH-1 crystallographic structure and further minimized using the Molecular Operating Environment software (Protein Data Bank ID: 1I0Z). LDH-1, lactate dehydrogenase heart isozyme homotetramer; LDH-H, lactate dehydrogenase heart isozyme.

References

    1. Pavlova N.N., Thompson C.B. The emerging hallmarks of cancer metabolism. Cell Metab. 2016;23:27–47. - PMC - PubMed
    1. Otto Warburg B., Wind F., Negelein N. The metabolism of tumours in the body. J. Gen. Physiol. 1927;8:519–530. - PMC - PubMed
    1. San-Millán I., Brooks G.A. Reexamining cancer metabolism: Lactate production for carcinogenesis could be the purpose and explanation of the Warburg effect. Carcinogenesis. 2017;38:119–133. - PMC - PubMed
    1. de Saedeleer C.J., Copetti T., Porporato P.E., Verrax J., Feron O., Sonveaux P. Lactate activates HIF-1 in oxidative but not in Warburg-phenotype human tumor cells. PLoS One. 2012;7 - PMC - PubMed
    1. Beckert S., Farrahi F., Aslam R.S., Scheuenstuhl H., Königsrainer A., Hussain M.Z., Hunt T.K. Lactate stimulates endothelial cell migration. Wound Repair Regen. 2006;14:321–324. - PubMed

Publication types

MeSH terms