. 2021 Feb 19;19(1):36.
doi: 10.1186/s12915-021-00968-8.

Assessing optimal: inequalities in codon optimization algorithms

Affiliations

Assessing optimal: inequalities in codon optimization algorithms

Matthew J Ranaghan et al. BMC Biol. .

Abstract

Background: Custom genes have become a common resource in recombinant biology over the last 20 years due to the plummeting cost of DNA synthesis. These genes are often "optimized" to non-native sequences for overexpression in a non-native host by substituting synonymous codons within the coding DNA sequence (CDS). A handful of studies have compared native and optimized CDSs, reporting different levels of soluble product due to the accumulation of misfolded aggregates, variable activity of enzymes, and (at least one report of) a change in substrate specificity. No study, to the best of our knowledge, has performed a practical comparison of CDSs generated from different codon optimization algorithms or reported the corresponding protein yields.

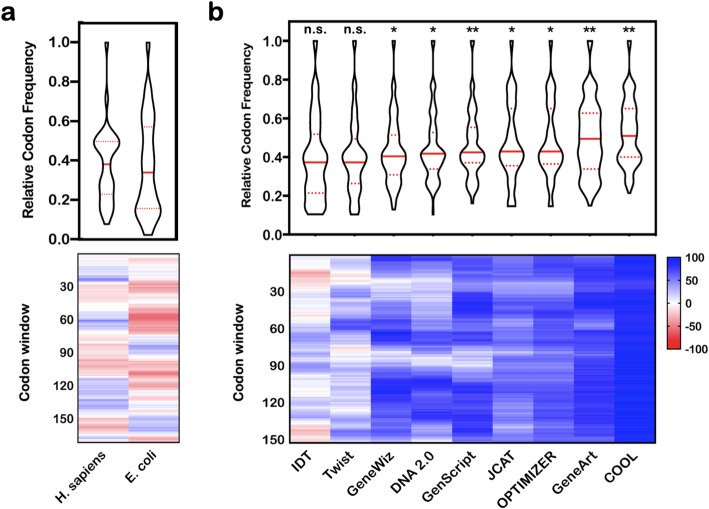
Results: In our efforts to understand what factors constitute an optimized CDS, we identified that there is little consensus among codon-optimization algorithms, a roughly equivalent chance that an algorithm-optimized CDS will increase or diminish recombinant yields as compared to the native DNA, a near ubiquitous use of a codon database that was last updated in 2007, and a high variability of output CDSs by some algorithms. We present a case study, using KRas4B, to demonstrate that a median codon frequency may be a better predictor of soluble yields than the more commonly utilized CAI metric.

Conclusions: We present a method for visualizing, analyzing, and comparing algorithm-optimized DNA sequences for recombinant protein expression. We encourage researchers to consider if DNA optimization is right for their experiments, and work towards improving the reproducibility of published recombinant work by publishing non-native CDSs.

Keywords: %MinMax; Algorithm; Codon optimization; Codon usage; KRas4B; Violin plot.


Conflict of interest statement

The authors declare no conflicts of interest.

Figures

Fig. 1
Fig. 1
Normalized histogram of structures from the RCSB Protein Databank (PDB) for recombinant proteins from Homo sapiens by mammalian (black), insect (gray), and E. coli (white) expression systems
Fig. 2
Fig. 2
Heat map of the relative codon frequencies for E. coli grouped by amino acid. a Values from Sharp and Li (1986). The authors binned their datasets (see Table 1) into four groups as shown in the figure. An “X” represents no available data for the codon. b Codon distributions for various codon usage databases or datasets described in Table 1. Data for Dong et al. are from the growth rate at 2.5 h−1
Fig. 3
Fig. 3
Comparison of the DNA sequences of KRas4B as a function of the relative codon profiles. a Violin plot (top) and %MinMax heat map (bottom) of the native CDS (a.a. 1–188) using the codon usage frequencies for H. sapiens or E. coli. b Violin (top) and %MinMax plots (bottom) for KRas4B CDSs (a.a. 1–169) optimized for expression in E. coli. Statistical significance was determined with a Mann-Whitney-Wilcox rank-sum test: n.s., no significance; *p < 1E−02, **p < 1E−05
Fig. 4
Fig. 4
Relationship between soluble proteins yields of KRas4B (a.a. 1–169) with calculated values for a CAI or b median codon frequency of the CDS. The trendline (solid) is shown with limits for 95% confidence intervals (dotted)
Fig. 5
Fig. 5
Heat map profiles of proteins optimized by the algorithm from either Algorithm 1 (left) or 2 (right). The codon usage profile of the native sequence (N) was determined with frequencies from H. sapiens and the 10 replicates (numbered 1 through 10) were done with frequencies for E. coli
Fig. 6
Fig. 6
Percentage of codon identity for pairwise alignment of ten DNA sequences optimized by resubmission of the native DNA to a particular optimization algorithm. DNA sequences were from 0.5–3.3 kb. The gray region represents the limits for a random reverse translation for the three different protein sequences (n = 100 for each data set)

References

    1. Parret A, Besir H, Meijers R. Critical reflections on synthetic gene design for recombinant protein expression. Curr Opin Struct Biol. 2016;38:155–162. doi: 10.1016/j.sbi.2016.07.004. - DOI - PubMed
    1. Rosano G, Morales ES, Ceccarelli EA. New tools for recombinant protein production in Escherichia coli: a 5-year update. Protein Sci. 2019;28:1412–22. - PMC - PubMed
    1. Sivashanmugam A, Murray V, Cui C, Zhang Y, Wang J, Li Q. Practical protocols for production of very high yields of recombinant proteins using Escherichia coli. Protein Sci. 2009;18:936–48. - PMC - PubMed
    1. Studier FW. Protein production by auto-induction in high density shaking cultures. Protein Expr Purif. 2005;41:207–234. doi: 10.1016/j.pep.2005.01.016. - DOI - PubMed
    1. Paraskevopoulou V, Falcone FH. Polyionic tags as enhancers of protein solubility in recombinant protein expression. Microorganisms. 2018;6:e20047. - PMC - PubMed

Publication types