. 2021 Feb 19;13(1):49.
doi: 10.1186/s13195-021-00785-9.

Data-driven FDG-PET subtypes of Alzheimer's disease-related neurodegeneration

Affiliations

Data-driven FDG-PET subtypes of Alzheimer's disease-related neurodegeneration

Fedor Levin et al. Alzheimers Res Ther. .

Abstract

Background: Previous research has described distinct subtypes of Alzheimer's disease (AD) based on the differences in regional patterns of brain atrophy on MRI. We conducted a data-driven exploration of distinct AD neurodegeneration subtypes using FDG-PET as a sensitive molecular imaging marker of neurodegenerative processes.

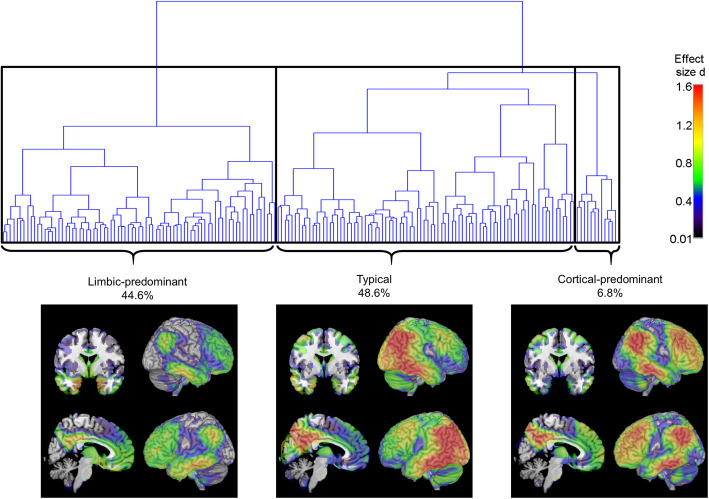
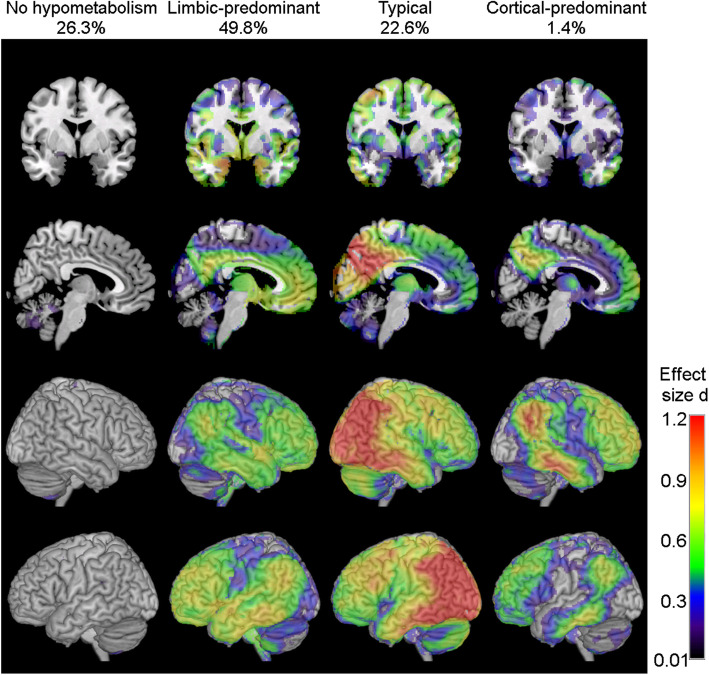
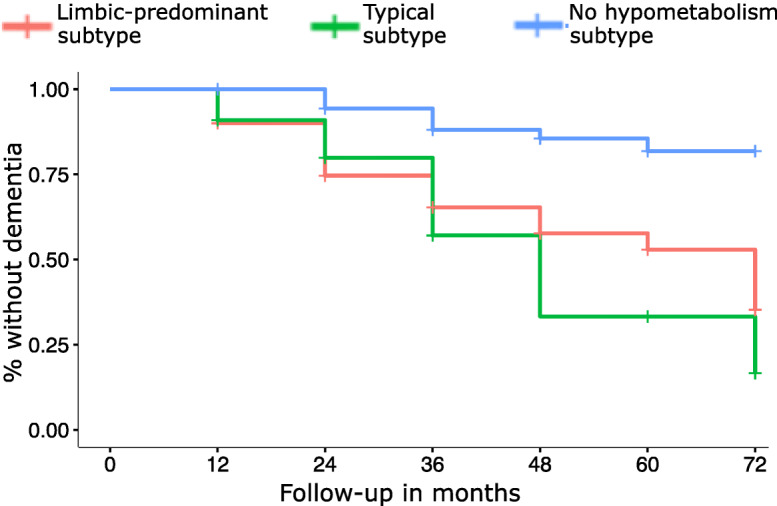
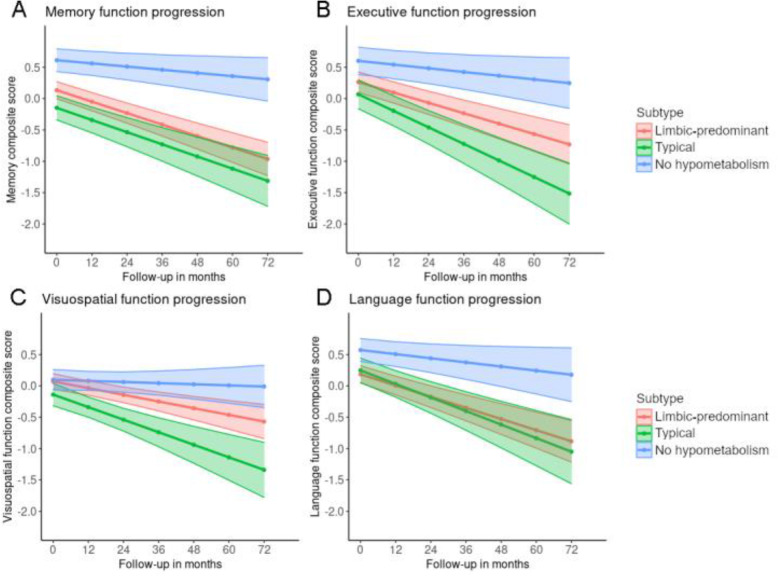
Methods: Hierarchical clustering of voxel-wise FDG-PET data from 177 amyloid-positive patients with AD dementia enrolled in the Alzheimer's Disease Neuroimaging Initiative (ADNI) was used to identify distinct hypometabolic subtypes of AD, which were then further characterized with respect to clinical and biomarker characteristics. We then classified FDG-PET scans of 217 amyloid-positive patients with mild cognitive impairment ("prodromal AD") according to the identified subtypes and studied their domain-specific cognitive trajectories and progression to dementia over a follow-up interval of up to 72 months.

Results: Three main hypometabolic subtypes were identified: (i) "typical" (48.6%), showing a classic posterior temporo-parietal hypometabolic pattern; (ii) "limbic-predominant" (44.6%), characterized by old age and a memory-predominant cognitive profile; and (iii) a relatively rare "cortical-predominant" subtype (6.8%) characterized by younger age and more severe executive dysfunction. Subtypes classified in the prodromal AD sample demonstrated similar subtype characteristics as in the AD dementia sample and further showed differential courses of cognitive decline.

Conclusions: These findings complement recent research efforts on MRI-based identification of distinct AD atrophy subtypes and may provide a potentially more sensitive molecular imaging tool for early detection and characterization of AD-related neurodegeneration variants at prodromal disease stages.

Keywords: Alzheimer’s disease; FDG-PET; Hypometabolism; Mild cognitive impairment; Prodromal; Subtypes.


Conflict of interest statement

SJT participated in the scientific advisory boards of Roche Pharma AG and MSD and received lecture fees from Roche and MSD. MJG, FL, CL, MD, EW and RB declare that they have no competing interests.

Figures

Fig. 1
Fig. 1
Hierarchical clustering dendrogram and hypometabolic FDG-PET patterns of identified AD subtypes. Dendrogram resulting from Ward’s hierarchical clustering analysis of individual FDG-PET profiles of patients with AD dementia. Brain plots show voxel-wise hypometabolic patterns of the three identified AD subtypes as revealed by statistical comparison to the healthy control group. FDG-PET scans were scaled to the average pons signal prior to the group comparisons, and age, gender, and years of education were used as covariates. Statistical parametric maps of the group differences were converted into Cohen’s d effect size maps to allow for a better comparison of the patterns across the unevenly sized AD subgroups. Subtype patterns at higher clustering solutions are shown in Supplementary Figure 2
Fig. 2
Fig. 2
Hypometabolic FDG-PET patterns of subtypes of patients with prodromal AD. Voxel-wise hypometabolic patterns of the four prodromal AD subtypes as compared to the healthy control group. FDG-PET scans were scaled to the average pons signal prior to analysis, and age, gender, and years of education were used as covariates. Statistical parametric maps of the group differences were converted into Cohen’s d effect size maps to allow for a better comparison of the patterns across the unevenly sized subgroups. Please note that the effect size scale differs from the scale used in Fig. 1 as it has been adapted to optimally display the differential patterns that define the subtypes at the prodromal disease stage. Supplementary Figure 4 provides an illustration of the hypometabolic patterns in the prodromal group when using the same effect size scale as in the AD dementia group
Fig. 3
Fig. 3
Kaplan-Meier curves of the time to progression to dementia across subtypes in the prodromal AD group. Kaplan-Meier survival curves indicate proportions of participants within the three prodromal AD subtypes progressing to dementia, operationalized as a change in CDR score from 0.5 to ≥ 1. Patients who did not progress to dementia within the observation period or did not have follow-up CDR scores were censored
Fig. 4
Fig. 4
Longitudinal cognitive trajectories of subtypes of patients with prodromal AD. Predicted values of domain-specific cognitive scores were obtained from mixed effects regression models which included age, gender, and years of education as covariates, as well as random intercepts and slopes for participants to account for multiple measurements. a Memory function progression. b Executive function progression. c Visuospatial function progression. d Language function progression. Ribbons around the regression lines represent 95% confidence intervals for the fitted values

References

    1. Murray ME, Graff-Radford NR, Ross OA, Petersen RC, Duara R, Dickson DW. Neuropathologically defined subtypes of Alzheimer’s disease with distinct clinical characteristics: a retrospective study. Lancet Neurol. 2011;10(9):785–796. doi: 10.1016/S1474-4422(11)70156-9. - DOI - PMC - PubMed
    1. Whitwell JL, Dickson DW, Murray ME, Weigand SD, Tosakulwong N, Senjem ML, et al. Neuroimaging correlates of pathologically defined subtypes of Alzheimer’s disease: a case-control study. Lancet Neurol. 2012;11(10):868–877. doi: 10.1016/S1474-4422(12)70200-4. - DOI - PMC - PubMed
    1. Habes M, Grothe MJ, Tunc B, McMillan C, Wolk DA, Davatzikos C. Disentangling heterogeneity in Alzheimer’s disease and related dementias using data-driven methods. Biol Psychiatry. 2020;88(1):70–82. PMID: 32201044. - PMC - PubMed
    1. Ten Kate M, Dicks E, Visser PJ, van der Flier WM, Teunissen CE, Barkhof F, et al. Atrophy subtypes in prodromal Alzheimer’s disease are associated with cognitive decline. Brain. 2018;141(12):3443–3456. doi: 10.1093/brain/awy264. - DOI - PMC - PubMed
    1. Zhang X, Mormino EC, Sun N, Sperling RA, Sabuncu MR, Yeo BT, et al. Bayesian model reveals latent atrophy factors with dissociable cognitive trajectories in Alzheimer’s disease. Proc Natl Acad Sci U S A. 2016;113(42):E6535–E6E44. doi: 10.1073/pnas.1611073113. - DOI - PMC - PubMed

Publication types

MeSH terms

Substances