. 2021 Feb 19;7(8):eabe1122.
doi: 10.1126/sciadv.abe1122. Print 2021 Feb.

Kinetics of osmotic stress regulate a cell fate switch of cell survival

Affiliations

Kinetics of osmotic stress regulate a cell fate switch of cell survival

Alexander Thiemicke et al. Sci Adv. .

Abstract

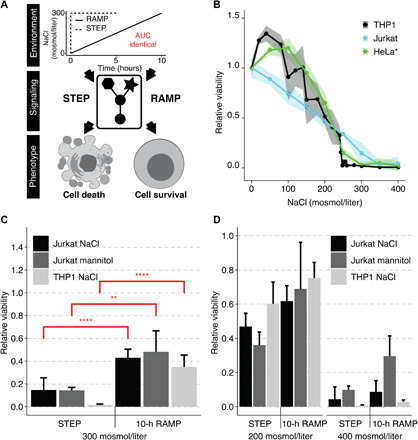
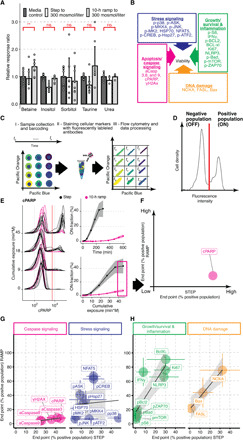
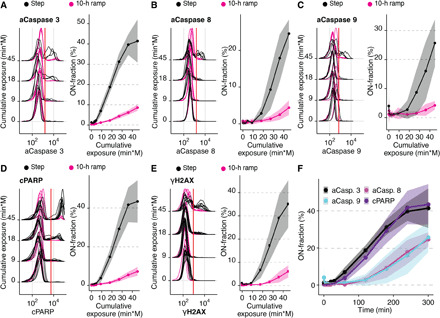
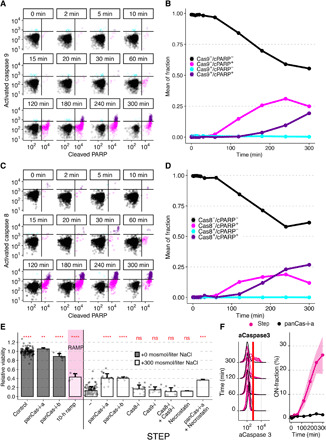
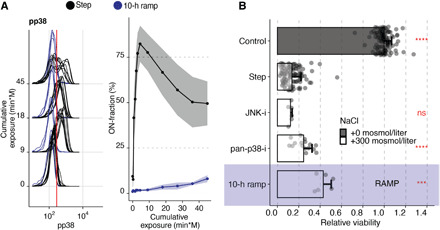
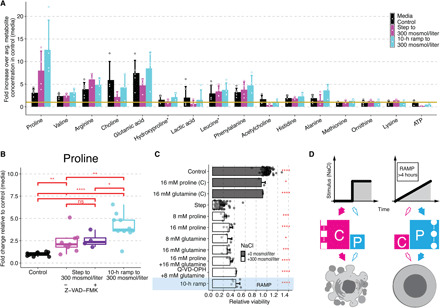
Exposure of cells to diverse types of stressful environments differentially regulates cell fate. Although many types of stresses causing this differential regulation are known, it is unknown how changes over time of the same stressor regulate cell fate. Changes in extracellular osmolarity are critically involved in physiological and pathophysiological processes in several tissues. We observe that human cells survive gradual but not acute hyperosmotic stress. We find that stress, caspase, and apoptosis signaling do not activate during gradual stress in contrast to acute treatments. Contrary to the current paradigm, we see a substantial accumulation of proline in cells treated with gradual but not acute stresses. We show that proline can protect cells from hyperosmotic stress similar to the osmoprotection in plants and bacteria. Our studies found a cell fate switch that enables cells to survive gradually changing stress environments by preventing caspase activation and protect cells through proline accumulation.


Figures

Fig. 1
Fig. 1. Human cell fate decisions are regulated differently upon step or ramp treatment conditions.
(A) Environments such as concentration ramps, as observed in different physiological relevant conditions, may differentially modulate cell signaling, cell fate, and phenotype even if the final concentration and total amount of stress are identical. Step experiments finish after 5 hours and ramp experiments finish after 10 hours to account for the same total exposure or AUC. (B) We measured relative cell viability after exposure to instant hyperosmotic stress (NaCl for 5 hours for Jurkat and THP1) or 24 hours (HeLa cells). Cell viability was determined by measuring intracellular adenosine triphosphate (Jurkat and THP1) or cell counts (HeLa). The shaded area represents the SD (Jurkat and THP1) or SE (HeLa) (11). (C and D) Relative cell viability was determined for step and 10-hour ramp treatment after addition of (C) 300 mosmol/liter osmolyte or (D) 200 and 400 mosmol/liter osmolyte. We determined viability at the end of the experiment after reaching the same cumulative exposure of additional NaCl. Bars represent data from at least three independent experiments for each condition. Error bars represent SD. Two-sided unpaired Student’s t test: **P < 0.01 and ****P < 0.001.
Fig. 2
Fig. 2. Temporal functional quantitative flow cytometry screen identifies differential regulation of stress and caspase signaling during step and ramp hyperosmotic stress conditions.
(A) Mean response ratio of cellular osmolytes relative to media measured in Jurkat cells exposed to an additional 300 mosmol/liter NaCl and determined by mass spectrometry. Two-sided unpaired Student’s t test: **P < 0.01; ns, not significant. (B) Overview of protein markers in this study. (C) Multiplex flow cytometry workflow to quantify dynamic changes in protein activity over time. (D) Flow cytometry distribution is threshold-gated (red line). (E) Representative flow cytometry distributions for cleaved PARP (cPARP) at selected time points for step (black) and 10-hour ramp (magenta) experiments (left), positive cells (ON-fraction) over time (right, top), or cumulative NaCl exposure (right, bottom). Mean (solid line) and SD (shaded area) of >3 biological replicas. (F) End point measurement (magenta box in E) to determine ON-fractions to compare changes for step and ramp conditions. (G and H) Comparison of end point measurement for individual markers of groups as indicated in (B). Circles represent mean of ON-fractions after exposing cells for 5 hours (step) or 10 hours (ramp) to 300 mosmol/liter NaCl. N ≥ 3, colored lines represent SD. Black lines indicate linear regression fits. Shaded area represents 95% confidence interval.
Fig. 3
Fig. 3. Differential caspase signaling regulates cell viability.
(A to E) Differential regulation of (A) cleaved caspase 3, (B) cleaved caspase 8, (C) cleaved caspase 9, (D) cPARP, and (E) γH2AX in Jurkat cells exposed to 300 mosmol/liter NaCl by a step (black) or a 10-hour ramp (magenta). The left panel shows selected single-cell distributions over the cumulative exposure with individual lines representing independent experiments. Red line indicates the threshold for determining the ON-fraction. Right panels represent ON-fraction mean and SD of 3 to 10 independent experiments as a function of cumulative exposure of NaCl. (F) ON-fraction kinetics of caspase signaling markers over time indicate early (caspase 3 and cPARP) and late (caspase 8 and 9) activation. Lines indicate mean and SD of 3 to 10 independent experiments.
Fig. 4
Fig. 4. Activated caspase 8 or 9 are not initiating apoptosis in hyperosmotic stress.
(A to D) Jurkat cells costained for cPARP and activated caspase 9 (A) or 8 (C) measured by flow cytometry after step exposure to 300 mosmol/liter NaCl for 5 hours. Black lines indicate thresholds to determine individual fractions of activated caspase 9 or 8 and cPARP. Circles represent single cells. Quantification of fraction of cells stained for caspase 9 (B) or 8 (D) activation and PARP cleavage over the time course using thresholds indicated in (A) or (C). (E) Relative viability after 10-hour ramp (magenta) or 5-hour step treatment to 300 mosmol/liter NaCl (white) or control (gray) in the presence of the following: “panCas-i-a” (Z-VAD-FMK, 100 μM), “panCas-i-b” (Q-VD-OPH, 100 μM), “Cas8-i” (Z-IETD-FMK, 100 μM), “Cas9-i” (Z-LEHD-FMK, 100 μM), and necrostatin (10 μM). Bars indicate mean and SD, N ≥ 3. Two-sided unpaired Student’s t test: **P < 0.01, ***P < 0.001, and ****P < 0.00001. (F) Activated caspase 3 (aCaspase 3) in Jurkat cells step exposure to 300 mosmol/liter NaCl in the presence (black) or absence (magenta) of pan-caspase inhibitor (Z-VAD-FMK, 20 μM). Left panel shows single-cell distributions over cumulative exposure with individual lines representing independent experiments. Red line indicates ON-fraction threshold. Right panels represent mean and SD of one to four independent experiments over cumulative exposure.
Fig. 5
Fig. 5. Contribution of p38 to apoptosis in hypertonic stress is minimal.
(A) Phosphorylation of p38 in Jurkat cells exposed to 300 mosmol/liter NaCl by a step (black) or a 10-hour ramp (blue). The left panel shows selected single-cell distributions over the cumulative exposure with individual lines representing independent experiments. The red line indicates the threshold for determining a cell that is p38 phosphorylation positive (ON-fraction). The right panel represents the ON-fraction mean and SD of 3 to 10 independent experiments as a function of cumulative exposure. (B) Viability of Jurkat cells relative to untreated cells (control) exposed to an additional 0 (gray) or 300 mosmol/liter (white) NaCl for 5 hours (step) or 10 hours (ramp, purple), respectively. Pan p38 inhibitor (pan-p38-i, BIRB796, 10 μM) and JNK inhibitor (SP600125, 10 μM) were added 30 min before NaCl. Circles represent single experiments. Bars indicate the mean and SD of at least three replicates. Two-sided unpaired Student’s t test: ***P < 0.01 and ****P < 0.0001.
Fig. 6
Fig. 6. Intracellular proline protects human cells during ramp stress conditions.
(A) Fifteen most abundant metabolites detected in Jurkat cells without stimulation (black), after treatment with step (magenta) or 10-hour ramp (cyan) to 300 mosmol/liter NaCl. Bars represent mean and SD of the fold change of each metabolite to the average metabolite concentration in the control condition (yellow line) with circles representing replicates. (B) Change of proline levels in Jurkat cells relative to control (no additional NaCl) in 0 (black) or step without (magenta) or with pan-caspase inhibitor “a” (Z-VAD-FMK, 100 μM) (purple) or 10-hour ramp to 300 mosmol/liter NaCl (cyan). Circles represent replicates, N ≥ 4. (C) Viability in Jurkat cells exposed to step or 10-hour ramp (blue) of 300 mosmol/liter NaCl relative to control (gray). Pan-caspase inhibitor (Q-VD-OPH, 100 μM) was added 30 min and amino acids 60 min before NaCl. Bars indicate mean and SD, N ≥ 3. Two-sided unpaired Student’s t test: *P < 0.05, **P < 0.01, ***P < 0.001, and ****P < 0.0001. (D) Model: Instant stress conditions cause activation of caspase signaling (C) and cell death (magenta), whereas the gradual increased stress to the same final concentration does not activate caspase signaling but instead increases intracellular proline (P) as an osmolyte to protect cells against increasing stress (cyan).

Similar articles

Cited by

References

    1. W. Lim, B. Meyer, T. Pawson, Cell Signaling: Principles and Mechanisms (Garland Science, 2014).
    1. Young J. W., Locke J. C. W., Elowitz M. B., Rate of environmental change determines stress response specificity. Proc. Natl. Acad. Sci. U.S.A. 110, 4140–4145 (2013). - PMC - PubMed
    1. Sorre B., Warmflash A., Brivanlou A. H., Siggia E. D., Encoding of temporal signals by the TGF-β pathway and implications for embryonic patterning. Dev. Cell 30, 334–342 (2014). - PMC - PubMed
    1. Burg M. B., Ferraris J. D., Dmitrieva N. I., Cellular response to hyperosmotic stresses. Physiol. Rev. 87, 1441–1474 (2007). - PubMed
    1. Cai Q., Michea L., Andrews P., Zhang Z., Rocha G., Dmitrieva N., Burg M. B., Rate of increase of osmolality determines osmotic tolerance of mouse inner medullary epithelial cells. Am. J. Physiol. Renal Physiol. 283, F792–F798 (2002). - PubMed

Publication types

LinkOut - more resources