. 2021 Feb 19;7(8):eabe4038.
doi: 10.1126/sciadv.abe4038. Print 2021 Feb.

Patient-tailored design for selective co-inhibition of leukemic cell subpopulations

Affiliations

Patient-tailored design for selective co-inhibition of leukemic cell subpopulations

Aleksandr Ianevski et al. Sci Adv. .

Abstract

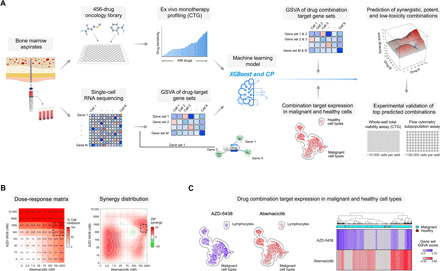
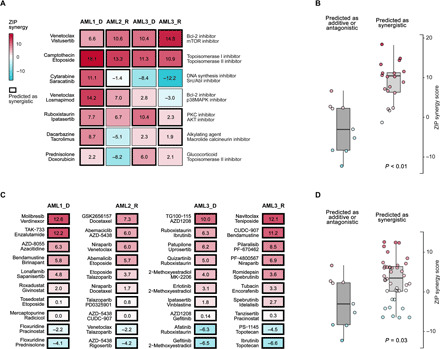
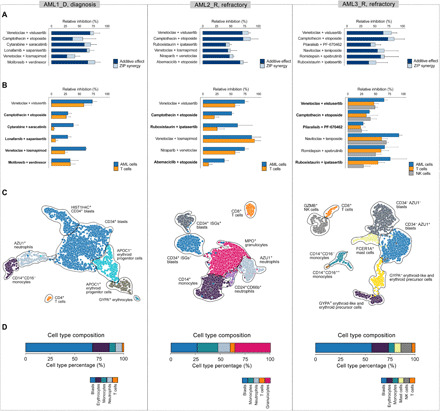
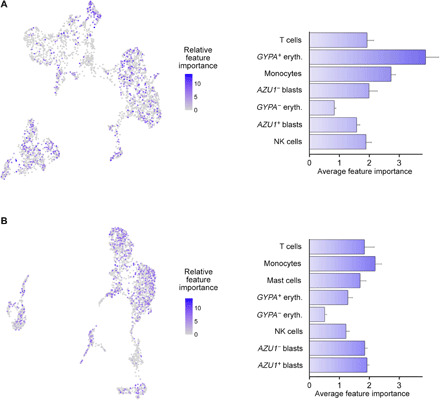
The extensive drug resistance requires rational approaches to design personalized combinatorial treatments that exploit patient-specific therapeutic vulnerabilities to selectively target disease-driving cell subpopulations. To solve the combinatorial explosion challenge, we implemented an effective machine learning approach that prioritizes patient-customized drug combinations with a desired synergy-efficacy-toxicity balance by combining single-cell RNA sequencing with ex vivo single-agent testing in scarce patient-derived primary cells. When applied to two diagnostic and two refractory acute myeloid leukemia (AML) patient cases, each with a different genetic background, we accurately predicted patient-specific combinations that not only resulted in synergistic cancer cell co-inhibition but also were capable of targeting specific AML cell subpopulations that emerge in differing stages of disease pathogenesis or treatment regimens. Our functional precision oncology approach provides an unbiased means for systematic identification of personalized combinatorial regimens that selectively co-inhibit leukemic cells while avoiding inhibition of nonmalignant cells, thereby increasing their likelihood for clinical translation.


Figures

Fig. 1
Fig. 1. Schematic representation of the drug combination prediction approach.
(A) Prediction of combinations with high synergy and potency in malignant cells and low toxicity in nonmalignant cells based on high-throughput ex vivo single-agent profiling of viability responses of individual patient sample to 456 compounds, combined with the 3′ end whole-transcriptome scRNA-seq of enriched mononuclear cells, compressed to compound-target enrichment score matrix (GSVA based on the single-agent targets). These input data were used for training of an integrated machine learning model (XGBoost combined with CP) for the prediction of compound-induced overall cell viability inhibition at the concentration nearest to the relative half-maximal inhibitory concentration (IC50) of each single agent and each patient sample separately (see fig. S2). CTG, CellTiter-Glo. (B) An example of a predicted drug combination (AZD-5438 and abemaciclib) for AML2 patient sample. Combination dose-response matrix and the corresponding synergy distribution confirmed the predicted synergistic effect in the region around IC50 of the two compounds (dashed rectangle). (C) Uniform manifold approximation and projection (UMAP) projection of the scRNA-seq profiles informs about the compound target enrichment scores across cell types of the patient sample before the ex vivo treatments. In this example, GSVA revealed complementary low-overlapping expression scores for the targets of the two compounds, explaining their synergistic co-inhibition effect in various populations of malignant cells. The prediction algorithm was trained on all the leukemic cells (blast and nonblasts), and lymphocytes were considered as nonmalignant “healthy” cells in the current combination predictions.
Fig. 2
Fig. 2. Experimental validation of the combination predictions using combinatorial CTG viability assay.
(A) Top seven shared combinations predicted to have synergy and AML cell selectivity in at least two samples. The numbers correspond to the ZIP synergy score (22), calculated for the dose region around IC50 values of each drug in combination, separately for each patient sample and combination. (B) Comparison of the synergy score distributions of the combinations predicted to be either synergistic (ZIP > 5), antagonistic (ZIP < −5), or additive (−5 < ZIP < 5) in the patient samples (P < 0.01; Wilcoxon rank sum test). (C) Top 10 patient-specific combinations predicted uniquely for each patient sample. (D) The measured synergies of the patient-specific combination predictions were higher compared with those that were predicted to be only additive or antagonistic (P = 0.03; Wilcoxon rank sum test). Overall, 53% of the 59 predicted synergistic combinations were experimentally confirmed to show synergy, and 83% were nonantagonistic (ZIP > −5).
Fig. 3
Fig. 3. Co-inhibition effects of the predicted combinations selected for flow cytometry experiments in each patient sample.
(A) The combined dark and light blue bars together indicate the relative combinatorial inhibition, compared to nontreated cells, based on the whole-well viability assays, which was used in the prediction model for single-agent total viability responses. The dark blue parts of each bar indicate the expected additive inhibition from the combinations, and the light blue parts mark the unselective co-inhibition synergy based on the whole-well viability assays (excess inhibition % based on the ZIP synergy model). (B) Relative inhibition of malignant AML cell subpopulations compared to inhibition of nonmalignant cells (T and NK cells) in the patients based on the flow cytometry assay. Boldfacing indicates those 12 combinations (67%) with low toxicity (less than 50% of relative inhibition of T and NK cells). The co-inhibition of the nonmalignant cell subpopulations was significantly lower compared to that of the AML cells (P = 3.9 × 10⁻⁶; Wilcoxon signed-rank test). Note: No cells were available from the AML3 patient diagnostic sample for the flow cytometry experiments. (C) UMAP visualizations of the cell subpopulations based on the scRNA-seq transcriptomic profiles of the patient cells extracted before ex vivo compound testing. Cell clusters were identified using our ScType scRNA-seq processing pipeline (31), with the Louvain clustering implemented in Seurat v3.1.0 (32). The identified clusters were annotated on the basis of cell-specific marker information from our ScType marker database, and unassigned cell types were manually identified (detailed in Materials and Methods). (D) Cell type composition of the patient samples based on their scRNA-seq transcriptomic profiles. Erythrocyte cell type corresponds to erythroid-like and erythroid precursor cells; see Materials and Methods. See fig. S3 for an extended version, where also the cell subpopulations identified in the patient sample AML3_D are shown.
Fig. 4
Fig. 4. Contribution of single-cell features across various cell types to the predictive modeling.
(Left) Relative importance of each single cell for the predictive contribution of the model, define by the features’ predictive contribution for each regression tree of the XGBoost algorithm. (Right) Average feature importance (AFI) of each cell type for generating the model predictions, calculated by averaging the feature importance within the cell types. (A) AML3_D and (B) AML_R. Higher AFI values indicate that higher percentage of cells within the cluster are distinct from each other and are required for more accurate predictions, while low AFI values imply that cells within a cell type are highly similar from the model perspective, and only few cells are enough for model construction. The error bars denote SEM of the scaled AFI.
Fig. 5
Fig. 5. Target expression of compounds identified as effective and less toxic combinations.
(A) Comparison of the expression of losmapimod primary target MAPK14 in the leukemic cells of AML1 and AML2 patients, against leukemic cells of AML3 patient, and nonleukemic cells of AML1 and AML2. (B to D) Comparison of expression levels of molibresib targets BRD2, BRD3, and BRD4 between leukemic and nonleukemic cells of AML1. (E) Comparison of the cytarabine-deactivating enzyme cytidine deaminase (CDA) expression in the leukemic cells of AML2 patient with leukemic cells of other samples and nonleukemic cells of AML2. (F and G) Comparison of the expression levels of ruboxistaurin targets PRKCB and PIM3 in the leukemic cells of AML2 patient with leukemic cells of other samples and nonleukemic cells of AML2. (H) Comparison of expression levels of patupilone target tubulin β (TUBB) in the leukemic cells of AML3 patient with leukemic cells of other samples and nonleukemic cells of AML3. In each panel, y axis shows log-normalized count values after sctransform (32), where P values were calculated with Wilcoxon rank sum test. ***P < 0.001.
Fig. 6
Fig. 6. Interaction networks for the predicted and validated patient-specific combinations.
(A) Venetoclax and losmapimod, (B) GSK2656157 and docetaxel, and (C) doxorubicin and prednisolone. The protein nodes in the networks include the primary and secondary targets of the compounds in the combinations, along with differentially expressed genes in the target pathways that could potentially explain the observed combination effects in the particular patient samples [(A) AML1 and AML2; (B) AML2; (C) AML3_D]. The visualization was performed using the STITCH web tool (67). The edge width and color darkness indicate the degree of data support for the connection. The chemical-protein interactions include both direct targets of the compounds and their downstream targets and other molecular modifiers of the compounds’ responses. 3D, three-dimensional.

References

    1. Cancer Genome Atlas Research Network, Ley T. J., Miller C., Ding L., Raphael B. J., Mungall A. J., Robertson A. G., Hoadley K., Triche T. J. Jr., Laird P. W., Baty J. D., Fulton L. L., Fulton R., Heath S. E., Kalicki-Veizer J., Kandoth C., Klco J. M., Koboldt D. C., Kanchi K.-L., Kulkarni S., Lamprecht T. L., Larson D. E., Lin L., Lu C., McLellan M. D., McMichael J. F., Payton J., Schmidt H., Spencer D. H., Tomasson M. H., Wallis J. W., Wartman L. D., Watson M. A., Welch J., Wendl M. C., Ally A., Balasundaram M., Birol I., Butterfield Y., Chiu R., Chu A., Chuah E., Chun H.-J., Corbett R., Dhalla N., Guin R., He A., Hirst C., Hirst M., Holt R. A., Jones S., Karsan A., Lee D., Li H. I., Marra M. A., Mayo M., Moore R. A., Mungall K., Parker J., Pleasance E., Plettner P., Schein J., Stoll D., Swanson L., Tam A., Thiessen N., Varhol R., Wye N., Zhao Y., Gabriel S., Getz G., Sougnez C., Zou L., Leiserson M. D. M., Vandin F., Wu H.-T., Applebaum F., Baylin S. B., Akbani R., Broom B. M., Chen K., Motter T. C., Nguyen K., Weinstein J. N., Zhang N., Ferguson M. L., Adams C., Black A., Bowen J., Gastier-Foster J., Grossman T., Lichtenberg T., Wise L., Davidsen T., Demchok J. A., Shaw K. R. M., Sheth M., Sofia H. J., Yang L., Downing J. R., Eley G., Genomic and epigenomic landscapes of adult de novo acute myeloid leukemia. N. Engl. J. Med. 368, 2059–2074 (2013). - PMC - PubMed
    1. Quek L., David M. D., Kennedy A., Metzner M., Amatangelo M., Shih A., Stoilova B., Quivoron C., Heiblig M., Willekens C., Saada V., Alsafadi S., Vijayabaskar M. S., Peniket A., Bernard O. A., Agresta S., Yen K., Beth K. M., Stein E., Vassiliou G. S., Levine R., De Botton S., Thakurta A., Penard-Lacronique V., Vyas P., Clonal heterogeneity of acute myeloid leukemia treated with the IDH2 inhibitor enasidenib. Nat. Med. 24, 1167–1177 (2018). - PMC - PubMed
    1. Chen A., Hu S., Wang Q.-F., Tumor heterogeneity of acute myeloid leukemia: Insights from single-cell sequencing. Blood Sci. 1, 73–76 (2019). - PMC - PubMed
    1. Short N. J., Konopleva M., Kadia T. M., Borthakur G., Ravandi F., DiNardo C. D., Daver N., Advances in the treatment of acute myeloid leukemia: New drugs and new challenges. Cancer Discov. 10, 506–525 (2020). - PubMed
    1. Intlekofer A. M., Shih A. H., Wang B., Nazir A., Rustenburg A. S., Albanese S. K., Patel M., Famulare C., Correa F. M., Takemoto N., Durani V., Liu H., Taylor J., Farnoud N., Papaemmanuil E., Cross J. R., Tallman M. S., Arcila M. E., Roshal M., Petsko G. A., Wu B., Choe S., Konteatis Z. D., Biller S. A., Chodera J. D., Thompson C. B., Levine R. L., Stein E. M., Acquired resistance to IDH inhibition through trans or cis dimer-interface mutations. Nature 559, 125–129 (2018). - PMC - PubMed

Publication types