. 2021 Jul;11(7):1754-1773.
doi: 10.1158/2159-8290.CD-20-1325. Epub 2021 Feb 19.

A Functional Taxonomy of Tumor Suppression in Oncogenic KRAS-Driven Lung Cancer

Affiliations

A Functional Taxonomy of Tumor Suppression in Oncogenic KRAS-Driven Lung Cancer

Hongchen Cai et al. Cancer Discov. 2021 Jul.

Abstract

Cancer genotyping has identified a large number of putative tumor suppressor genes. Carcinogenesis is a multistep process, but the importance and specific roles of many of these genes during tumor initiation, growth, and progression remain unknown. Here we use a multiplexed mouse model of oncogenic KRAS-driven lung cancer to quantify the impact of 48 known and putative tumor suppressor genes on diverse aspects of carcinogenesis at an unprecedented scale and resolution. We uncover many previously understudied functional tumor suppressors that constrain cancer in vivo. Inactivation of some genes substantially increased growth, whereas the inactivation of others increases tumor initiation and/or the emergence of exceptionally large tumors. These functional in vivo analyses revealed an unexpectedly complex landscape of tumor suppression that has implications for understanding cancer evolution, interpreting clinical cancer genome sequencing data, and directing approaches to limit tumor initiation and progression. SIGNIFICANCE: Our high-throughput and high-resolution analysis of tumor suppression uncovered novel genetic determinants of oncogenic KRAS-driven lung cancer initiation, overall growth, and exceptional growth. This taxonomy is consistent with changing constraints during the life history of cancer and highlights the value of quantitative in vivo genetic analyses in autochthonous cancer models.This article is highlighted in the In This Issue feature, p. 1601.


Conflict of interest statement

CONFLICT OF INTERESTS

S.K.C. receives grant support from Ono Pharma. C.S. acknowledges grant support from Pfizer, AstraZeneca, Bristol Myers Squibb, Roche-Ventana, Boehringer-Ingelheim, Archer Dx Inc (collaboration in minimal residual disease sequencing technologies) and Ono Pharmaceuticals. C.S is an AstraZeneca Advisory Board member and Chief Investigator for the MeRmaiD1 clinical trial, has consulted for Pfizer, Novartis, GlaxoSmithKline, MSD, Bristol Myers Squibb, Celgene, AstraZeneca, Illumina, Amgen, Genentech, Roche-Ventana, GRAIL, Medicxi, Bicycle Therapeutics, and the Sarah Cannon Research Institute, has stock options in Apogen Biotechnologies, Epic Bioscience, GRAIL, and has stock options and is co-founder of Achilles Therapeutics. D.A.P. and M.M.W. are founders of, and hold equity in, D2G Oncology Inc.

Figures

Figure 1.
Figure 1.. An in vivo screen for tumor suppressor genes in autochthonous oncogenic Kras-driven lung tumors.
(A) Candidate tumor suppressor genes were chosen based on multiple criteria including their frequency and known/predicted biological functions. The plot shows the mutation frequencies of these 48 genes across pan-cancer and in lung adenocarcinoma (data from TCGA). Color denotes lung adenocarcinoma driver consensus score derived from multiple prediction tools. Several genes that are mutated at high frequency in lung adenocarcinoma or pan-cancer are labeled. (B) Features of the mutations in each gene are consistent with tumor suppressor function. Green’s contagion is a measure of mutational hotspots, which characterize oncogenes. Larger values indicate that mutations are enriched in particular residues of the protein. This measure of overdispersion is normalized to not scale with sample size and to be zero when mutations are randomly scattered across the transcript. Average fraction of protein lost by mutation combines the nonsense/frameshift mutation rate and location of the mutations in each gene [(percent of protein transcript altering mutations that are nonsense or frameshift)*(Average fraction of protein lost by nonsense or frameshift mutations)]. (C) Schematic of tumor initiation with our pool of 102 barcoded Lenti-sgRNA/Cre vectors (Lenti-sgTS102/Cre). Each gene is targeted with two sgRNAs, except p53 which is targeted by three sgRNAs. 5 Inert sgRNAs are either non-targeting (NT) or have an active targeting but inert sgRNAs (which target NeoR in the R26LSL-Tomato allele). Barcoded Lentiviral vectors contain an sgRNA, Cre, and a 2-component barcode that includes an sgRNA identifier (sgID) and random barcode (BC). This allows inactivation of multiple target genes in parallel followed by quantification of the number of neoplastic cells by high-throughput sgID-BC sequencing. Mouse genotype, mouse number, and titer of lentiviral vectors are indicated. Tuba-seq was performed on each tumor-bearing lung 15 weeks after initiation, followed by analyses to quantify the indicated metrics. ifu, infectious units. (D) Fluorescence images of lungs from representative mice at 15 weeks after tumor initiation. Lung lobes are outlined with a dashed white line. Scale bars = 2 mm. (E) Pearson correlation coefficient (r) and P-value (two-tailed) suggest strong correlation between neoplastic cell number (an indicator of tumor burden) and lung weight. Each dot represents a mouse. When taking into account that tumors were initiated in KT;H11LSL-Cas9 mice with 3-fold less Lenti-sgTS102/Cre vectors, the total neoplastic cell number is ~10-fold greater in KT;H11LSL-Cas9 mice than in KT mice. (F) Volcano plot of the impact of inactivating each putative tumor suppressor gene on relative tumor burden. Each dot represents an sgRNA. Inert sgRNAs are in gray. Tumor suppressor genes are colored pink when both sgRNAs trigger moderate but significant increase and green when one sgRNA triggers >4 fold increase and the other triggers moderate but significant increase. Data is aggregated from 47 KT;H11LSL-Cas9 and 12 KT mice.
Figure 2.
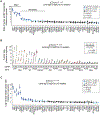
Figure 2.. In vivo lung tumor growth is suppressed by diverse tumor suppressor genes.
(A) The 95th percentile tumor size (normalized to tumors with sgInerts) for each putative tumor suppressor targeting sgRNA in KT;H11LSL-Cas9 mice. Error bars indicate 95% confidence intervals. 95% confidence intervals and P-values were calculated by bootstrap. sgRNAs that significantly increase or decrease tumor size are colored as indicated. sgInerts are in gray and the dotted line indicates no effect. Genes are ordered based on the average of the 95th percentile tumor sizes from all sgRNAs targeting that gene, individual sgRNAs targeting each gene were ranked by effect for clarity. Pearson correlation coefficient (r) and P-value (two tailed) suggest that sgRNAs targeting the same putative tumor suppressor elicit consistent and similar changes in size at 95th percentile. (B) Tumor sizes at the indicated percentiles for the top 17 tumor suppressor genes (relative to the average of sgInert-containing tumors) in KT;H11LSL-Cas9 mice. Error bars indicate 95% confidence intervals. Dotted line indicates no effect. Percentiles that are significantly different from the average of sgInerts are in color. Data for all genes is shown in Supplementary Fig. S5B. Pearson correlation coefficient (r) and P-value (two-tailed) for all sgRNA across all indicated percentiles are shown. (C) The log-normal mean tumor size (normalized to tumors with sgInerts) for each putative tumor suppressor targeting sgRNA in KT;H11LSL-Cas9 mice. Error bars indicate 95% confidence intervals. 95% confidence intervals and P-values were calculated by bootstrap. sgRNAs that significantly increase or decrease tumor size are colored as indicated. sgInerts are in gray and the dotted line indicates no effect. Genes and sgRNAs are ordered as in Fig. 2A. The high Pearson’s correlation coefficient suggests that sgRNAs targeting the same putative tumor suppressor elicit consistent and similar changes in log-normal mean tumor size. All plots represent aggregated data from 47 KT;H11LSL-Cas9.
Figure 3.
Figure 3.. Stag2, inactivation of which increases tumor burden and reduces survival, is frequently lowly expressed in human lung adenocarcinoma.
(A) Cre/lox-mediated Stag2 inactivation promotes KrasG12D-driven lung tumor growth. Lung tumors were initiated in indicated genotypes of mice with Lenti-Cre and allowed to grow for 15 weeks. (B) Representative fluorescence images of lung lobes from the indicated genotypes and genders of mice are shown. Scale bars = 5 mm. (C) Lenti-Cre initiated tumors in indicated KT;Stag2flox/flox mice lack Stag2 protein expression. Scale bar = 50 mm. (D) Lung weight from indicated genotypes of mice 15 weeks after tumor initiation with Lenti-Cre. Each dot represents a mouse and the bar is the mean. P-values were calculated by Student’s t-test. (E) Inactivation of Stag2 increases lung tumor growth in vivo. Representative histology is shown. Genotype and gender are indicated. Scale bars = 1 mm. (F) Quantification of tumor area (%) (tumor area/total lung area × 100) on H&E-stained sections of mouse lungs 15 weeks after tumor initiation. Each dot represents a mouse and the bar is the mean. P-values were calculated by Student’s t-test. (G) Survival curve of mice with KrasG12D-driven lung tumors that are either Stag2 wild-type (KT;Stag2wt/wt female and KT;Stag2wt/y male mice), Stag2 heterozygous (KT;Stag2flox/wt), or Stag2 deficient (KT;Stag2flox/flox female and KT;Stag2flox/y male mice). Mouse number, P-value and median survival (in days) are indicated. P-values were calculated by comparing each cohort to the Stag2 wild-type cohort (Mantel-Haenszel test). (H) Representative STAG2 IHC on human lung adenocarcinomas expressing high (positive) or low (low and negative) STAG2 protein. Scale bars = 100 μm. (I) Quantification of STAG2 expression in 479 human lung adenocarcinomas. Data are grouped by tumor grade (left, with lower grade indicating well-differentiated tumors and higher grade indicating poorly differentiated tumors) or by tumor stage (right, classified by TNM staging system). A higher percentage of Stag2low/neg tumors are poorly differentiated (left) and more advanced (right) tumors.
Figure 4.
Figure 4.. Exaggeration of tumor phenotypes and emergence of more functional tumor suppressors over time.
(A) Schematic of tumor initiation with a pool of 85 barcoded Lenti-sgRNA/Cre vectors (Lenti-sgTS85/Cre) which excludes 8 tumor suppressor genes (in gray and crossed out) from the Lenti-sgTS102/Cre pool whose losses collectively account for ~60% of total tumor burden. Each gene is targeted with two sgRNAs. Mouse genotype, mouse number, and titer of lentiviral vectors delivered to each mouse are indicated. Tuba-seq was performed on each tumor-bearing lung at the indicated time after tumor initiation. (B) Volcano plot of the impact of inactivating each putative tumor suppressor gene on relative tumor burden. Each dot represents an sgRNA. Genes for which both sgRNA increase tumor burden are colored. (C,D) The impact of inactivating each gene on the size of the 95th percentile tumor (C) and log-normal mean (D) at 15 weeks (Lenti-sgTS102/Cre 15 weeks) and 26 weeks (Lenti-sgTS85/Cre 26 weeks) after tumor initiation is shown. Each dot represents an sgRNA. Statistics are calculated from aggregating all tumors from 40 KT;H11LSL-Cas9 (26 weeks) and 47 KT;H11LSL-Cas9 (15 weeks) mice. (E) Heatmap of the tumor suppressive effects of six genes that emerge as suppressors of tumor growth at the later timepoint. Colors indicate the impact of inactivating each gene on tumor size at 15 weeks (Lenti-sgTS102/Cre 15 weeks and Lenti-sgTS85/Cre 15 weeks) and 26 weeks (Lenti-sgTS85/Cre 26 weeks) after tumor initiation, and sizes of the tiles indicate statistical significance levels. (F) Sizes of tumors at the indicated percentiles for each Lenti-sgRNA/Cre vector relative to that of sgInert-targeted tumors in KT;H11LSL-Cas9 mice. Error bars indicate 95% confidence intervals. Percentiles that are significantly different from the average of sgInerts are in color. Data for all genes is shown in Supplementary Fig. S9B.
Figure 5.
Figure 5.. Tumor initiation is inhibited by diverse tumor suppressor genes independent of their effects on tumor growth.
(A) Inactivation of many tumor suppressor genes increases tumor number, highlighting pathways that normally constrain the earliest steps of carcinogenesis. The effect of each sgRNA on tumor number 15 weeks after tumor initiation with Lenti-sgTS102/Cre in KT;H11LSL-Cas9 mice is shown. Error bars indicate 95% confidence intervals. 95% confidence intervals and P-values were calculated by bootstrap. sgRNAs that significantly increase or decrease tumor number are colored as indicated. sgInerts are in gray and the dotted line indicates no effect. Genes and sgRNAs are ordered as in Fig. 2A. (B) Genotype specific effects on growth (represented by the size of the tumor at the 95th percentile) and tumor number can be independent aspects of tumor suppression. (C,D) Mutation frequency of members of the COMPASS complex in human lung adenocarcinoma. Data are shown as the number of patients with mutations in one or more of the COMPASS complex subunits/total patient number from GENIE/IMPACT (C) as well as TCGA and TRACERx (D). Data from GENIE/IMPACT are based on panel sequencing and therefore does not include data on NCOA6. Data from TRACERx are from multi-region sequencing where we report the number of tumors that had any of these four genes mutated in one or more regions. (E) The effect of each sgRNA on tumor number 26 weeks after tumor initiation with Lenti-sgTS85/Cre in KT;H11LSL-Cas9 mice is shown. Error bars indicate 95% confidence intervals. 95% confidence intervals and P-values were calculated by bootstrap. sgRNAs that significantly increase or decrease tumor number are colored as indicated. sgInerts are in gray and the dotted line indicates no effect. Genes and sgRNAs are ordered as in (A). (F) Effects of tumor suppressor gene inactivation on tumor number are highly reproducible. The impact of inactivating each gene on tumor number at 15 weeks (Lenti-sgTS102/Cre 15 weeks) and 26 weeks (Lenti-sgTS85/Cre 26 weeks) after tumor initiation is shown. Each dot represents an sgRNA. Statistics are calculated from aggregating all tumors from all mice in each group in each experiment. Pearson correlation coefficient (r) shows correlation.
Figure 6.
Figure 6.. Loss of p53, Cdkn2a and Dnmt3a result in rare yet exceptionally large tumors.
(A) Plot of tumor sizes for each indicated sgRNA in KT;H11LSL-Cas9 mice at 15 weeks. Each dot represents a tumor and the area of the dot scales with neoplastic cell number within the tumor. For better visualization, an equal number of tumors (n=1160) are shown for each sgRNA. (B) Volcano plot of the impact of inactivating each putative tumor suppressor gene on the distribution of tumor sizes (Hill’s estimator compares tumors above the 95th percentile to those at the 95th percentile to quantify the relative size of tumors in the tail of the distribution). P53- and Dnmt3a-targeted tumors are heavy-tailed, suggesting that loss of these genes promoted the emergence of exceptionally large tumors. Each dot represents an sgRNA. (C) Plot of tumor sizes for each indicated sgRNA in KT;H11LSL-Cas9 mice at 26 weeks. Each dot indicates a tumor, and the area of the dot indicates neoplastic cell number within the tumor. Equal number of tumors (814 tumors randomly sampled) are shown for each sgRNA. (D) Volcano plot of the impact of inactivating each putative tumor suppressor gene on the developing of infrequent exceptionally large tumors (Hill’s estimator). Each dot represents an sgRNA. Statistics are calculated from aggregating all tumors from 40 KT;H11LSL-Cas9 (26 weeks) mice. (E) Inactivation of Dnmt3a and Cdkn2a generate tumor size distributions with heavy tails. Probability density plots for tumor sizes show the profile of aggregated tumors with sgInerts as well as individual sgRNAs targeting either Dnmt3a or Cdkn2a. Data is aggregated from all tumors from 40 KT;H11LSL-Cas9 (26 weeks) mice.
Figure 7.
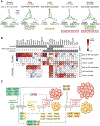
Figure 7.. Tumor suppressors constrain tumorigenesis at different stages and to different levels.
(A) Radar plots of representative genes whose inactivation affects tumor size at the 95th percentile (relative to sgInerts, indicating increased overall growth), tumor number (relative to sgInerts, indicating increased tumor initiation) and Hill’s estimator (relative to sgInerts, indicating increased rare large tumors). Tumor suppressors suppress different aspects of tumor development. (B) Heatmap summarizing the tumor size at the 95th percentile (relative to sgInerts), tumor number (relative to sgInerts) and Hill’s estimator (relative to sgInerts) of the functional tumor suppressor genes. Color scale is indicated on the side. Bolded circles indicate bootstrap P < 0.05. Although the sizes of Ubr5-, Tsc1-, Kdm6a- and Ncoa6-deficient tumors are not significantly different from control tumors at 95th percentile, they are significantly greater across multiple percentiles at 26 weeks, and thus they are also considered genes that suppress tumor growth. (C) Summary schematic of a tumor suppression map in lung adenocarcinoma based on our data.

References

    1. Hanahan D, Weinberg RA. Hallmarks of cancer: the next generation. Cell 2011;144(5):646–74 doi 10.1016/j.cell.2011.02.013. - DOI - PubMed
    1. Consortium APG. AACR Project GENIE: Powering Precision Medicine through an International Consortium. Cancer Discov 2017;7(8):818–31 doi 10.1158/2159-8290.CD-17-0151. - DOI - PMC - PubMed
    1. Consortium ITP-CAoWG. Pan-cancer analysis of whole genomes. Nature 2020;578(7793):82–93 doi 10.1038/s41586-020-1969-6. - DOI - PMC - PubMed
    1. Cancer Genome Atlas Research N. Comprehensive molecular profiling of lung adenocarcinoma. Nature 2014;511(7511):543–50 doi 10.1038/nature13385. - DOI - PMC - PubMed
    1. Zehir A, Benayed R, Shah RH, Syed A, Middha S, Kim HR, et al. Mutational landscape of metastatic cancer revealed from prospective clinical sequencing of 10,000 patients. Nat Med 2017;23(6):703–13 doi 10.1038/nm.4333. - DOI - PMC - PubMed

Publication types

MeSH terms

Substances