. 2021 Feb 19;12(1):1147.
doi: 10.1038/s41467-021-21385-z.

Harnessing peak transmission around symptom onset for non-pharmaceutical intervention and containment of the COVID-19 pandemic

Affiliations

Harnessing peak transmission around symptom onset for non-pharmaceutical intervention and containment of the COVID-19 pandemic

Liang Tian et al. Nat Commun. .

Abstract

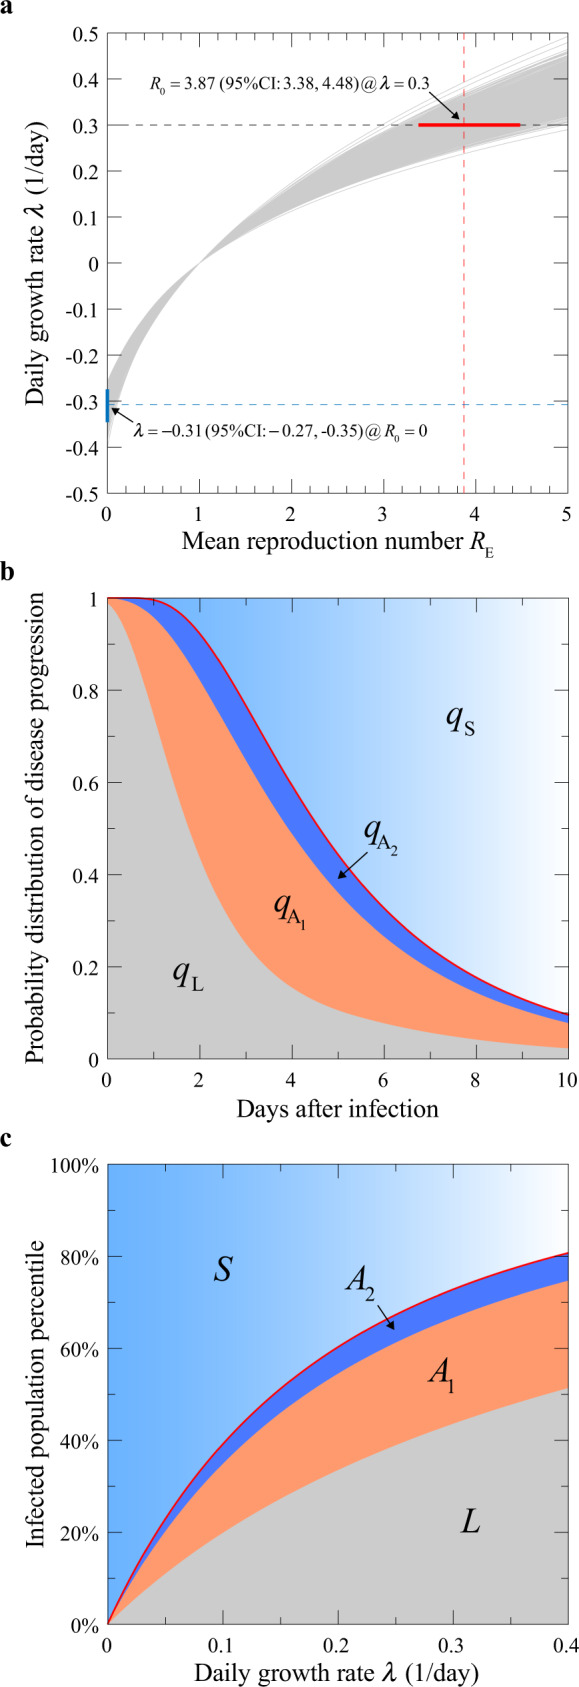
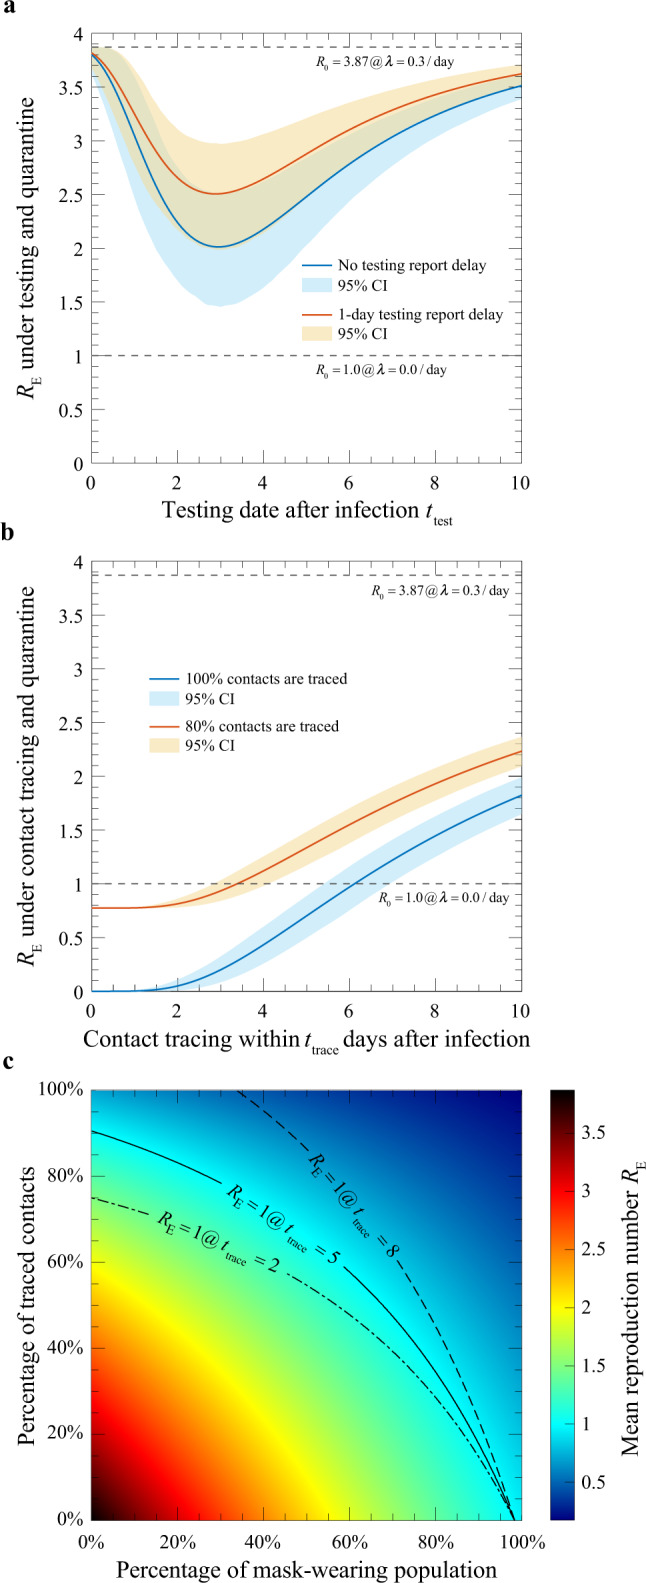
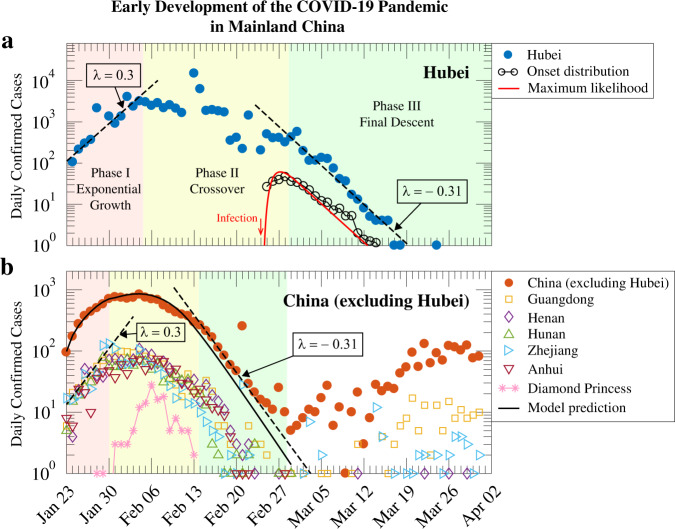
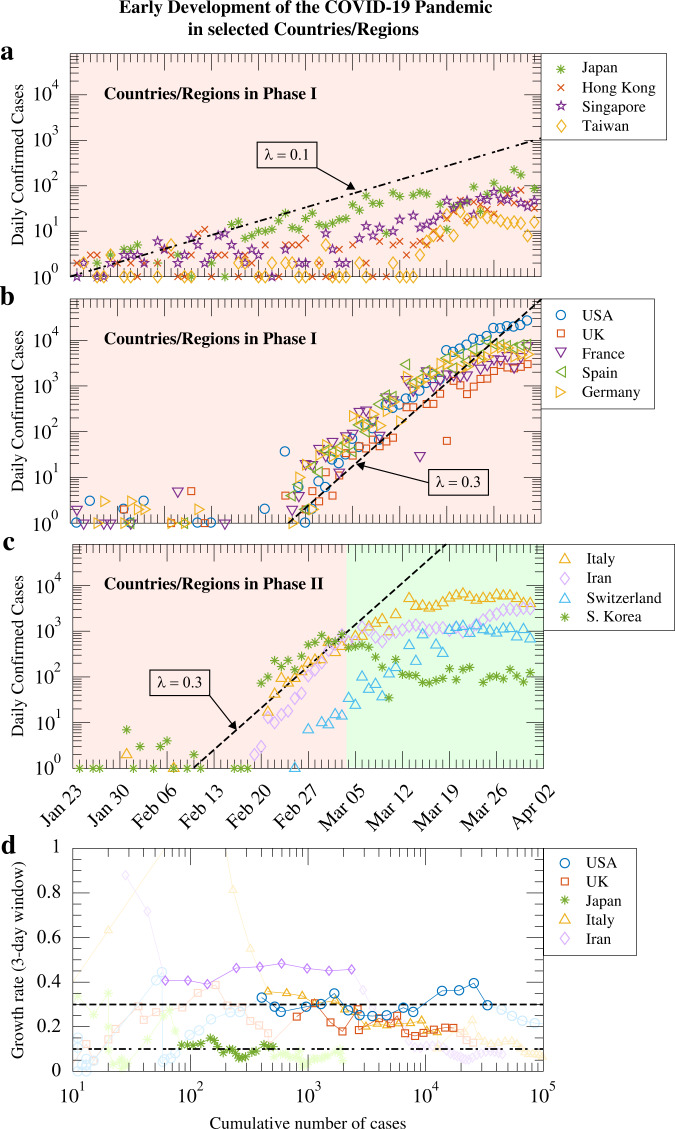
Within a short period of time, COVID-19 grew into a world-wide pandemic. Transmission by pre-symptomatic and asymptomatic viral carriers rendered intervention and containment of the disease extremely challenging. Based on reported infection case studies, we construct an epidemiological model that focuses on transmission around the symptom onset. The model is calibrated against incubation period and pairwise transmission statistics during the initial outbreaks of the pandemic outside Wuhan with minimal non-pharmaceutical interventions. Mathematical treatment of the model yields explicit expressions for the size of latent and pre-symptomatic subpopulations during the exponential growth phase, with the local epidemic growth rate as input. We then explore reduction of the basic reproduction number R0 through specific transmission control measures such as contact tracing, testing, social distancing, wearing masks and sheltering in place. When these measures are implemented in combination, their effects on R0 multiply. We also compare our model behaviour to the first wave of the COVID-19 spreading in various affected regions and highlight generic and less generic features of the pandemic development.


Conflict of interest statement

The authors declare no competing interests.

Figures

Fig. 1
Fig. 1. A stochastic model for COVID-19 disease progression, transmission and intervention.
a The mean reproduction rate r(t) (black curve) of a patient on day t since infection is expressed as a convolution of the symptom onset time distribution pO(t) (red curve) and the infectiousness curve REpIt) (blue curve), where Δt is measured from the symptom onset. The mean reproduction number RE sets the overall level of the epidemic. The peak of the normalised infectiousness function pIt) is shifted from the symptom onset by an amount θP, which takes a positive value on the pre-symptomatic side. The peak of the mean reproduction rate r(t) is shifted from the peak of the symptom onset time distribution pO(t) by θS. b A compartmentalised model. A person infected first goes through a non-infectious latent phase (L) until tL, followed by an infectious period that spans across symptom onset at tO. In the pre-symptomatic phase A, the person is infectious without symptoms. The A phase is further split into two subphases, A1 with a constant transmission rate (orange region) and A2 with a declining transmission rate (blue region). At the symptom onset time tO, the person enters the S phase, and continues to be infectious (light blue region). Contact tracing brings an infected person out of the transmission cycle at the point of isolation, while testing does so only when the result is positive.
Fig. 2
Fig. 2. Parameter calibration from case studies.
a The symptom onset time distribution. Raw statistics of three reported data sets (up triangle, down triangle and square) and their union (solid circle) are shown. The red curve gives the estimated distribution under a maximum-likelihood scheme. Grey thin curves are generated with bootstrapping (see the “Methods” section). MLE maximum-likelihood estimation. b The infectiousness function. The data set contains 66 transmission pairs. Result of the MLE is given by two exponential functions meeting at −0.68 days (red solid line). Also shown are distributions with a constant bridge (dash line), or with a dome cap (dash-dotted line), with slightly lower likelihood values (see Supplementary Section 2.2). Thin grey curves are from bootstrapping for model #1 (see the “Methods” section). c Serial interval statistics outside the Hubei province in China from January 9 to February 13, 2020,: whole period (solid circles), first two weeks (open squares), and last two weeks (open triangles). The grey dashed line on the right indicates exponential decay at a rate −0.31/day. The red curve is the convolution of the two red curves shown in a and b.
Fig. 3
Fig. 3. Basic model predictions.
a The relationship between the epidemic growth rate λ and the mean reproduction number RE. The grey lines, generated using the data shown in Fig. 2 with bootstrapping, give the range of uncertainty in the estimated function. At λ = 0.3/day, RE = R0 = 3.87. CI stands for confidence interval. b Probabilities for an infected individual being in each of the four phases on day t after infection. The thick red line indicates the boundary between the pre-symptomatic and symptomatic phases. c Percentage of the infected population in each of the phases when the epidemic is growing at a rate λ. The thick red curve indicates the boundary between the pre-symptomatic and symptomatic population.
Fig. 4
Fig. 4. Reduction of the mean reproduction number upon intervention.
a Testing. Results are given for testing with 0 or 1 day reporting delay (blue and red curves), respectively. CI confidence interval. b Contact tracing and isolation. Results are shown for 100% (blue) and 80% (red) success rates, respectively. The 95% CIs of the estimated quantities in a and b (shaded areas) were obtained through bootstrap resampling with 1000 replications symptom onset times of 347 cases,, and exposure windows of 66 transmission pairs. c Mask-wearing in combination with contact tracing. The heatmap gives the reduced RE when contact tracing is implemented within 5 days after infection, assuming a basal value of 3.87. The solid black line marks the percentages required to reduce RE to 1. The dash-dotted line and the dashed line map out the percentages required to flatten the epidemic growth when the time frame for contact tracing is reduced to 2 days or relaxed to 8 days, respectively.
Fig. 5
Fig. 5. Growth and containment of the COVID-19 pandemic in mainland China.
Daily confirmed cases in Hubei and other provinces since the Wuhan lockdown on January 23, 2020. a Hubei province. The three phases of the epidemic development are shaded with different colours: exponential growth (red), crossover (yellow), and descent phase (green). Early exponential growth reached a rate λ at ~0.3/day (left dashed line). Growth slowed and entered the crossover phase in the middle of the second week, and reached the third phase nearly 4 weeks later. The final descent that began in the beginning of March is characterised by λ = −0.31/day (right dashed line). The incubation period distribution is shown in open circles (reported data of 347 cases,,) and red line (maximum-likelihood estimation) to compare with the exponential decay. Start of the incubation period is indicated by the red arrow. b Other provinces in China. The epidemic development in the affected provinces followed similar temporal patterns. Also shown is the model prediction of the daily confirmed cases (solid line), with details given in Supplementary Section 4.4. Newly confirmed cases from March onward (white region) are largely imported. Data for the Diamond Princess cruise ship is included for comparison (asterisks).
Fig. 6
Fig. 6. First wave of the COVID-19 pandemic in selected countries and regions.
a–c The number of daily confirmed cases from late January till end of March 2020. Countries/regions in a were successful in keeping transmission at a low level while those in b experienced exponential growth of local cases. Countries/regions in c have entered or been in the middle of phase II. Italy, South Korea, and Switzerland have reached zero or negative growth in daily confirmed cases, while data from Iran indicates a slowing down of the exponential growth. d The estimated epidemic growth rate λ(T) against the cumulative number of confirmed cases N(T) in five representative countries. Dashed and dashed-dotted lines indicate the exponential growth rates of 0.3/day and 0.1/day, respectively.

Similar articles

Cited by

References

    1. World Health Organization. Coronavirus Disease 2019 (COVID-19) Situation Report-71 (World Health Organization, accessed 31 March 2020); https://www.who.int/docs/default-source/coronaviruse/situation-reports/2....
    1. Wu F, et al. A new coronavirus associated with human respiratory disease in China. Nature. 2020;579:265–269. doi: 10.1038/s41586-020-2008-3. - DOI - PMC - PubMed
    1. World Health Organization. Coronavirus disease (COVID-19) Weekly Epidemiological Update-15 December 2020https://www.who.int/publications/m/item/weekly-epidemiological-update---....
    1. World Health Organization. WHO Director-General’s opening remarks at the media briefing on COVID-19—11 March 2020 (World Health Organization, accessed 13 March 2020); https://www.who.int/dg/speeches/detail/who-director-general-s-opening-re....
    1. Anderson RM, et al. How will country-based mitigation measures influence the course of the COVID- 19 epidemic? Lancet. 2020;395:931–934. doi: 10.1016/S0140-6736(20)30567-5. - DOI - PMC - PubMed

Publication types