. 2021 Feb 19;12(1):1162.
doi: 10.1038/s41467-021-21444-5.

Evolution of immune responses to SARS-CoV-2 in mild-moderate COVID-19

Affiliations

Evolution of immune responses to SARS-CoV-2 in mild-moderate COVID-19

Adam K Wheatley et al. Nat Commun. .

Abstract

The durability of infection-induced SARS-CoV-2 immunity has major implications for reinfection and vaccine development. Here, we show a comprehensive profile of antibody, B cell and T cell dynamics over time in a cohort of patients who have recovered from mild-moderate COVID-19. Binding and neutralising antibody responses, together with individual serum clonotypes, decay over the first 4 months post-infection. A similar decline in Spike-specific CD4+ and circulating T follicular helper frequencies occurs. By contrast, S-specific IgG+ memory B cells consistently accumulate over time, eventually comprising a substantial fraction of circulating the memory B cell pool. Modelling of the concomitant immune kinetics predicts maintenance of serological neutralising activity above a titre of 1:40 in 50% of convalescent participants to 74 days, although there is probably additive protection from B cell and T cell immunity. This study indicates that SARS-CoV-2 immunity after infection might be transiently protective at a population level. Therefore, SARS-CoV-2 vaccines might require greater immunogenicity and durability than natural infection to drive long-term protection.


Conflict of interest statement

The authors declare no competing interests.

Figures

Fig. 1
Fig. 1. Dynamics of serological responses to SARS-CoV-2.
a Timeline of sample collection for each cohort participant (n = 64 participants, 158 total samples). Samples included only in serological analysis are indicated in black (n = 33); samples included in both serological and cellular immune analysis are indicated in red (n = 31). Shaded areas indicate early (<50 days) and late (>100 days) convalescent time periods, and dashed line indicates day 70 midpoint. b Longitudinal microneutralisation endpoint titre and c inhibition of ACE2 binding (%) for individuals. Best fit two-phase decay slope (red line) is indicated. Uninfected control participants (n = 26 for ACE2 binding inhibition and n = 7 for microneutralisation) are shown on the left side of each graph. Horizontal dashed lines indicate the upper 90th percentile value of the uninfected control cohort for RBD-ACE2 inhibition and a conservative threshold of 1:20 for microneutralisation. d Individual kinetics and best fit decay slopes for IgG binding to spike (S), IgG binding to nucleoprotein (N), IgM binding to S and IgA1 binding to S. N = 63 for IgA1. Uninfected control participants (n = 32) are shown on the left side of each graph and horizontal dashed lines indicate the upper 90th percentile value of the uninfected control cohort. e Estimated half-life and confidence intervals of the neutralising antibody titre before day 70 (red) and after day 70 post-symptom onset (blue) are indicated as dashed vertical lines. Estimated early decay rates and confidence intervals for serological inhibition of ACE2 and antibody binding titres are indicated (single phase decay is shown in grey, two-phase decay indicated in red/blue). Horizontal dashed lines indicate the median value of the uninfected control cohort (n = 32). If no dashed line is shown, the control cohort median lies at or below the y-axis limit. Source data are provided as a Source Data file.
Fig. 2
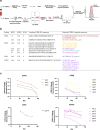
Fig. 2. Mass spectrometry-based quantification of immunoprecipitated S1-specific clonotypic antibodies.
a Combined B cell receptor sequencing and proteomics platform enables identification and quantification of circulating anti-S1 antibodies. S1-specific IgG was purified from plasma of SARS-CoV-2 convalescent participants using antigen-coupled magnetic beads and heavy chains subject to LC-MC/MS. Peptide spectra are searched against B cell receptor sequencers recovered from single sorted S-specific memory B cells from the same individuals to identify clonotypes based upon CDR-H3 amino acid sequence. Clonotype specific peptides are then used as barcodes for relative quantitative parallel reaction monitoring (PRM) for tracking in longitudinal plasma samples. Targeted peptides are monitored during elution from HPLC and individual peptides quantified based on abundance chromatography curves. PBMCs peripheral blood mononuclear cells, LC-MS/MS liquid chromatography mass spectrometry/mass spectrometry, CDR-H3 heavy-chain third complementarity-determining region. b Clonotypes identified based on matched CDR-H3 sequences from S1-specific plasma IgG and B cell receptor sequences from SARS-CoV-2 convalescent participants (n = 4). c Longitudinal changes in the relative plasma abundance of anti-S1 clonotypes within four convalescent participants over time. The quantity of each reference peptide is expressed as area under the curve (AUC) derived from extracted ion chromatography. For participants CP04, CP08, and CP63, each experiment was repeated independently three times with similar results and data are presented as mean value. For subject FCP01, experiment was repeated independently twice with similar results, and data are presented as the mean value. Source data are provided as a Source Data file.
Fig. 3
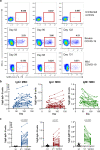
Fig. 3. Quantification of S-specific memory B cell responses.
a Staining class-switched B cells (CD19 + IgD-) with SARS-CoV-2 spike probes allows the tracking of antigen-specific cells in participants previously infected with SARS-CoV-2, shown relative to uninfected controls. Longitudinal plots from a single individual with severe infection or a single individual with mild infection are shown. b Frequencies of S-specific IgG+, IgA+, or IgM+ memory B cells as a proportion of CD19+ CD20+ IgD− B cells in PBMC samples were assessed longitudinally (n = 31 participants). c Comparison of S-specific IgG+, IgA+, or IgM+ memory B cell frequencies at the earliest and latest timepoint available for each individual (n = 31). Median background in uninfected (UI) controls (n = 20) is indicated. Statistics assessed by two-tailed Wilcoxon test. Source data are provided as a Source Data file.
Fig. 4
Fig. 4. Quantification of antigen-specific CD4+ and CD8+ T cell responses.
a Representative staining of AIM markers (CD25, OX-40) on CD4+ Tmem cells (CD3+ CD4+ CD8-CD45RA-CXCR5-) or AIM markers (CD69, CD137) on CD8+ Tmem cells (CD3+ CD8+ CD4-non-naïve) after stimulation with vehicle, S1 or S2 peptide pools in an uninfected individual. b Representative staining of AIM markers on CD4+ Tmem cells in longitudinal samples from 1 participant (top row, day 33; middle row, day 61; bottom row, day 143). c Representative staining of AIM markers on CD8+ Tmem cells in longitudinal samples from 1 participant (top row, day 41; middle row, day 85; bottom row, day 120). d Longitudinal changes in the frequency of total S (S1 + S2 pool responses after background subtraction)-specific responses among CD4+ Tmem, cTFH, and CD8+ Tmem subsets (n = 31). e Comparison of S-specific T cell responses at the earliest and latest timepoint available for each individual (n = 31). Statistics assessed by two-tailed Wilcoxon test. Source data are provided as a Source Data file.
Fig. 5
Fig. 5. Modelling of concomitant immune responses after COVID-19.
a Rates of decay of serological neutralisation activity, ACE2 binding inhibition, and S-specific IgG, IgM and IgA following recovery from SAR-CoV-2 infection. Baseline levels are set to 100% of that of the mean responses at visit 1 (median 40 days, shown in Fig. 1a). b Fitted Growth and decay rates for S-specific memory T cell and B cell frequencies in PBMC. The neutralising antibody decay curve (black line) is shown for comparison purposes. c Simulation of elicitation and decay of serological neutralisation activity in 1000 individuals based on distributions observed in our SARS-CoV-2 convalescent cohort. The simulation was repeated 1000 times to estimate the proportion of individuals maintaining a neutralisation titre above 1:40 across multiple simulations (median and 95% confidence intervals shown in red). Source data are provided as a Source Data file.

References

    1. Deng W, et al. Primary exposure to SARS-CoV-2 protects against reinfection in rhesus macaques. Science. 2020;369:818–823. doi: 10.1126/science.abc5343. - DOI - PMC - PubMed
    1. Chandrashekar A, et al. SARS-CoV-2 infection protects against rechallenge in rhesus macaques. Science. 2020;369:812–817. doi: 10.1126/science.abc4776. - DOI - PMC - PubMed
    1. To, K. K. et al. COVID-19 re-infection by a phylogenetically distinct SARS-coronavirus-2 strain confirmed by whole genome sequencing. Clin. Infect. Dis.10.1093/cid/ciaa1275 (2020). - PMC - PubMed
    1. Amanna IJ, Carlson NE, Slifka MK. Duration of humoral immunity to common viral and vaccine antigens. N. Engl. J. Med. 2007;357:1903–1915. doi: 10.1056/NEJMoa066092. - DOI - PubMed
    1. Edridge AWD, et al. Coronavirus protective immunity is short-lasting. Nat. Med. 2020;26:1691–1693. doi: 10.1038/s41591-020-1083-1. - DOI - PubMed

Publication types